
In recent years, the increasing emission of greenhouse gases, primarily carbon dioxide, due to industrialization has become a global concern. As a foundational sector in traditional manufacturing, sand casting plays a critical role in producing metal components, yet it is also a significant source of resource consumption and environmental pollution. The energy utilization rate in sand casting is often as low as 15% to 25%, with waste emissions far exceeding those in developed regions, highlighting substantial potential for carbon reduction. To address this, I focus on developing a quantitative carbon emission calculation method for individual castings in sand casting processes, integrating lifecycle theory to provide a detailed assessment framework. This approach aims to support decarbonization strategies in the foundry industry by enabling precise carbon footprint tracking for each casting produced.
The carbon emission calculation for industrial processes typically relies on two main methodologies: input-output (IO) analysis and process analysis (PA). The IO method, such as that outlined in the IPCC guidelines, offers a top-down approach that balances total inputs and outputs for macro-level assessments but lacks granularity. In contrast, the PA method, aligned with standards like ISO 14067 and PAS 2050, adopts a bottom-up approach by detailing material, energy, and process inventories to compute emissions through specific coefficients. For sand casting, which involves complex stages like molding, melting, recycling, and machining, a hybrid model combining IO and PA is essential to capture both broad and detailed carbon sources. In this article, I propose such a model to quantify emissions for single castings, leveraging lifecycle theory to analyze each production phase’s contributions. This enables targeted reductions in sand casting operations, from material selection to energy optimization.
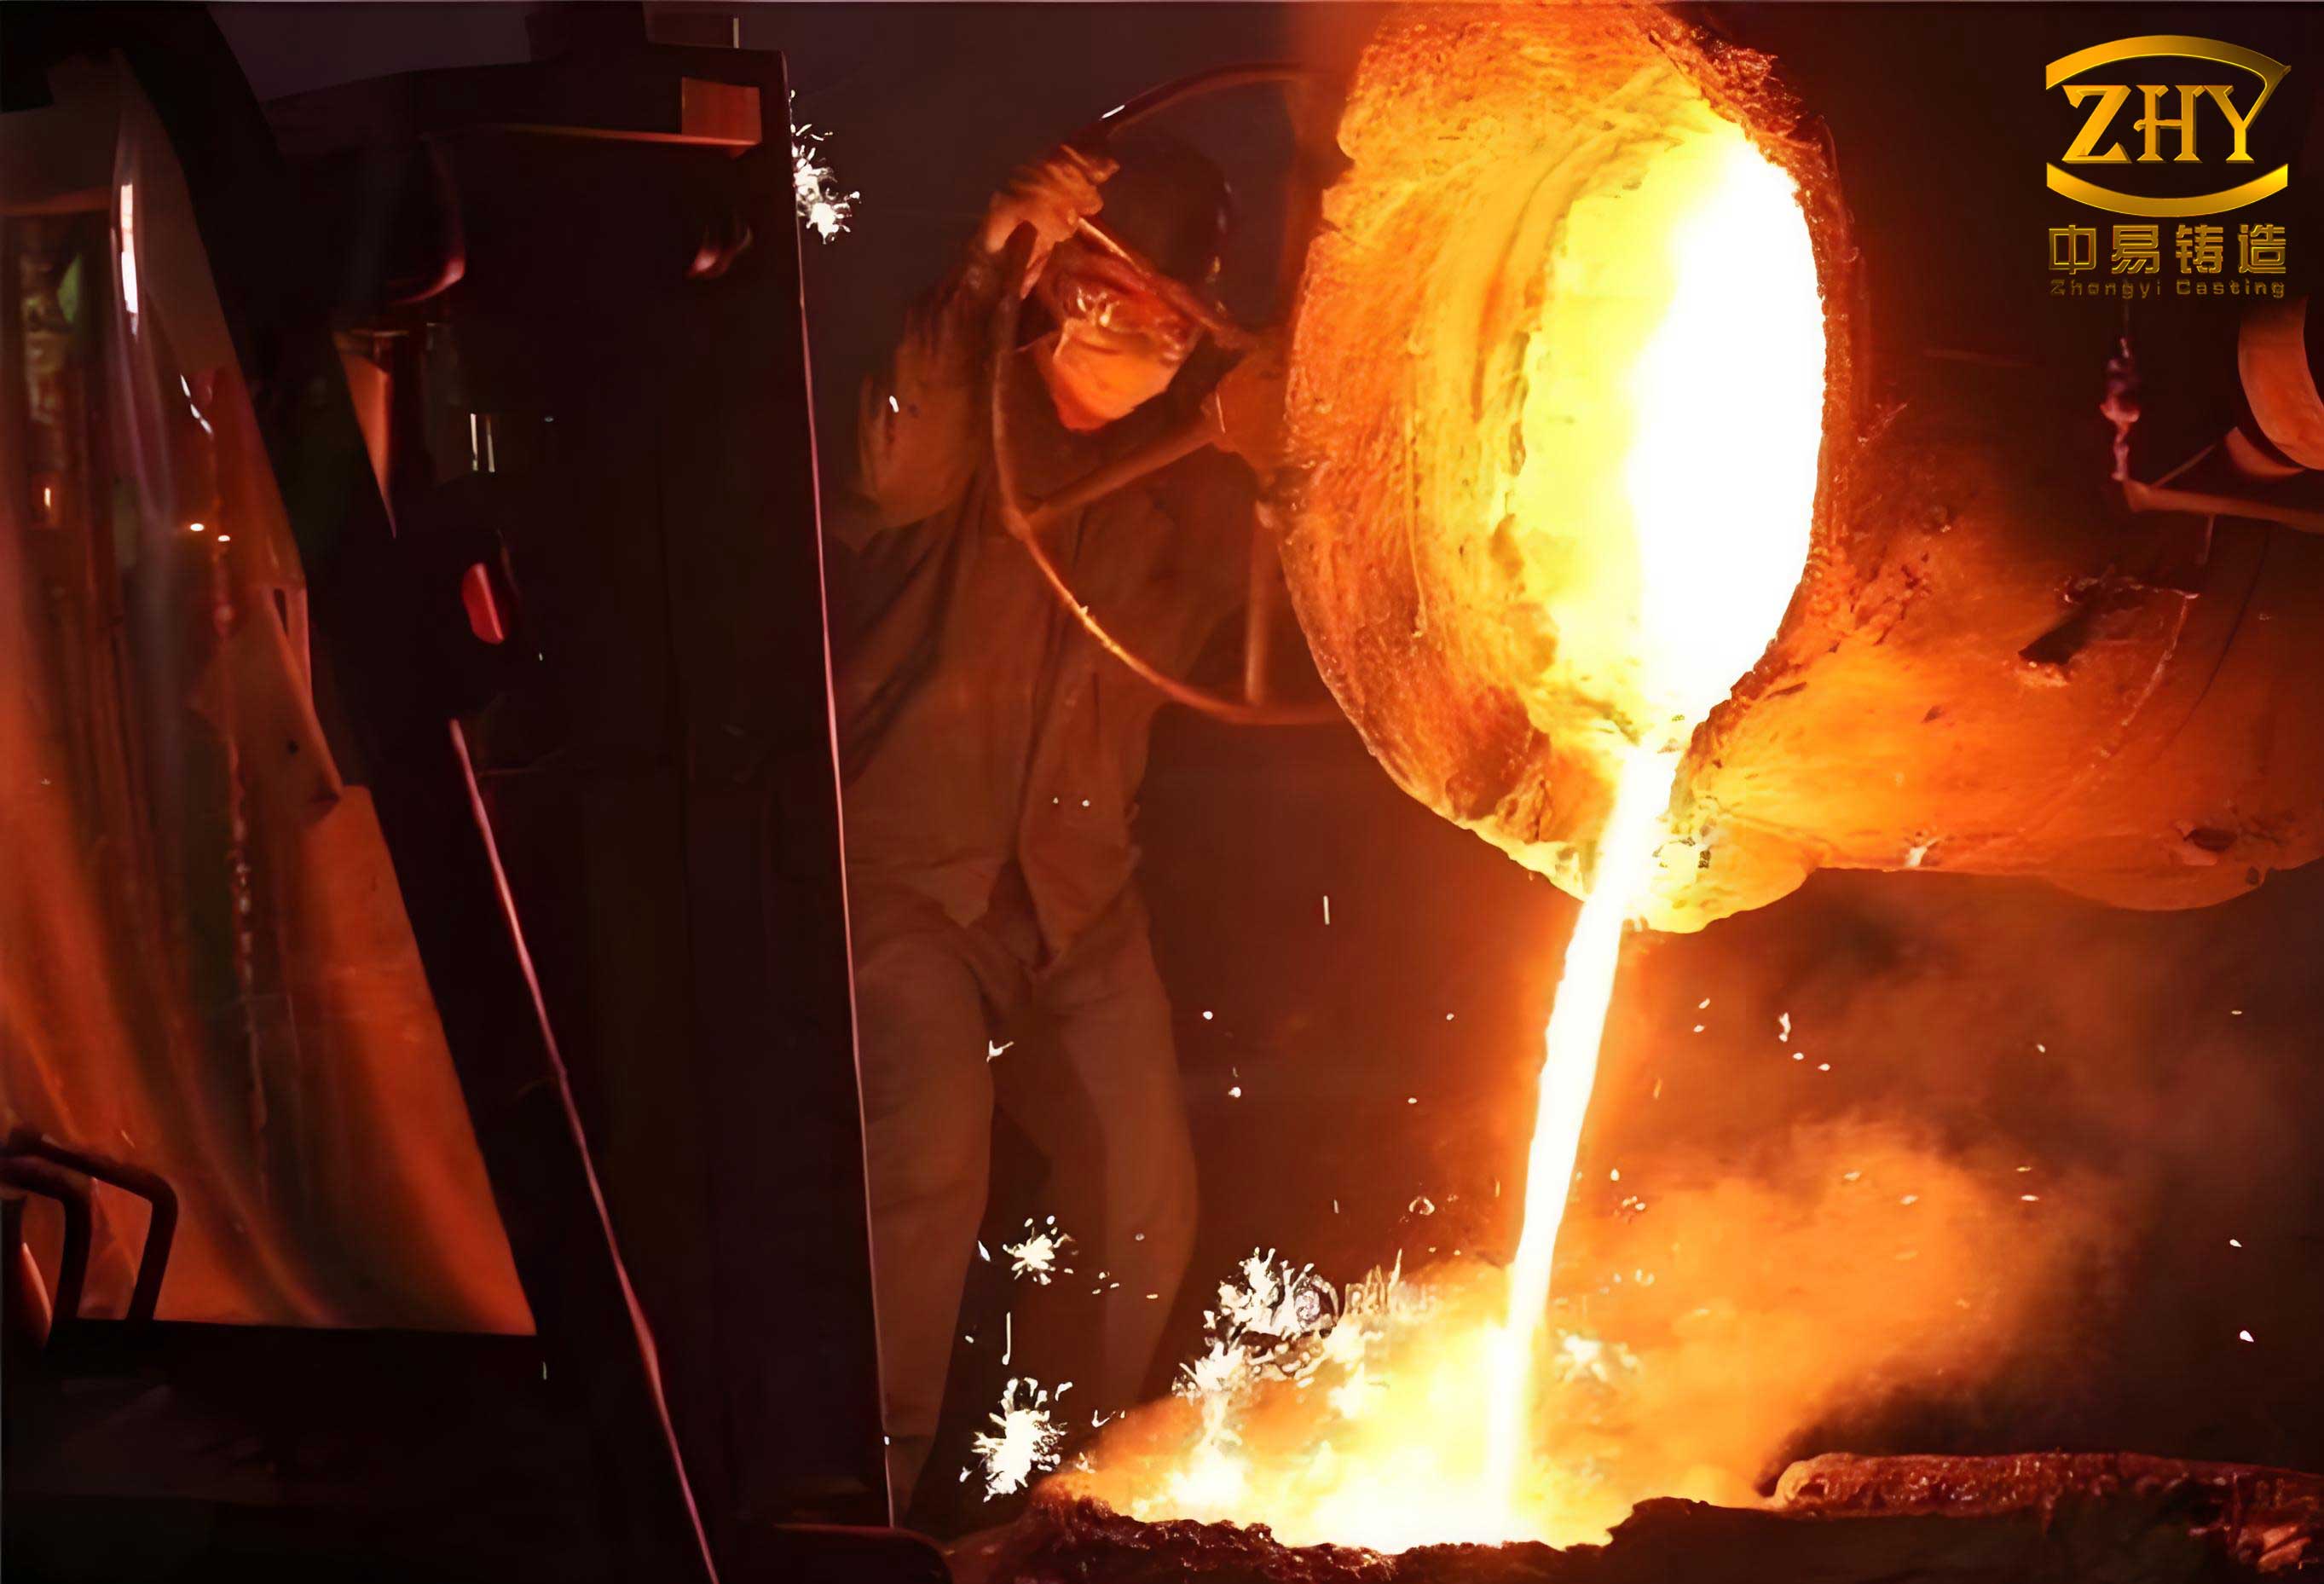
The sand casting process is divided into four key stages: molding, melting, recycling, and machining. Each stage generates carbon emissions through three primary sources: material carbon emissions from indirect emissions due to material consumption, energy carbon emissions from equipment power usage, and waste carbon emissions from the treatment of by-products like dust, gases, and solids. To establish a systematic boundary, I consider direct emissions from on-site processes and indirect emissions from upstream and downstream activities. For sand casting, the system boundary encompasses all inputs and outputs within these stages, excluding external factors like raw material extraction or end-of-life disposal. This focused scope allows for a practical calculation model that can be applied in batch production settings, where emissions are allocated to individual castings based on their weight and process parameters.
To quantify carbon emissions in sand casting, I develop a comprehensive model that breaks down emissions into material, energy, and waste components. The total carbon emission \( C_d \) for a casting \( d \) is expressed as the sum of these contributions:
$$ C_d = CM_d + CE_d + CU_d $$
where \( CM_d \) is the material carbon emission, \( CE_d \) is the energy carbon emission, and \( CU_d \) is the waste carbon emission. Each component is derived from specific formulas that account for the unique characteristics of sand casting operations. By using this model, foundries can apportion emissions from bulk production to single castings, facilitating better environmental management and compliance with carbon reduction targets.
Material carbon emissions in sand casting arise from the consumption of materials such as resin sand, iron charge materials (e.g., scrap steel, pig iron), and auxiliary items like refractory coatings. These emissions are categorized into variable and fixed emissions. Variable emissions depend on casting-specific parameters like weight and sand-to-metal ratio, while fixed emissions are allocated based on overall production output. For the molding stage, the variable material carbon emission \( C^1_{VR,d} \) is calculated using the sand-to-metal ratio and resin sand recovery rate:
$$ R^1 = \frac{\rho_b (V_x – V_d)}{M_d} $$
$$ C^1_{VR,d} = M_d R^1 (1 – \eta) f_b $$
Here, \( M_d \) is the weight of casting \( d \), \( R^1 \) is the sand-to-metal ratio, \( \eta \) is the resin sand recovery rate, \( f_b \) is the carbon emission factor of resin sand, \( \rho_b \) is the density of resin sand, \( V_x \) is the mold flask volume, and \( V_d \) is the casting volume. The fixed material carbon emission \( C^1_{ST,d} \) for molding is:
$$ C^1_{ST,d} = \sum_{c=1}^{c_0} \frac{I^1_c}{O_d} f_c $$
where \( I^1_c \) is the consumption of fixed material \( c \) over a period, \( O_d \) is the output of casting \( d \), and \( f_c \) is the carbon emission factor of material \( c \). Thus, the total material carbon emission for molding \( CM^1_d \) is:
$$ CM^1_d = M_d R^1 (1 – \eta) f_b + \sum_{c=1}^{c_0} \frac{I^1_c}{O_d} f_c $$
In the melting stage, material carbon emissions come from iron charge materials. The emission \( CM^2_d \) is computed as:
$$ CM^2_d = M_d (1 + M_{IR}) \sum_{g=1}^{g_0} R^2_g f_g $$
where \( M_{IR} \) is the ratio of pouring surplus to casting weight, \( R^2_g \) is the proportion of iron charge material \( g \) in the total molten iron, and \( f_g \) is its carbon emission factor. For recycling and machining stages, material emissions are fixed and given by:
$$ CM^3_d = \sum_{c=1}^{c_0} \frac{I^3_c}{O_d} f_c $$
$$ CM^4_d = \sum_{c=1}^{c_0} \frac{I^4_c}{O_d} f_c $$
Aggregating across all stages, the total material carbon emission \( CM_d \) for sand casting is:
$$ CM_d = M_d R^1 (1 – \eta) f_b + M_d (1 + M_{IR}) \sum_{g=1}^{g_0} R^2_g f_g + \sum_{a=1}^{4} \sum_{c=1}^{c_0} \frac{I^a_c}{O_d} f_c $$
Energy carbon emissions stem from electricity consumption by equipment such as sand mixers, melting furnaces, cranes, and shot blasting machines. For each stage, the energy carbon emission is derived from device power ratings and operating times. In molding, the emission \( CE^1_d \) includes contributions from sand mixers and cranes:
$$ CE^1_d = \left( \sum_{l=1}^{l_0} \frac{p_l M_d R^1}{v_l} + \sum_{m_1=1}^{m_1_0} \frac{p_{m_1} s_{m_1}}{v_{m_1}} \right) f_e $$
where \( p_l \) is the power of sand mixer \( l \), \( v_l \) is its mixing efficiency, \( p_{m_1} \) is the crane power, \( s_{m_1} \) is the搬运 distance, \( v_{m_1} \) is the crane speed, and \( f_e \) is the carbon emission factor of electricity. For melting, the emission \( CE^2_d \) involves furnace energy and crane usage:
$$ CE^2_d = M_d (1 + M_{IR}) E_n f_e + \sum_{m_2=1}^{m_2_0} \frac{p_{m_2} s_{m_2}}{v_{m_2}} f_e $$
Here, \( E_n \) is the electricity consumption per ton of molten iron for furnace \( n \). In recycling, the emission \( CE^3_d \) accounts for sand treatment lines and cranes:
$$ CE^3_d = M_d R^1 E_o f_e + \sum_{m_3=1}^{m_3_0} \frac{p_{m_3} s_{m_3}}{v_{m_3}} f_e $$
where \( E_o \) is the electricity per ton of resin sand processed. For machining, the emission \( CE^4_d \) includes shot blasting and crane operations:
$$ CE^4_d = \left( \sum_{u=1}^{u_0} p_u t_u + \sum_{m_4=1}^{m_4_0} \frac{p_{m_4} s_{m_4}}{v_{m_4}} \right) f_e $$
The total energy carbon emission \( CE_d \) for sand casting is the sum of these stage emissions:
$$ CE_d = \left( \sum_{l=1}^{l_0} \frac{p_l M_d R^1}{v_l} + \sum_{m_1=1}^{m_1_0} \frac{p_{m_1} s_{m_1}}{v_{m_1}} \right) f_e + M_d (1 + M_{IR}) E_n f_e + M_d R^1 E_o f_e + \left( \sum_{u=1}^{u_0} p_u t_u + \sum_{m_4=1}^{m_4_0} \frac{p_{m_4} s_{m_4}}{v_{m_4}} \right) f_e $$
Waste carbon emissions result from treating by-products like dust, fumes, and slag. These are calculated based on waste generation rates and treatment device能耗. For molding, the waste emission \( CU^1_d \) from dust and volatile organic compounds is:
$$ CU^1_d = M_d \frac{M^1_{U1}}{v_{w1}} p_{w1} f_e $$
where \( M^1_{U1} \) is the waste generation per ton of casting, \( p_{w1} \) is the power of dust treatment device \( w1 \), and \( v_{w1} \) is its processing speed. In melting, emissions \( CU^2_d \) include fume treatment and slag handling:
$$ CU^2_d = M_d \frac{M^2_{U1}}{v_{w2}} p_{w2} f_e + M_d \frac{M^2_{U2}}{M_{i2}} \frac{s_{i2}}{v_{i2}} p_{i2} f_e $$
where \( M^2_{U2} \) is solid waste per ton, \( p_{i2} \) is the transport device power, \( s_{i2} \) is distance, \( v_{i2} \) is speed, and \( M_{i2} \) is transport capacity per trip. For recycling and machining, waste emissions \( CU^3_d \) and \( CU^4_d \) are:
$$ CU^3_d = M_d \frac{M^3_{U1}}{v_{w3}} p_{w3} f_e $$
$$ CU^4_d = M_d \frac{M^4_{U1}}{v_{w4}} p_{w4} f_e $$
The total waste carbon emission \( CU_d \) is:
$$ CU_d = M_d f_e \left( \sum_{a=1}^{4} \frac{M^a_{U1}}{v_{wa}} p_{wa} \right) + M_d \frac{M^2_{U2}}{M_{i2}} \frac{s_{i2}}{v_{i2}} p_{i2} f_e $$
Combining all components, the overall carbon emission \( C_d \) for a casting in sand casting is given by:
$$ C_d = M_d R^1 (1 – \eta) f_b + M_d (1 + M_{IR}) \sum_{g=1}^{g_0} R^2_g f_g + \sum_{a=1}^{4} \sum_{c=1}^{c_0} \frac{I^a_c}{O_d} f_c + \left( \sum_{l=1}^{l_0} \frac{p_l M_d R^1}{v_l} + \sum_{m_1=1}^{m_1_0} \frac{p_{m_1} s_{m_1}}{v_{m_1}} \right) f_e + M_d (1 + M_{IR}) E_n f_e + M_d R^1 E_o f_e + \left( \sum_{u=1}^{u_0} p_u t_u + \sum_{m_4=1}^{m_4_0} \frac{p_{m_4} s_{m_4}}{v_{m_4}} \right) f_e + M_d f_e \left( \sum_{a=1}^{4} \frac{M^a_{U1}}{v_{wa}} p_{wa} \right) + M_d \frac{M^2_{U2}}{M_{i2}} \frac{s_{i2}}{v_{i2}} p_{i2} f_e $$
To illustrate the application of this model, I consider a case study of a locking disc casting used in wind power equipment. The casting is made of ductile iron QT500-14 with a weight of 6,932 kg. Key parameters for the sand casting process are summarized in tables below. The carbon emission factors for materials and energy are based on literature and industry data, ensuring realistic assessments. For instance, the sand-to-metal ratio \( R^1 \) is calculated as 8.25 using mold flask dimensions, and the resin sand recovery rate \( \eta \) is 93%. The iron charge composition includes scrap steel, pig iron, returns, carburizer, silicon carbide, and ferrosilicon, with proportions detailed in a table.
| Material/Energy | Carbon Emission Factor | Unit |
|---|---|---|
| Resin Sand | 0.02543 | kg CO₂/kg |
| Refractory Coating | 6.0232 | kg CO₂/kg |
| Methanol | 2.5 | kg CO₂/kg |
| Scrap Steel | 8.2 | kg CO₂/kg |
| Pig Iron | 2.13 | kg CO₂/kg |
| Returns | 2.67 | kg CO₂/kg |
| Carburizer | 4.2 | kg CO₂/kg |
| Silicon Carbide | 14.68 | kg CO₂/kg |
| Ferrosilicon | 2.3 | kg CO₂/kg |
| Steel Shot | 0.12 | kg CO₂/kg |
| Electricity | 0.93 | kg CO₂/kWh |
| Material | Proportion \( R^2_g \) (%) |
|---|---|
| Scrap Steel | 58.19 |
| Pig Iron | 24.69 |
| Returns | 14.26 |
| Carburizer | 2.20 |
| Silicon Carbide | 0.49 |
| Ferrosilicon | 0.17 |
| Stage | Waste Type | Generation (kg/ton) |
|---|---|---|
| Molding | Dust and Fumes | 0.586 |
| Melting | Fumes | 0.500 |
| Melting | Slag | 0.054 |
| Recycling | Dust | 1.050 |
| Machining | Dust | 0.011 |
Using the model, I compute the carbon emissions for the locking disc casting. The material carbon emission \( CM_d \) is calculated as 44,791.79 kg CO₂, with the melting stage contributing over 99% due to high-carbon materials like scrap steel. The energy carbon emission \( CE_d \) is 4,234.82 kg CO₂, primarily from the melting furnace and sand treatment. The waste carbon emission \( CU_d \) is 14.552 kg CO₂, a minor portion compared to others. The total emission \( C_d \) is approximately 49,041.16 kg CO₂, showcasing the dominance of material-related emissions in sand casting.
| Emission Type | Value (kg CO₂) | Percentage of Total |
|---|---|---|
| Material Carbon Emission | 44,791.79 | 91.3% |
| Energy Carbon Emission | 4,234.82 | 8.6% |
| Waste Carbon Emission | 14.55 | 0.1% |
| Total Carbon Emission | 49,041.16 | 100% |
This analysis reveals that material carbon emissions are the largest contributor in sand casting, emphasizing the importance of optimizing material usage and selecting low-carbon alternatives. For instance, reducing the sand-to-metal ratio or improving resin sand回收 rates can lower emissions in molding. In melting, adjusting the iron charge mix to include more低碳 materials like pig iron over scrap steel, or minimizing pouring surplus through better gating design, can significantly cut carbon footprints. Energy emissions, though smaller, offer reduction opportunities via efficient equipment and process controls, such as using high-efficiency furnaces or optimizing crane logistics in sand casting facilities. Waste emissions, while minimal, still warrant attention through improved treatment technologies.
The proposed model provides a practical tool for foundries to quantify carbon emissions per casting in sand casting, enabling data-driven decisions for sustainability. By integrating lifecycle theory with IO and PA methods, it addresses the gap in single-casting assessments and supports compliance with carbon regulations like China’s Carbon Peak Action Plan. Future work could expand the model to include upstream supply chain emissions or incorporate dynamic factors like real-time energy monitoring. Additionally, applying this approach to other casting processes, such as investment casting or die casting, could broaden its impact on the manufacturing sector.
In conclusion, I have developed a quantitative carbon emission calculation model for sand casting that allocates emissions from batch production to individual castings. Through detailed formulas for material, energy, and waste components, this model offers a comprehensive assessment framework. The case study of a wind power locking disc casting demonstrates its applicability, highlighting material emissions as the key target for reduction. By adopting such models, sand casting industries can enhance their environmental performance, contribute to global decarbonization goals, and foster a greener manufacturing future. This research underscores the value of lifecycle-based approaches in tackling industrial carbon challenges, paving the way for more sustainable sand casting practices worldwide.