
The development of complex, thin-walled castings like engine blocks represents one of the most significant challenges in the foundry industry. The inherent difficulties of producing sand castings with intricate geometries, non-uniform wall thicknesses, and stringent performance requirements traditionally led to protracted development cycles and high tooling costs. Each iteration of physical pattern modification and trial production consumed valuable time and resources. However, the paradigm has shifted decisively with the integration of computational numerical simulation into the core development workflow. Today, virtual prototyping is not merely an auxiliary tool but a fundamental pillar of modern foundry practice, indispensable for compressing development timelines, mitigating financial risk, and elevating product quality. In this account, I will detail our comprehensive approach to developing a new three-cylinder engine block using MAGMA simulation software, demonstrating how a digitally-driven process can optimize sand casting design before a single mold is poured.
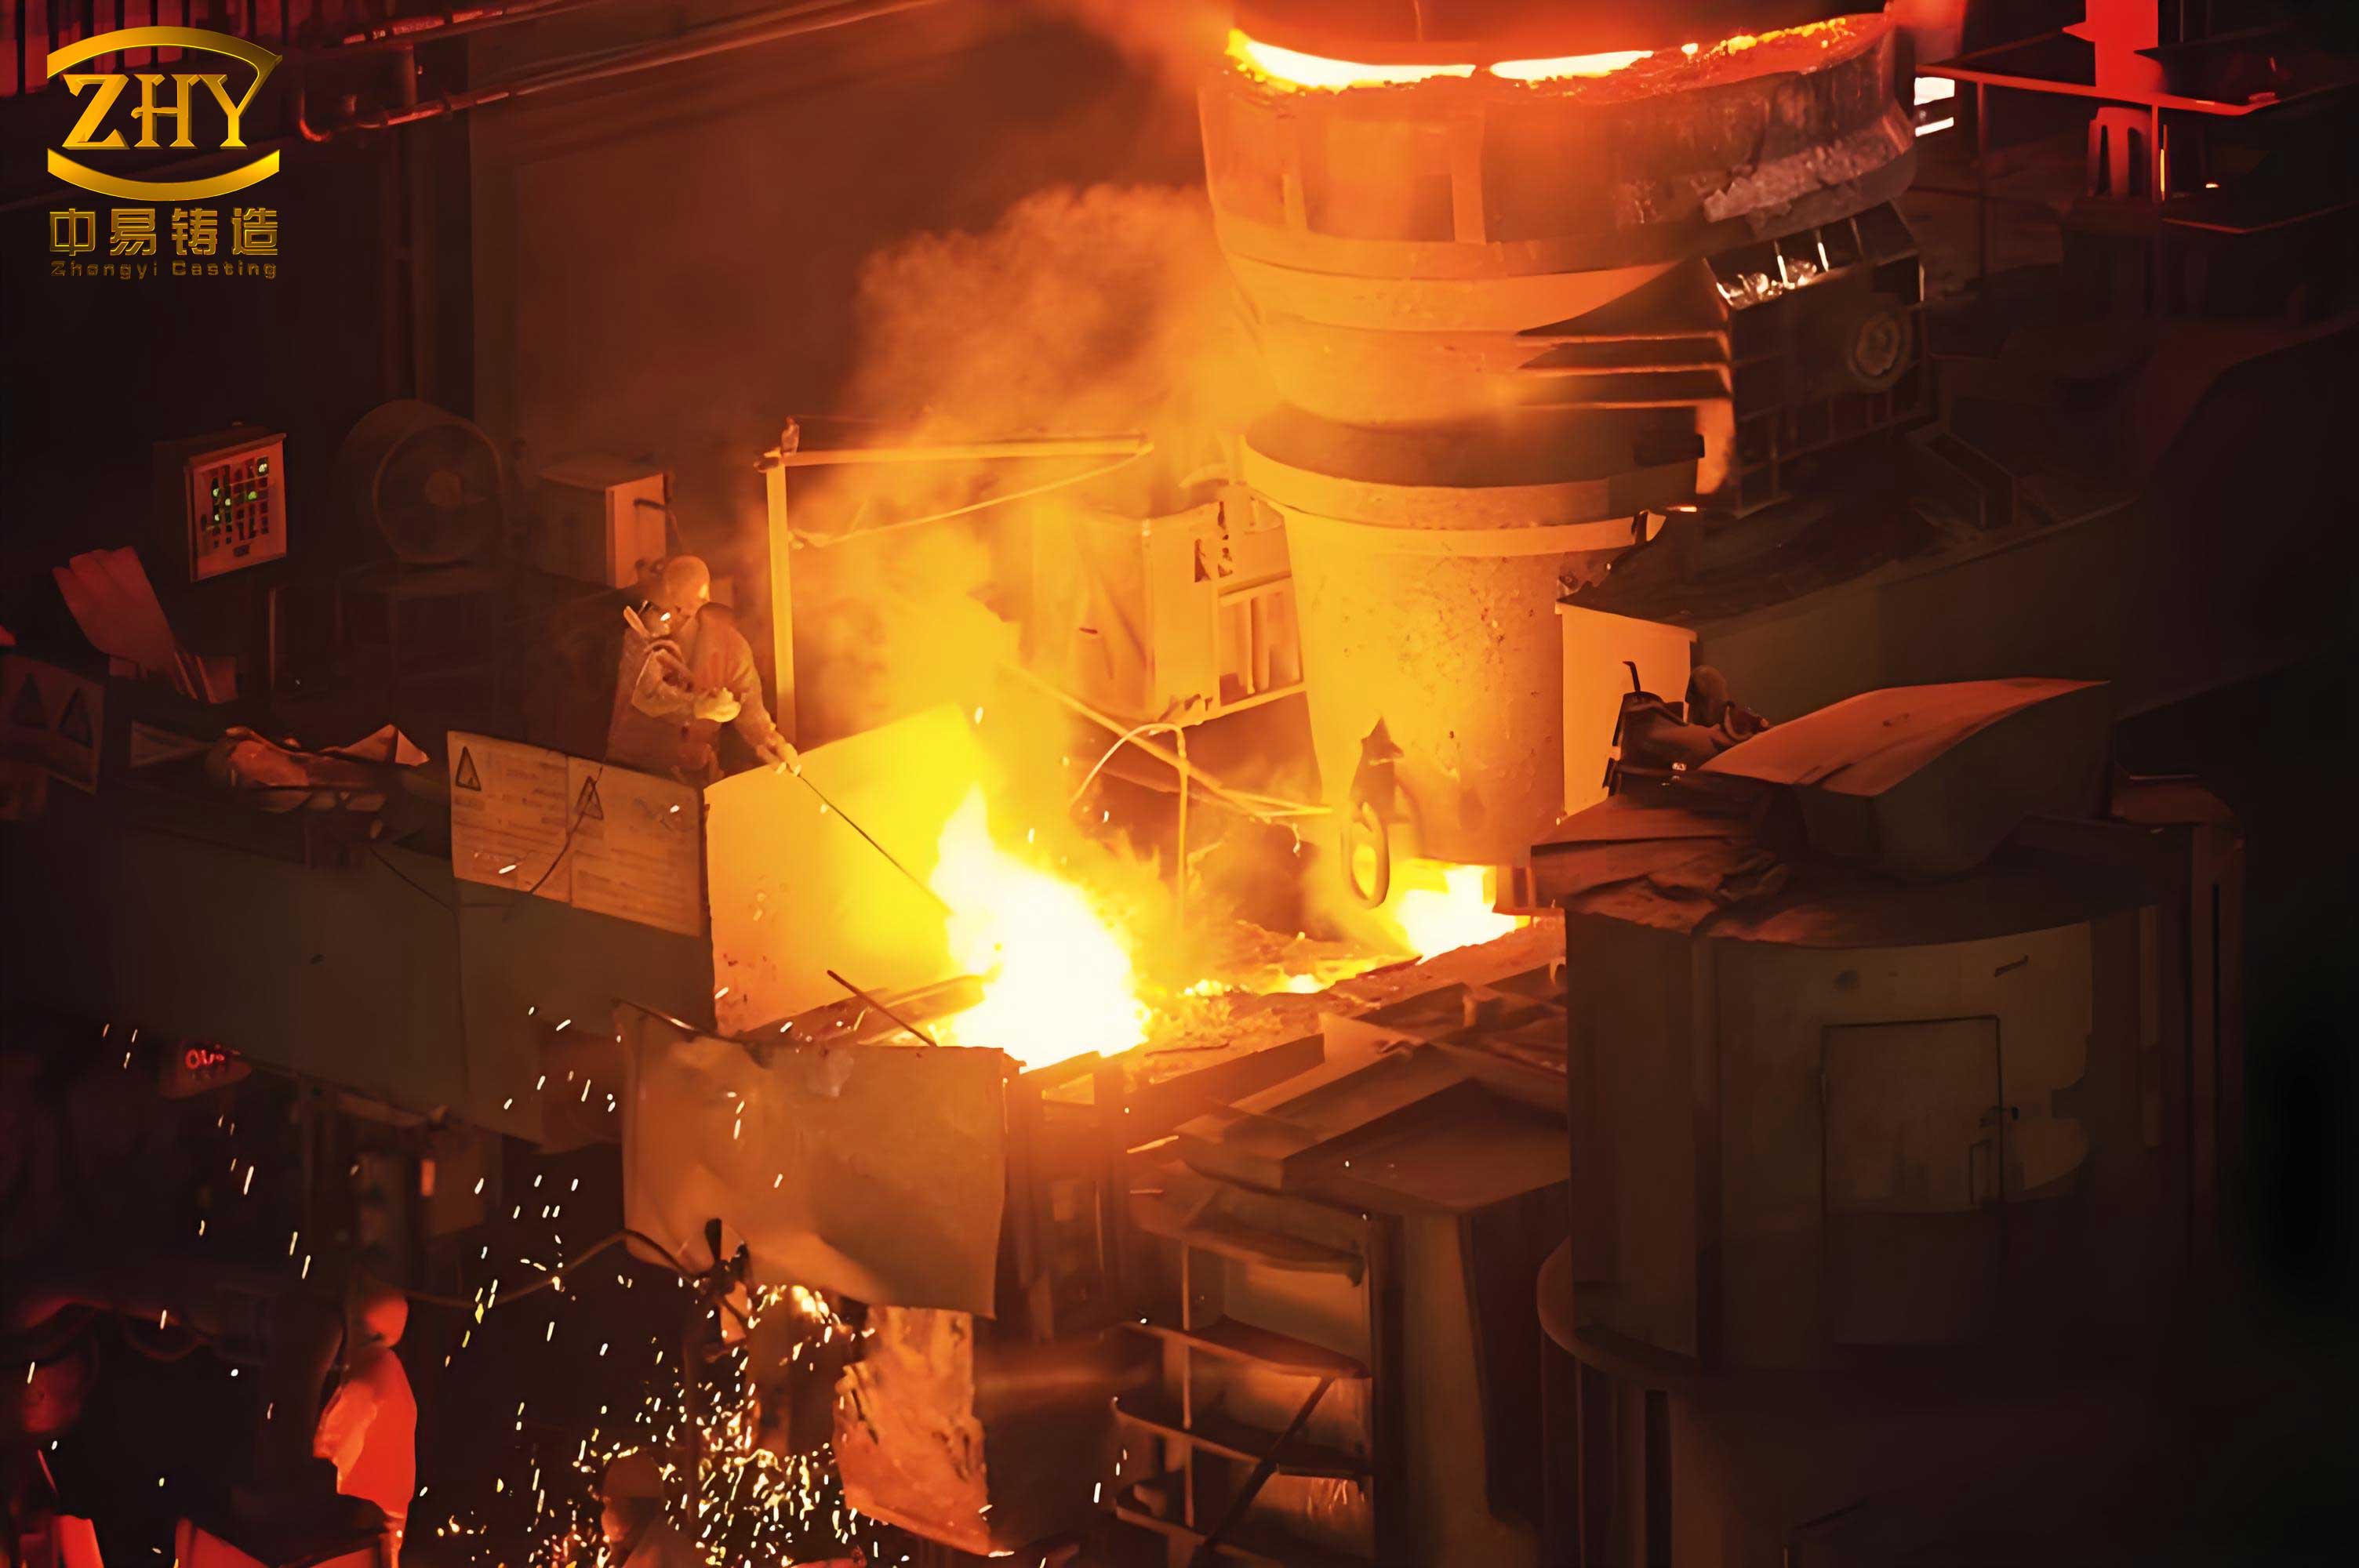
The component in question was a grey iron engine block with a compact envelope of 278mm x 253mm x 202mm and a nominal weight of 33.46 kg. Its defining characteristic was a highly complex external topology combined with critical minimum wall sections of just 3.5mm. Producing sound sand castings of this nature demands exceptional control over the filling and solidification dynamics to prevent defects such as mistruns, cold shuts, porosity, and hard spots that compromise mechanical integrity. Our primary objective was to design a robust gating and feeding system for a high-density molding layout—four castings per mold—using green sand technology, and to validate its performance entirely in the virtual domain.
From Traditional Trial-and-Error to Virtual Process Optimization
Historically, the development of such sand castings relied heavily on empirical knowledge and physical prototyping. The sequence involved initial pattern design, tooling fabrication, trial pours, destructive testing, pattern modification, and further trials—a cycle that could repeat multiple times. The costs associated with pattern rework and scrap production were substantial, and time-to-market was lengthy. The table below contrasts the traditional and virtual development approaches for complex sand castings.
| Aspect | Traditional Development | Virtual Development (Simulation-Driven) |
|---|---|---|
| Core Methodology | Empirical rules, physical trials | Physics-based computational modeling |
| Pattern/Tooling Cost | High (multiple revisions likely) | Significantly reduced (optimized before fabrication) |
| Development Cycle | Long (months for multiple trials) | Compressed (weeks for iterative simulation) |
| Defect Identification | Post-casting, destructive | Pre-casting, predictive & visual |
| Process Knowledge | Gained retrospectively | Gained proactively, enabling optimization |
| Risk | High (financial, timeline) | Managed and mitigated |
The fundamental equations governing the filling and solidification of sand castings provide the scientific basis for simulation. The filling process is described by the Navier-Stokes equations for fluid flow, coupled with the energy equation. For an incompressible flow (molten iron), these can be expressed as:
Continuity: $$\nabla \cdot \vec{v} = 0$$
Momentum (Navier-Stokes): $$\rho \left( \frac{\partial \vec{v}}{\partial t} + (\vec{v} \cdot \nabla) \vec{v} \right) = -\nabla p + \mu \nabla^2 \vec{v} + \rho \vec{g}$$
Energy: $$\rho c_p \left( \frac{\partial T}{\partial t} + (\vec{v} \cdot \nabla) T \right) = \nabla \cdot (k \nabla T) + \dot{Q}_{latent}$$ where \(\vec{v}\) is the velocity vector, \(p\) is pressure, \(\rho\) is density, \(\mu\) is dynamic viscosity, \(\vec{g}\) is gravity, \(c_p\) is specific heat, \(k\) is thermal conductivity, \(T\) is temperature, and \(\dot{Q}_{latent}\) is the latent heat source term from solidification.
Solidification is critically analyzed using criteria like the Niyama criterion (\(N_y\)), which helps predict shrinkage porosity in sand castings: $$N_y = \frac{G}{\sqrt{\dot{T}}}$$ where \(G\) is the temperature gradient and \(\dot{T}\) is the cooling rate. Regions with a Niyama value below a critical threshold are flagged as potential shrinkage sites.
Virtual Process Design and Simulation Setup
Our initial process design employed a pressurized, step-gated running system with ceramic filters. The goal was to achieve a rapid fill time of 12-15 seconds to prevent premature freezing in thin sections. A key feature was ensuring that the upper-tier gates became active concurrently with the lower gates to avoid cold metal overfalling cooler sand surfaces, a common cause of laps and cold shuts in such sand castings.
The preparatory phase for simulation is as crucial as the analysis itself. The fully assembled virtual mold—including the block cavities, all core packages (water jacket, crankcase, etc.), the gating system, filters, vents, and feeders—was constructed in CAD. This assembly was then decomposed into its constituent parts (cast part, individual cores, gates, etc.) and exported as STL files. This decomposition allows for the precise assignment of distinct material properties and boundary conditions to each component during simulation setup.
The heart of an accurate simulation is a high-quality computational mesh. The STL geometry was imported into MAGMA and discretized into approximately 49.8 million finite volume cells. This high mesh resolution is essential for capturing the complex geometry of engine block sand castings and resolving the critical thermal and flow gradients in thin walls. The material was defined as a grey iron with the following target composition, typical for high-strength sand castings:
| Element | Weight % |
|---|---|
| Carbon (C) | 3.25 |
| Silicon (Si) | 2.05 |
| Manganese (Mn) | 0.60 |
| Chromium (Cr) | 0.20 |
| Copper (Cu) | 0.50 |
| Phosphorus (P) | ≤ 0.10 |
| Sulfur (S) | ≤ 0.10 |
The boundary conditions were set to mirror production reality: a pouring temperature of 1440°C, initial sand core temperature of 25°C, and initial mold temperature of 40°C. Rather than a simple gravity pour, the filling was driven by a pressure-time curve applied to the top of the sprue, simulating the behavior of a automatic pouring furnace or a pressurized ladle system. This curve, increasing pressure over time, is vital for accurately modeling the filling kinetics of sand castings in modern foundry lines.
Simulation Results: A Deep Dive into Virtual Casting
The simulation provided a complete, time-resolved view of the casting process. During early stage filling (at 30% volume), metal entered the cavity primarily through the lower gates at a velocity of ~0.9 m/s, with the upper gates beginning to feed at ~0.5 m/s. This controlled initial velocity is critical for preventing sand erosion and mold wall impingement in green sand castings. By the mid-fill stage (60%), the flow had stabilized, with the upper gates now carrying a larger share of the flow (~0.8 m/s) and the lower gates at ~0.6 m/s, ensuring a balanced, progressive upward fill. The total simulated fill time was 10.883 seconds, well within our target window and confirming the feasibility of a fast, turbulent-free fill for these sand castings.
The thermal analysis revealed the solidification sequence. Critical sections like the bulkhead areas between cylinders and the main bearing webs showed directional solidification towards the designed feeders. The simulation of mechanical properties, based on calibrated microstructure and cooling rate models, provided a predictive map of the block’s performance. The cylinder bore regions, critical for wear resistance, showed a predicted hardness range of 202-209 HB. The main bearing cap areas, subject to high fatigue loads, showed a predicted tensile strength of 235-245 MPa. These values met the product specifications, providing confidence in the metallurgical outcome of the sand castings. The local mechanical properties can be correlated to the cooling rate using relationships derived from the solidification analysis, often expressed as: $$HV = A + B \cdot \log(\dot{T})$$ where \(HV\) is hardness, \(\dot{T}\) is the local cooling rate, and \(A\) and \(B\) are material-dependent constants.
From Virtual Prediction to Physical Reality: Results Correlation
The ultimate validation of any simulation is its correlation with physical production. The tooling was manufactured based on the simulation-optimized design. Over the course of five sample production runs, the actual pouring time was measured between 12 and 14 seconds—a close match to the simulated 10.9 seconds, with the minor discrepancy attributable to real-world factors like slight metal temperature variations and furnace pressure control. The quality yield from the first sample batches was exceptionally high, exceeding 90%. Most importantly, the measured mechanical properties on the produced sand castings aligned remarkably well with the simulation forecasts.
| Production Batch | Quantity Produced | First-Pass Yield | Measured Cylinder Hardness (HB) | Measured Bearing Strength (MPa) | Simulated Predictions |
|---|---|---|---|---|---|
| 1 | 12 | 83.3% | 209-215 | 243-258 | Hardness: 202-209 HB Strength: 235-245 MPa |
| 2 | 40 | 90.0% | 197-213 | 249-255 | |
| 3 | 36 | 88.8% | 203-212 | 238-259 | |
| 4 | 116 | 96.5% | 195-213 | 242-257 | |
| Cumulative | 204 | 93.1% | 195-215 | 238-259 | Excellent Correlation |
The close correlation between the virtual and physical results underscores the maturity and reliability of modern casting simulation for sand castings. The simulation accurately predicted not only the flow and thermal history but also the final as-cast microstructure and properties. This enabled a “right-first-time” approach to pattern design. The entire development journey—from initial process concept to the submission of validated sample castings—was completed in just four months. This represents a drastic reduction compared to traditional methods, where multiple pattern revisions could easily extend the timeline to twice that duration or more.
Conclusion and Broader Implications for Sand Castings
This project serves as a definitive case study on the transformative power of virtual process development in foundry engineering. By leveraging MAGMA simulation software, we were able to prototype, analyze, and optimize the manufacturing process for a highly complex engine block sand casting entirely in the digital realm. The ability to visualize metal flow, predict solidification patterns, and forecast mechanical properties before tooling commitment fundamentally de-risks the development process.
The benefits extend far beyond a single project. The knowledge gained is systematic and reusable. The simulation models themselves become digital assets that can be consulted for future troubleshooting or product derivates. For the broader industry producing intricate sand castings, the implications are profound:
- Accelerated Innovation: Faster development cycles enable more rapid response to market demands and technological changes, such as the shift towards lighter, more powerful engines.
- Cost Efficiency: Dramatic reductions in scrap, tooling rework, and trial production costs directly improve competitiveness.
- Quality by Design: Potential defects are identified and eliminated at the design stage, leading to inherently more robust processes and higher-integrity sand castings.
- Sustainability: Minimizing trial pours and scrap directly reduces energy consumption, raw material use, and waste, contributing to more sustainable manufacturing practices.
In conclusion, the virtual development of sand castings, as exemplified by this engine block project, is no longer an optional luxury but a core competency for foundries aiming for leadership in quality, efficiency, and innovation. It represents a perfect synergy of foundational metallurgical science, advanced computational physics, and practical engineering, ensuring that the ancient art of casting continues to meet the extreme demands of modern industry.