
As a practitioner in the casting industry, I have witnessed firsthand the transformative impact of numerical simulation on modern manufacturing. Casting, fundamentally a process transitioning from solid to liquid and back to solid, is fraught with uncontrollable factors, particularly during mold filling and solidification. However, the advent of numerical simulation technology has revolutionized our approach, allowing us to predefine controllable parameters—such as mold sand properties, pouring temperature, and chemical composition in sand casting—and simulate fluid flow and solidification in software like ProCAST. This predictive capability enables proactive process optimization, shifting casting production from experience-based art to science-driven engineering. In this article, I will delve into the application of numerical simulation in sand casting and die casting, emphasizing its role in enhancing the quality and efficiency of sand casting products. I will incorporate tables and formulas to summarize key concepts, and all discussions are from my experiential viewpoint.
The core of numerical simulation lies in building mathematical models that replicate physical phenomena. For instance, the heat transfer during solidification can be described by the heat conduction equation:
$$ \rho c_p \frac{\partial T}{\partial t} = \nabla \cdot (k \nabla T) + Q $$
where \( \rho \) is density, \( c_p \) is specific heat capacity, \( T \) is temperature, \( t \) is time, \( k \) is thermal conductivity, and \( Q \) represents internal heat sources. This equation forms the basis for temperature field analysis in both sand casting and die casting simulations. By solving such equations numerically, we can predict defects like shrinkage porosity, cold shuts, and gas entrapment before actual production, thereby optimizing processes for sand casting products.
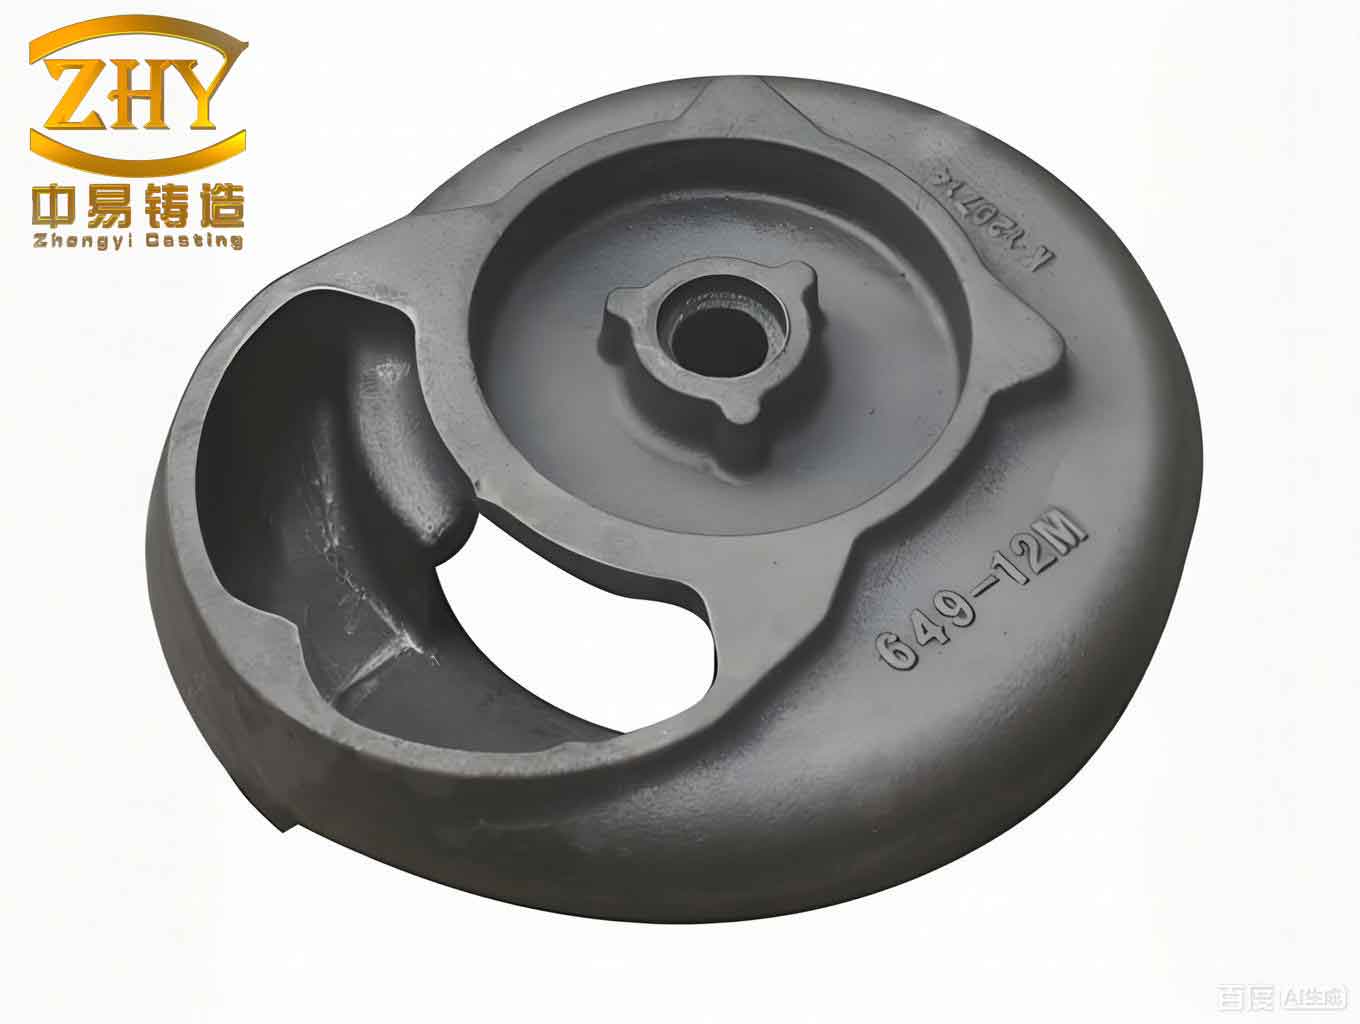
In sand casting, particularly for vertical flaskless molding, simulation begins with defining realistic production conditions. The table below summarizes typical input parameters for simulating sand casting products:
| Parameter Category | Specific Parameters | Typical Values/Ranges |
|---|---|---|
| Mold Sand Properties | Permeability, green strength, moisture content | Permeability: 80-120 AFS; Green strength: 10-20 N/cm² |
| Metal Melt Properties | Pouring temperature, chemical composition (e.g., %C, %Si) | Pouring temperature: 1350-1550°C for iron; Composition per alloy specs |
| Process Conditions | Gravity pouring velocity, mold filling time | Filling time: 2-10 s depending on part geometry |
Through simulation, we analyze four main aspects: (1) fluid flow simulation (mold filling), (2) solidification simulation, (3) microstructural simulation, and (4) defect analysis and prediction (e.g., shrinkage, sand erosion, misruns). For fluid flow, the Navier-Stokes equations govern the motion:
$$ \frac{\partial \mathbf{u}}{\partial t} + (\mathbf{u} \cdot \nabla) \mathbf{u} = -\frac{1}{\rho} \nabla p + \nu \nabla^2 \mathbf{u} + \mathbf{g} $$
where \( \mathbf{u} \) is velocity, \( p \) is pressure, \( \nu \) is kinematic viscosity, and \( \mathbf{g} \) is gravitational acceleration. In my work, I have observed that turbulence or vortex formation during filling, as indicated by simulations, can lead to gas entrapment and slag defects in sand casting products. By adjusting gating systems to ensure smooth filling, we mitigate these issues. Solidification simulations reveal temperature gradients, guiding the optimal placement of risers and chills to eliminate shrinkage defects. The solidification time \( t_s \) can be estimated using Chvorinov’s rule:
$$ t_s = C \left( \frac{V}{A} \right)^n $$
where \( V \) is volume, \( A \) is surface area, \( C \) is a mold constant, and \( n \) is an exponent (typically ~2). This helps in designing efficient feeding systems for sand casting products, maximizing yield and profitability.
Moving to low-pressure die casting, commonly used for wheel hubs, simulation addresses the dynamic control of mold temperature via air or water cooling. The process involves bottom-up filling and cyclic operations. A key aspect is simulating multiple cycles to assess stability. The table below outlines simulation parameters for low-pressure casting of wheel hubs:
| Simulation Phase | Parameters Considered | Impact on Sand Casting Products (Analogous) |
|---|---|---|
| Pre-processing | 3D meshing, inflow boundaries, initial temperature, thermocouple positions, pouring temperature, alloy composition | Similar parameters apply to sand casting products for consistency |
| Numerical Calculation | Mold closing (filling/solidification), mold opening (heat transfer in cavity), multiple cycles | Cyclic analysis relevant for high-volume sand casting products |
| Post-processing | Visualization of temperature fields, defect maps, velocity vectors | Used to optimize gating and cooling for sand casting products |
In low-pressure casting, the heat transfer coefficient \( h \) for water cooling is critical and can be modeled as:
$$ h = \frac{k_{water} \cdot \text{Nu}}{D} $$
where \( k_{water} \) is thermal conductivity of water, Nu is the Nusselt number, and \( D \) is characteristic diameter. By simulating these effects, we predict how temperature and filling behavior influence defects like shrinkage in wheel hubs—a principle extendable to sand casting products. For example, minor gas entrapment often occurs at metal flow junctions, and simulation helps redesign runners to minimize this. The integration of water controllers allows precise heat dissipation, reducing cycle time and defects, thereby enhancing productivity for sand casting products as well.
In high-pressure die casting, numerical simulation is vital due to the high cost and precision of molds. The process is cyclic, with mold temperature fluctuating periodically, leading to thermal stress and fatigue. The temperature variation \( \Delta T \) over a cycle can be expressed as:
$$ \Delta T = T_{max} – T_{min} = f(P, t_c, \alpha) $$
where \( P \) is injection pressure, \( t_c \) is cycle time, and \( \alpha \) is thermal diffusivity. Simulation predicts temperature distributions, optimizing process control to ensure quality. The table below compares simulation focuses across casting methods, highlighting relevance to sand casting products:
| Casting Method | Key Simulation Aspects | Benefits for Sand Casting Products (Cross-Applicability) |
|---|---|---|
| Sand Casting (Vertical Flaskless) | Flow turbulence, solidification fronts, defect prediction | Directly improves sand casting product quality via optimized designs |
| Low-Pressure Casting | Cyclic cooling, multi-cycle stability, bottom filling | Insights applicable to sand casting products with similar geometries |
| High-Pressure Die Casting | Thermal fatigue, rapid filling, mold temperature cycles | Methods adaptable for sand casting products in terms of defect analysis |
The numerical simulation process universally involves pre-processing, solving, and post-processing. For sand casting products, pre-processing includes generating a computational mesh from CAD models. The mesh quality is assessed using aspect ratio and skewness criteria. The governing equations for coupled flow and heat transfer are discretized using finite volume methods, and solved iteratively. For example, the energy equation during solidification accounts for latent heat release:
$$ \rho L \frac{\partial f_s}{\partial t} = \nabla \cdot (k \nabla T) $$
where \( L \) is latent heat and \( f_s \) is solid fraction. This allows accurate prediction of mushy zone formation in sand casting products. Post-processing tools visualize results, such as temperature contours at different times (e.g., 1.7 s and 7.2 s for flow, 35 s and 686 s for solidification), enabling engineers to adjust risers and chills. In my experience, this iterative optimization reduces trial-and-error, cutting development time and costs for sand casting products.
Moreover, microstructural simulation adds another layer of refinement. Using models like the Cellular Automaton (CA) or Phase Field method, we predict grain size and morphology in sand casting products. The grain growth velocity \( v \) can be described as:
$$ v = \mu \Delta G $$
where \( \mu \) is mobility and \( \Delta G \) is Gibbs free energy difference. This helps control mechanical properties, ensuring that sand casting products meet stringent specifications. Defect analysis algorithms quantify shrinkage porosity using criteria functions based on temperature and pressure thresholds. For instance, the Niyama criterion for shrinkage prediction is:
$$ G / \sqrt{\dot{T}} \leq C_{crit} $$
where \( G \) is temperature gradient, \( \dot{T} \) is cooling rate, and \( C_{crit} \) is a constant. Values below the threshold indicate potential shrinkage in sand casting products, guiding remedial actions.
The economic benefits of numerical simulation are profound. By virtual testing, we minimize mold rework and scrap, directly lowering costs for sand casting products. A comparative study shows that simulation can reduce development cycles by up to 50% and cut material waste by 30% for sand casting products. The integration of simulation with real-time process control, such as in Industry 4.0 frameworks, further enhances consistency. As computing power grows, high-fidelity simulations incorporating multiphysics phenomena—like fluid-structure interaction and stress analysis—become feasible, making previously uncontrollable factors manageable for sand casting products.
In conclusion, numerical simulation has become an indispensable tool in casting, from sand casting to die casting. It empowers us to predict and prevent defects, optimize designs, and reduce costs. For sand casting products, simulation offers a scientific basis for process decisions, improving yield and quality. The future promises even broader adoption, with advancements in AI-driven optimization and real-time simulation, ultimately making casting processes more predictable and efficient. Through continuous innovation, we can ensure that sand casting products meet evolving industrial demands while sustaining economic and environmental benefits.