
In the production of sand casting products, defects such as sand inclusions and gas holes are prevalent challenges that can compromise quality and yield. Traditional approaches often rely on empirical experience, leading to subjective interpretations and inconsistent solutions. To address this, I have leveraged Scanning Electron Microscopy (SEM) and Energy-Dispersive X-ray Spectroscopy (EDS) as definitive analytical tools for root-cause analysis. This article, from my firsthand perspective, details how SEM/EDS facilitates rapid identification and elimination of defects in green sand casting products, incorporating quantitative data through tables and formulas to underscore key principles. The insights herein aim to enhance the reliability and efficiency of manufacturing high-integrity sand casting products.
The integration of SEM/EDS into defect analysis represents a paradigm shift from guesswork to evidence-based problem-solving. In my collaboration with academic institutions, we have systematically examined defective sand casting products to uncover microstructural and compositional clues. For instance, in green sand casting, the interplay between sand properties, process parameters, and molten metal behavior dictates defect formation. By employing SEM/EDS, we can scrutinize defect surfaces at high magnifications and perform semi-quantitative elemental analysis, enabling precise diagnosis. This methodology is particularly crucial for sand casting products used in automotive, machinery, and other critical applications, where failure is not an option. Below, I elaborate on specific case studies involving sand inclusions and gas holes, emphasizing how data-driven adjustments can optimize the production of sand casting products.
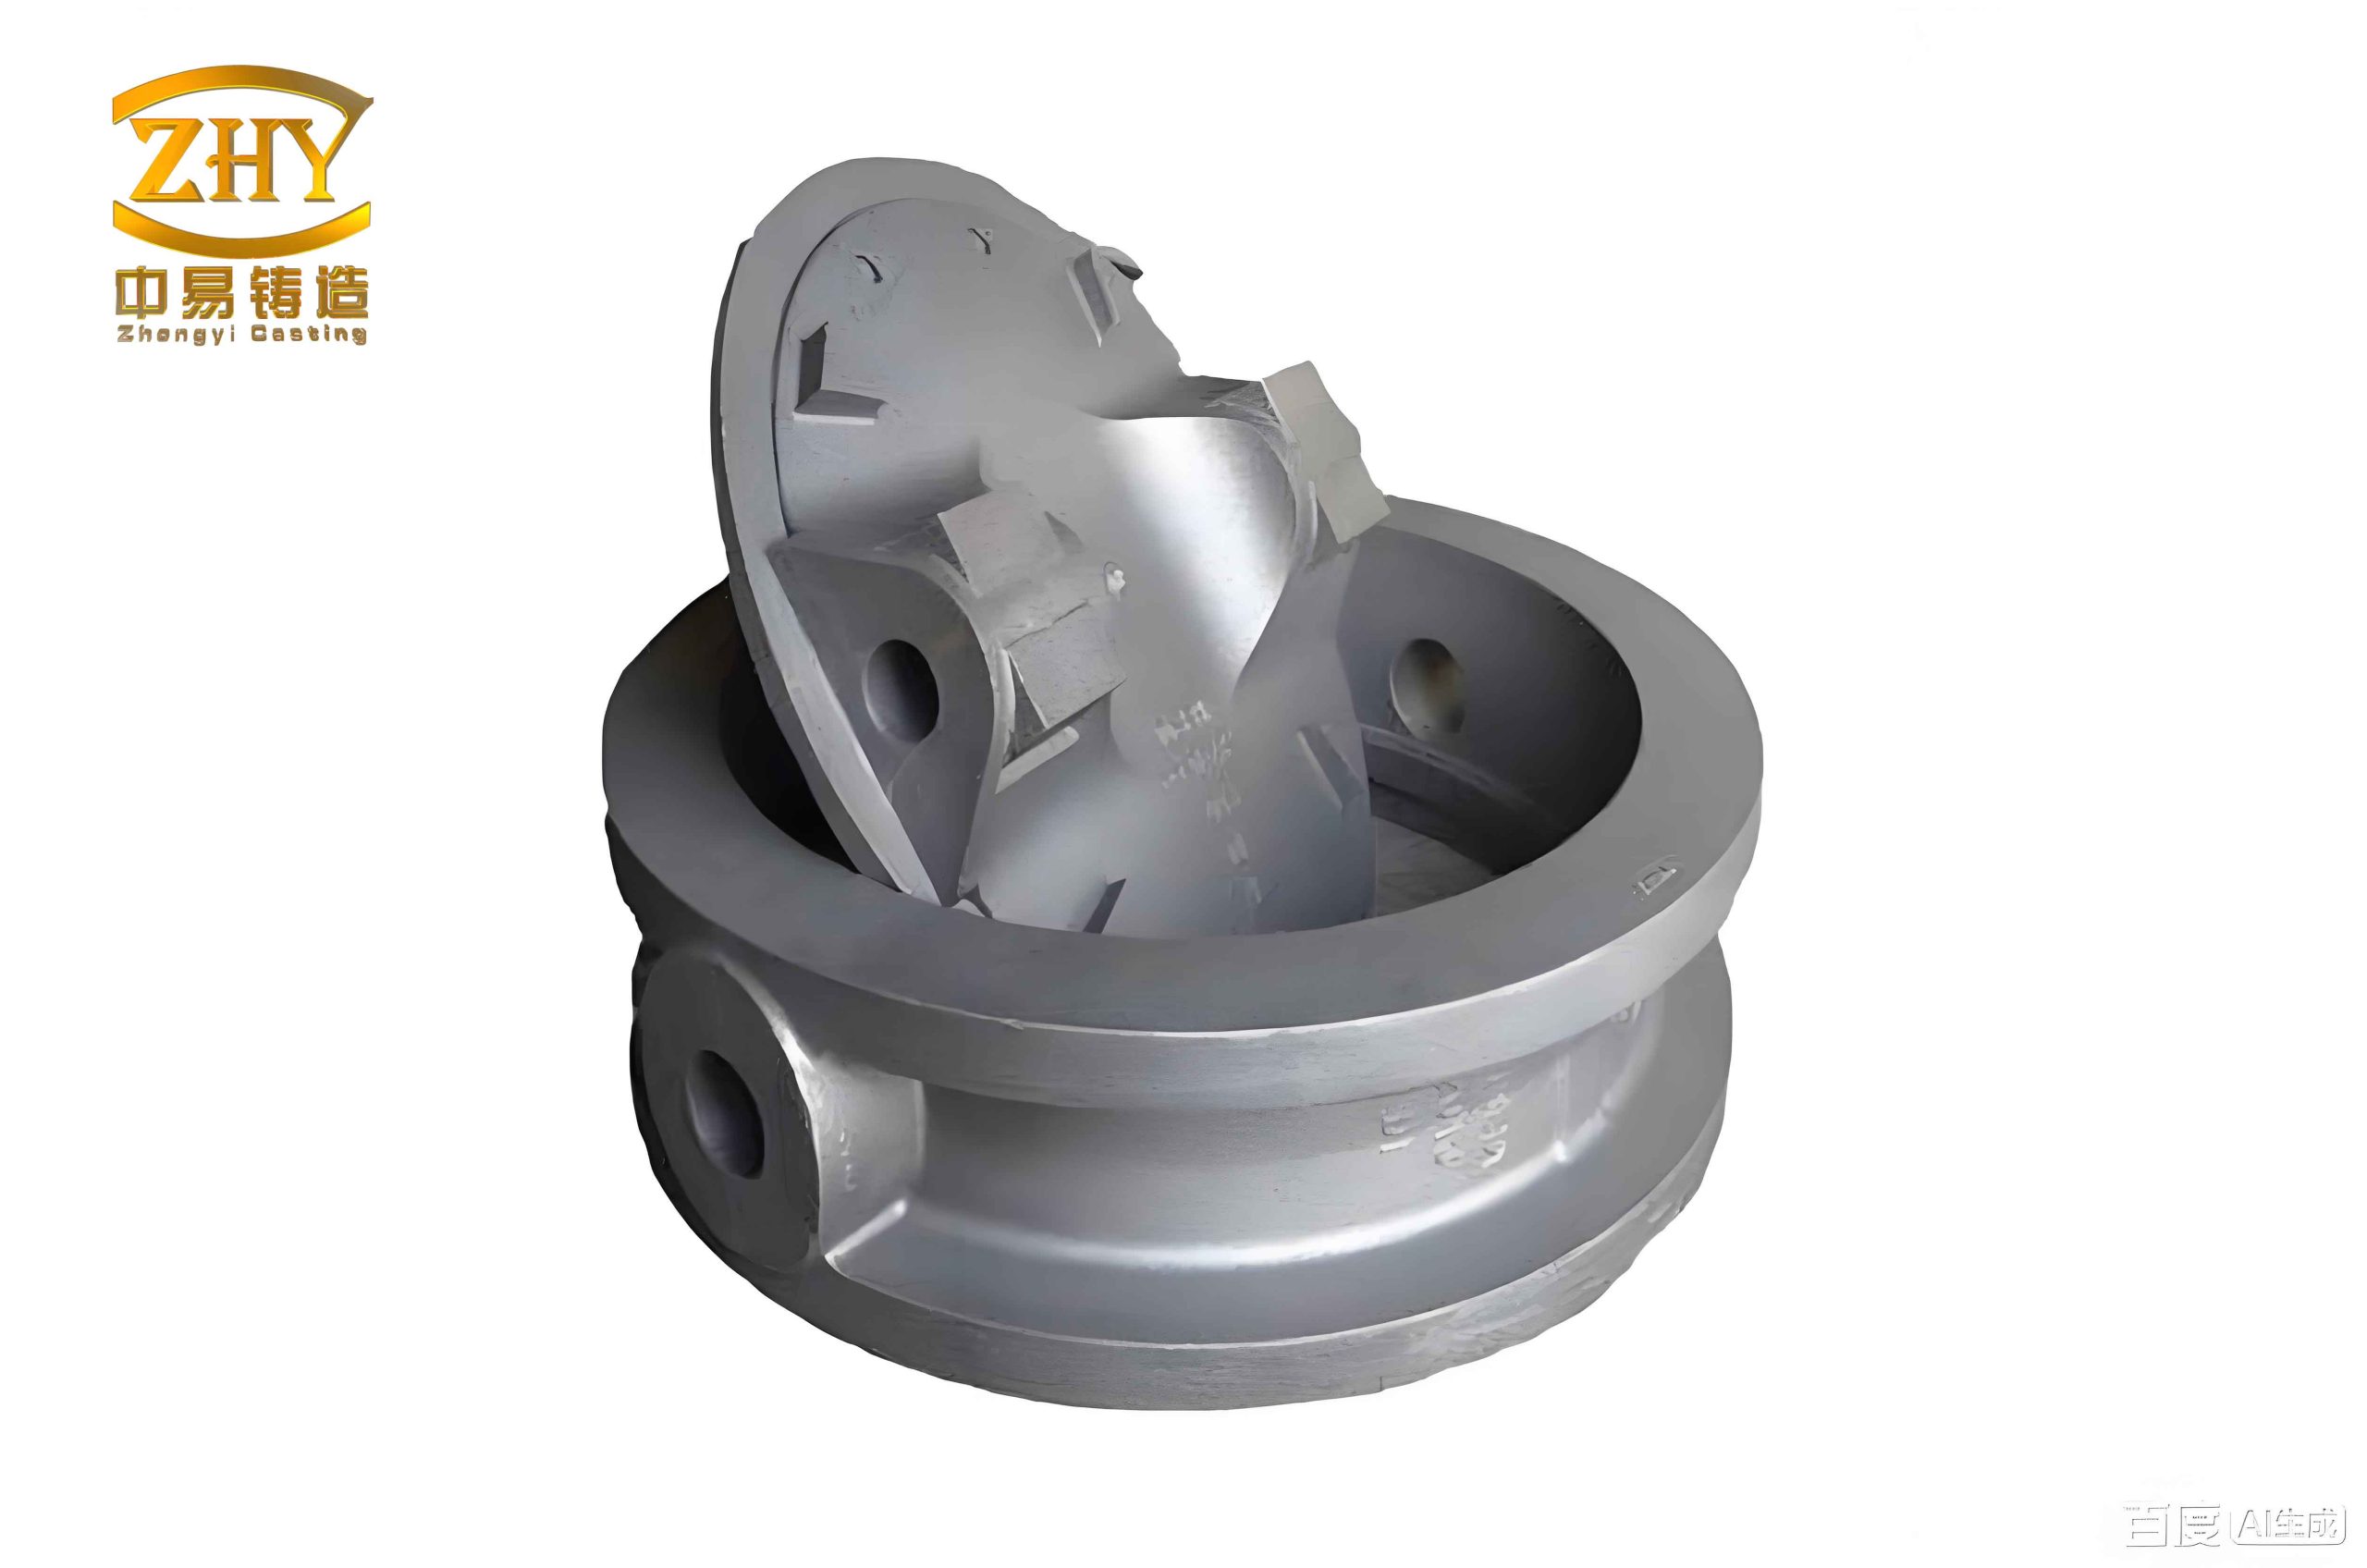
Sand inclusions, often manifested as surface holes or cavities, are a common flaw in sand casting products. In one instance, we encountered gray iron castings weighing approximately 15 kg, produced via an HWS molding line with cold-box cores. Initial suspicions varied between gas holes and sand inclusions, highlighting the need for objective analysis. We first assessed the green sand properties, as summarized in Table 1. The data revealed suboptimal parameters: effective clay content was merely 6.51%, and the ratio of compactibility to moisture was as low as 7.2. These factors contribute to poor sand cohesion and increased susceptibility to erosion, ultimately leading to defects in sand casting products.
| Property | Unit | Value |
|---|---|---|
| Moisture | % | 3.6 |
| Effective Clay | % | 6.51 |
| Clay Content | % | 12.15 |
| Loss on Ignition | % | 5.4 |
| Green Compression Strength | kPa | 208 |
| Hot Wet Tensile Strength | kPa | 2 |
| Compactibility | % | 26 |
| Permeability | – | 110 |
| Sample Weight | g | 148 |
| AFS Fineness Number | – | 57.81 |
Furthermore, the grain size distribution of the sand was analyzed, as shown in Table 2. An excessive accumulation on the 70-mesh sieve (over 40%) and disproportionate differences between adjacent sieves indicated poor flowability and packing density. This inhomogeneity exacerbates sand detachment during pouring, fostering defects in sand casting products. To quantify the ideal distribution, we often target a relationship where the percentage difference between consecutive sieves is 8–12%, which can be expressed as:
$$
\Delta P_i = \left| \frac{P_{i} – P_{i+1}}{P_{i}} \right| \times 100\% \approx 10\% \quad \text{(for optimal sand flow)}
$$
where \( P_i \) is the percentage retained on sieve \( i \). Deviations from this range, as observed, correlate with increased defect rates in sand casting products.
| Sieve Mesh | Percentage Retained (%) |
|---|---|
| 6 | 0.00 |
| 20 | 0.02 |
| 40 | 0.02 |
| 70 | 41.23 |
| 140 | 19.67 |
| 270 | 4.54 |
| Pan | 1.47 |
To conclusively diagnose the defect, SEM/EDS analysis was performed on samples from the flawed sand casting products. SEM images revealed distinct sand grain morphologies within the holes, confirming sand inclusions. EDS spectra, summarized in Table 3, showed high peaks for silicon (Si) and oxygen (O), along with aluminum (Al), consistent with silica (SiO₂) and alumina (Al₂O₃) from sand grains. This elemental fingerprint eliminated ambiguity and directed corrective actions toward sand system improvements.
| Element | Weight Percentage (%) | Possible Compound |
|---|---|---|
| O | ~45-50 | Oxides (SiO₂, Al₂O₃) |
| Si | ~30-35 | SiO₂ |
| Al | ~10-15 | Al₂O₃ |
| Fe | ~5-10 | Metallic Iron |
| Others (Mn, etc.) | <5 | Trace Elements |
Based on this analysis, we implemented corrective measures to enhance the quality of sand casting products. First, bentonite addition was increased to raise effective clay content to 7.5–8.0%, improving sand bonding. The compactibility-to-moisture ratio was adjusted to around 10, optimizing water distribution. This ratio can be modeled as:
$$
R_{cm} = \frac{C}{M}
$$
where \( C \) is compactibility (%) and \( M \) is moisture (%). Targeting \( R_{cm} \approx 10 \) ensures better sand workability. Second, sand grain distribution was modified by adding new sand to reduce the 70-mesh retention below 40% and achieve adjacent sieve differences of 8–12%. These changes eliminated sand inclusions, underscoring how SEM/EDS data directly informs process optimization for sand casting products.
Gas holes, another pervasive defect in sand casting products, often arise from volatile emissions or slag entrapment. In a separate case involving an ACE molding line producing 120 kg castings, holes appeared on upper surfaces and near ingates. Initial debates centered on whether these were sand inclusions or gas holes. We analyzed the green sand properties over time, as detailed in Table 4. Key trends included rising AFS fineness, decreasing permeability, and increasing loss on ignition, all conducive to gas generation. For sand casting products, such parameters must be tightly controlled to prevent defects.
| Property | Unit | Period 1 | Period 2 | Period 3 | Period 4 |
|---|---|---|---|---|---|
| Moisture | % | 2.76 | 2.77 | 2.78 | 2.8 |
| Effective Clay | % | 7.30 | 6.93 | 7.21 | 7.86 |
| Clay Content | % | 8.90 | 8.92 | 10.0 | 10.05 |
| Loss on Ignition | % | 3.66 | 3.50 | 4.52 | 4.69 |
| Green Compression Strength | kPa | 215 | 205 | 200 | 206 |
| Hot Wet Tensile Strength | kPa | 3.2 | 3.3 | 3.5 | 3.5 |
| Compactibility | % | 31.0 | 31.5 | 31.0 | 30.0 |
| Permeability | – | 93 | 95 | 85 | 84 |
| AFS Fineness Number | – | 56.71 | 56.69 | 58.74 | 59.64 |
SEM/EDS analysis of defect samples from these sand casting products provided clarity. For one hole, SEM showed minimal inclusions, and EDS detected primarily carbon (C) and oxygen (O), indicative of gas pores from combustible materials. In other holes, SEM revealed slag-like particles, and EDS identified elements like silicon, iron, and manganese, pointing to slag-related gas holes. The elemental composition, summarized in Table 5, aligns with oxidation products from molten metal reactions. Such defects in sand casting products are often driven by chemical interactions during pouring.
| Defect Type | Major Elements (Weight %) | Inferred Compounds |
|---|---|---|
| Pure Gas Hole | C: ~20-25, O: ~30-35, Fe: ~5-10 | CO/CO₂ from carbonaceous materials |
| Slag Gas Hole | O: ~30-40, Si: ~25-30, Fe: ~10-15, Mn: ~3-5 | SiO₂, FeO, MnO from slag oxidation |
The formation of slag gas holes in sand casting products can be described through oxidation reactions. For instance, when manganese content exceeds 0.75% in iron and pouring temperature falls below 1400°C, reactions such as:
$$
\text{Mn} + \text{O} \rightarrow \text{MnO}
$$
$$
\text{Fe} + \text{O} \rightarrow \text{FeO}
$$
$$
\text{Si} + 2\text{O} \rightarrow \text{SiO}_2
$$
$$
\text{Al} + 3\text{O} \rightarrow \text{Al}_2\text{O}_3
$$
generate slag compounds. These can then react with carbon to produce gas:
$$
\text{Slag} + \text{C} \rightarrow \text{CO} \quad \text{(gas)}
$$
This gas entrapment leads to porosity in sand casting products. To mitigate this, we adjusted several factors. First, sand mulling parameters were optimized to reduce free moisture and stabilize the compactibility-to-moisture ratio. In practice, we aim for a linear relationship during mulling, expressed as:
$$
\frac{C_{\text{start}}}{M_{\text{start}}} \approx \frac{C_{\text{end}}}{M_{\text{end}}} \approx 10
$$
where subscripts denote start and end points in the mulling cycle. Second, metal treatment was refined: reducing inoculant and spheroidizer additions, controlling treatment temperature, and minimizing iron oxidation. Third, core sand moisture was kept below 0.3% to limit volatile release. These steps significantly reduced gas holes, enhancing the consistency of sand casting products.
Beyond specific defects, SEM/EDS offers broader insights for sand casting products. For example, we can model defect probability based on sand parameters. A simplified empirical formula for sand inclusion risk (\(R_{si}\)) in green sand casting products might be:
$$
R_{si} = k_1 \cdot \left( \frac{1}{\text{Effective Clay}} \right) + k_2 \cdot \left( \frac{\text{LOI}}{\text{Moisture}} \right) + k_3 \cdot \Delta P
$$
where \(k_1\), \(k_2\), \(k_3\) are constants, LOI is loss on ignition, and \(\Delta P\) represents grain size deviation. Similarly, gas hole risk (\(R_{gh}\)) can be correlated with:
$$
R_{gh} = \alpha \cdot \text{LOI} + \beta \cdot \left( \frac{1}{\text{Permeability}} \right) + \gamma \cdot [\text{Mn}]
$$
where \(\alpha\), \(\beta\), \(\gamma\) are coefficients, and [Mn] is manganese content in the metal. These models, though approximate, guide proactive control for sand casting products.
In practice, implementing SEM/EDS analysis requires a systematic approach. For every batch of sand casting products, we recommend periodic sand testing coupled with defect sampling. Table 6 outlines a monitoring framework. This proactive stance minimizes rework and scrap, ensuring that sand casting products meet stringent specifications.
| Parameter | Frequency | Target Range | Corrective Action if Off-Target |
|---|---|---|---|
| Effective Clay | Daily | 7.0–8.5% | Adjust bentonite addition |
| Compactibility/Moisture Ratio | Per Shift | 9.5–10.5 | Optimize mulling time/water |
| Grain Size Distribution | Weekly | ΔP between sieves: 8–12% | Blend with new sand |
| Loss on Ignition | Daily | <4.0% for gray iron | Reduce carbonaceous additives |
| Permeability | Per Shift | 80–120 | Adjust sand fineness/clay |
The economic impact of SEM/EDS analysis is profound for producers of sand casting products. By reducing defect rates from, say, 5% to below 1%, manufacturers can save substantially on material and energy costs. Consider a scenario where annual production is 10,000 tons of sand casting products. A 4% reduction in scrap translates to 400 fewer tons wasted, with savings approximating:
$$
\text{Savings} = (D_{\text{initial}} – D_{\text{final}}) \times P \times C_{\text{unit}}
$$
where \(D\) is defect rate, \(P\) is production volume, and \(C_{\text{unit}}\) is cost per unit. For many foundries, this justifies investment in SEM/EDS equipment or services.
Looking ahead, the role of SEM/EDS in advancing sand casting products is set to grow. With trends toward lightweighting and high-performance components, defect tolerance shrinks. We are exploring automated SEM/EDS systems that integrate with real-time sand control data, enabling predictive analytics. For instance, by correlating EDS signatures of early defects with sand parameters, we can develop algorithms that alert operators before mass production of sand casting products is affected. This fusion of microscopy and Industry 4.0 promises a new era of zero-defect sand casting products.
In conclusion, SEM/EDS analysis is an indispensable tool for diagnosing and eliminating defects in green sand casting products. Through detailed case studies on sand inclusions and gas holes, I have demonstrated how microstructural and elemental data inform precise corrective actions. By optimizing sand properties, mulling processes, and metal treatment, manufacturers can consistently produce high-quality sand casting products. The integration of quantitative models and monitoring protocols further strengthens this approach. As the demand for reliable sand casting products escalates, embracing SEM/EDS will be key to competitiveness and sustainability in the foundry industry.