
In the context of global industrialization, the emission of greenhouse gases, primarily carbon dioxide, has escalated significantly. As a major contributor, the manufacturing sector, particularly traditional industries like sand casting, faces urgent demands for carbon reduction. Sand casting products form the backbone of many industrial applications, yet their production processes are resource-intensive and environmentally impactful. This article addresses the critical need for quantifying carbon emissions at the individual casting level in sand casting processes. We propose a comprehensive carbon emission calculation model that integrates the input-output method with process analysis, grounded in life cycle assessment theory. By analyzing material consumption, energy usage, and waste generation across various production stages, our model enables precise carbon emission allocation for individual sand casting products in batch production. This approach provides a theoretical foundation for emission reduction strategies, supporting the transition toward greener manufacturing practices.
The significance of this research lies in its focus on single sand casting products, a gap in existing studies that often evaluate overall process emissions. Through detailed modeling and practical application, we aim to empower enterprises with actionable insights for carbon footprint management. The methodology not only quantifies emissions but also identifies key reduction levers, aligning with global sustainability goals such as carbon peak and neutrality initiatives. In the following sections, we delve into the theoretical framework, model development, and a case study involving wind turbine components, demonstrating the applicability and value of our approach for sand casting products.
The life cycle assessment theory serves as the cornerstone of our carbon emission quantification for sand casting products. This theory evaluates environmental impacts across all stages of a product’s life, from raw material extraction to end-of-life disposal. For sand casting products, we narrow the focus to the casting process itself, which encompasses molding, melting, recycling, and machining stages. By applying a hybrid life cycle approach, we combine top-down input-output analysis for broad emission factors with bottom-up process analysis for granular data collection. This integration ensures both accuracy and practicality in calculating carbon footprints for sand casting products.
Carbon emissions in manufacturing are typically categorized into direct and indirect emissions. Direct emissions arise from on-site processes, while indirect emissions stem from material production and energy consumption. For sand casting products, we further break down indirect emissions into material-related, energy-related, and waste-related carbon emissions. This tripartite classification allows for a systematic evaluation of each production stage’s contribution. The system boundary for sand casting products is defined to include all inputs and outputs within the casting process, excluding upstream raw material extraction and downstream use phases. This boundary ensures a manageable scope while capturing the core emissions sources relevant to sand casting products.
The carbon sources in sand casting processes for sand casting products are multifaceted. Material carbon emissions originate from the consumption of resources such as resin sand, steel scrap, and pig iron. Energy carbon emissions result from electricity usage by equipment like mixers, furnaces, and cranes. Waste carbon emissions arise from the treatment of by-products like dust, slag, and exhaust gases. Each stage—molding, melting, recycling, and machining—contributes differently to these categories. For instance, in molding, material emissions dominate due to resin sand loss, whereas in melting, energy emissions from furnace operation are significant. Understanding these dynamics is crucial for developing targeted reduction strategies for sand casting products.
To quantify carbon emissions for sand casting products, we establish a detailed calculation model. The model leverages mathematical formulas to allocate emissions based on production parameters. Key variables include casting weight, sand-to-metal ratio, recycling rates, and equipment efficiencies. We present these formulas using LaTeX notation for clarity and precision. The model’s parameters are summarized in tables to facilitate application. By incorporating both variable and fixed emissions, our approach captures the nuances of batch production, enabling accurate per-unit carbon footprint assessment for sand casting products.
The carbon emission calculation for sand casting products begins with material carbon emissions. These are derived from the consumption of materials during production. Variable material emissions depend on process-specific inputs, while fixed material emissions are allocated based on output quantities. For the molding stage, variable emissions from resin sand are calculated using the sand-to-metal ratio and recycling rate. The formula is:
$$R^1 = \frac{\rho_b (V_x – V_d)}{M_d}$$
where \( R^1 \) is the sand-to-metal ratio, \( \rho_b \) is the density of resin sand, \( V_x \) is the mold box volume, \( V_d \) is the casting volume, and \( M_d \) is the weight of the sand casting product. The variable carbon emission \( C^1_{VR,d} \) for product \( d \) in molding is:
$$C^1_{VR,d} = M_d R^1 (1-\eta) f_b$$
Here, \( \eta \) is the resin sand recycling rate, and \( f_b \) is the carbon emission factor for resin sand. Fixed material emissions \( C^1_{ST,d} \) are calculated as:
$$C^1_{ST,d} = \sum_{c=1}^{c_0} \frac{I^1_c}{O_d} f_c$$
where \( I^1_c \) is the consumption of fixed material \( c \) over a period, \( O_d \) is the output of sand casting products, and \( f_c \) is the emission factor. The total material carbon emission \( CM^1_d \) for molding is:
$$CM^1_d = M_d R^1 (1-\eta) f_b + \sum_{c=1}^{c_0} \frac{I^1_c}{O_d} f_c$$
For the melting stage, material emissions come from molten metal ingredients. The emission \( CM^2_d \) is:
$$CM^2_d = M_d (1 + M_{IR}) \sum_{g=1}^{g_0} R^2_g f_g$$
where \( M_{IR} \) is the ratio of excess molten metal to casting weight, \( R^2_g \) is the proportion of ingredient \( g \) in the molten metal, and \( f_g \) is its emission factor. Recycling and machining stages have fixed material emissions:
$$CM^3_d = \sum_{c=1}^{c_0} \frac{I^3_c}{O_d} f_c$$
$$CM^4_d = \sum_{c=1}^{c_0} \frac{I^4_c}{O_d} f_c$$
The overall material carbon emission \( CM_d \) for a sand casting product is:
$$CM_d = M_d R^1 (1-\eta) f_b + M_d (1 + M_{IR}) \sum_{g=1}^{g_0} R^2_g f_g + \sum_{a=1}^{4} \sum_{c=1}^{c_0} \frac{I^a_c}{O_d} f_c$$
Energy carbon emissions for sand casting products are computed based on electricity consumption by equipment. In molding, energy emissions \( CE^1_d \) from sand mixers and cranes are:
$$CE^1_d = \left( \sum_{l=1}^{l_0} \frac{p_l M_d R^1}{v_l} + \sum_{m_1=1}^{m_1_0} \frac{p_{m_1} s_{m_1}}{v_{m_1}} \right) f_e$$
where \( p_l \) and \( v_l \) are the power and efficiency of sand mixers, \( p_{m_1} \), \( s_{m_1} \), and \( v_{m_1} \) are the power, distance, and speed of cranes, and \( f_e \) is the electricity emission factor. For melting, energy emissions \( CE^2_d \) include furnace and crane usage:
$$CE^2_d = M_d (1 + M_{IR}) E_n f_e + \sum_{m_2=1}^{m_2_0} \frac{p_{m_2} s_{m_2}}{v_{m_2}} f_e$$
where \( E_n \) is the electricity consumption per ton of molten metal. Recycling stage emissions \( CE^3_d \) involve sand processing lines and cranes:
$$CE^3_d = M_d R^1 E_o f_e + \sum_{m_3=1}^{m_3_0} \frac{p_{m_3} s_{m_3}}{v_{m_3}} f_e$$
with \( E_o \) as electricity per ton of resin sand processed. Machining emissions \( CE^4_d \) from shot blasting and cranes are:
$$CE^4_d = \left( \sum_{u=1}^{u_0} p_u t_u + \sum_{m_4=1}^{m_4_0} \frac{p_{m_4} s_{m_4}}{v_{m_4}} \right) f_e$$
The total energy carbon emission \( CE_d \) for sand casting products is:
$$CE_d = \left( \sum_{l=1}^{l_0} \frac{p_l M_d R^1}{v_l} + \sum_{m_1=1}^{m_1_0} \frac{p_{m_1} s_{m_1}}{v_{m_1}} \right) f_e + M_d (1 + M_{IR}) E_n f_e + M_d R^1 E_o f_e + \left( \sum_{u=1}^{u_0} p_u t_u + \sum_{m_4=1}^{m_4_0} \frac{p_{m_4} s_{m_4}}{v_{m_4}} \right) f_e$$
Waste carbon emissions for sand casting products arise from treating by-products like dust and slag. In molding, emissions \( CU^1_d \) from dust treatment are:
$$CU^1_d = M_d \frac{M^1_{U1} p_{w1}}{v_{w1}} f_e$$
where \( M^1_{U1} \) is the waste generated per ton of casting, \( p_{w1} \) is the treatment device power, and \( v_{w1} \) is its processing speed. For melting, emissions \( CU^2_d \) include dust and slag treatment:
$$CU^2_d = M_d \frac{M^2_{U1} p_{w2}}{v_{w2}} f_e + M_d \frac{M^2_{U2} p_{i2} s_{i2}}{M_{i2} v_{i2}} f_e$$
where \( M^2_{U2} \) is solid waste per ton, and \( p_{i2} \), \( s_{i2} \), \( v_{i2} \), and \( M_{i2} \) relate to waste transport equipment. Recycling and machining emissions \( CU^3_d \) and \( CU^4_d \) are similar:
$$CU^3_d = M_d \frac{M^3_{U1} p_{w3}}{v_{w3}} f_e$$
$$CU^4_d = M_d \frac{M^4_{U1} p_{w4}}{v_{w4}} f_e$$
The total waste carbon emission \( CU_d \) for sand casting products is:
$$CU_d = M_d \left( \frac{M^1_{U1} p_{w1}}{v_{w1}} + \frac{M^2_{U1} p_{w2}}{v_{w2}} + \frac{M^3_{U1} p_{w3}}{v_{w3}} + \frac{M^4_{U1} p_{w4}}{v_{w4}} \right) f_e + M_d \frac{M^2_{U2} p_{i2} s_{i2}}{M_{i2} v_{i2}} f_e$$
The overall carbon emission \( C_d \) for a sand casting product combines all categories:
$$C_d = CM_d + CE_d + CU_d$$
This model’s parameters are essential for application. We summarize them in tables to aid users in calculating carbon emissions for sand casting products.
| Parameter | Meaning | Unit |
|---|---|---|
| \( V_x \) | Mold box volume | mm³ |
| \( V_d \) | Casting volume | mm³ |
| \( \rho_b \) | Resin sand density | g/cm³ |
| \( M_d \) | Weight of sand casting product | kg |
| \( R^1 \) | Sand-to-metal ratio | dimensionless |
| \( \eta \) | Resin sand recycling rate | dimensionless |
| \( I^a_c \) | Consumption of fixed material \( c \) in stage \( a \) | kg |
| \( O_d \) | Output of sand casting products | kg |
| \( M_{IR} \) | Ratio of excess molten metal to casting weight | dimensionless |
| \( R^2_g \) | Proportion of ingredient \( g \) in molten metal | % |
| \( p_l \) | Power of sand mixer \( l \) | kW |
| \( v_l \) | Efficiency of sand mixer \( l \) | kg/s |
| \( E_n \) | Electricity per ton of molten metal | kWh/t |
| \( E_o \) | Electricity per ton of resin sand processed | kWh/t |
| \( p_u \) | Power of shot blasting machine \( u \) | kW |
| \( t_u \) | Operation time of shot blasting machine | min |
| \( p_{ma} \) | Power of crane in stage \( a \) | kW |
| \( s_{ma} \) | Transport distance of crane in stage \( a \) | m |
| \( v_{ma} \) | Speed of crane in stage \( a \) | m/min |
| \( p_{i2} \) | Power of waste transport equipment | kW |
| \( s_{i2} \) | Transport distance for waste | m |
| \( v_{i2} \) | Speed of waste transport | m/min |
| \( M_{i2} \) | Load capacity of waste transport equipment | kg |
| \( M^2_{U2} \) | Solid waste per ton of casting in melting | kg/t |
| \( p_{wa} \) | Power of waste treatment device in stage \( a \) | kW |
| \( M^a_{U1} \) | Gaseous waste per ton of casting in stage \( a \) | kg/t |
| \( v_{wa} \) | Processing speed of waste treatment device | kg/h |
Carbon emission factors for materials and energy are critical inputs for sand casting products. Based on literature and industry data, we compile a table of typical factors.
| No. | Material/Energy | Carbon Emission Factor | Unit |
|---|---|---|---|
| 1 | Resin sand | 0.02543 | kg CO₂/kg |
| 2 | Refractory coating | 6.0232 | kg CO₂/kg |
| 3 | Methanol | 2.5 | kg CO₂/kg |
| 4 | Steel scrap | 8.2 | kg CO₂/kg |
| 5 | Pig iron | 2.13 | kg CO₂/kg |
| 6 | Return material | 2.67 | kg CO₂/kg |
| 7 | Carbon additive | 4.2 | kg CO₂/kg |
| 8 | Silicon carbide | 14.68 | kg CO₂/kg |
| 9 | Ferrosilicon | 2.3 | kg CO₂/kg |
| 10 | Electricity | 0.93 | kg CO₂/kWh |
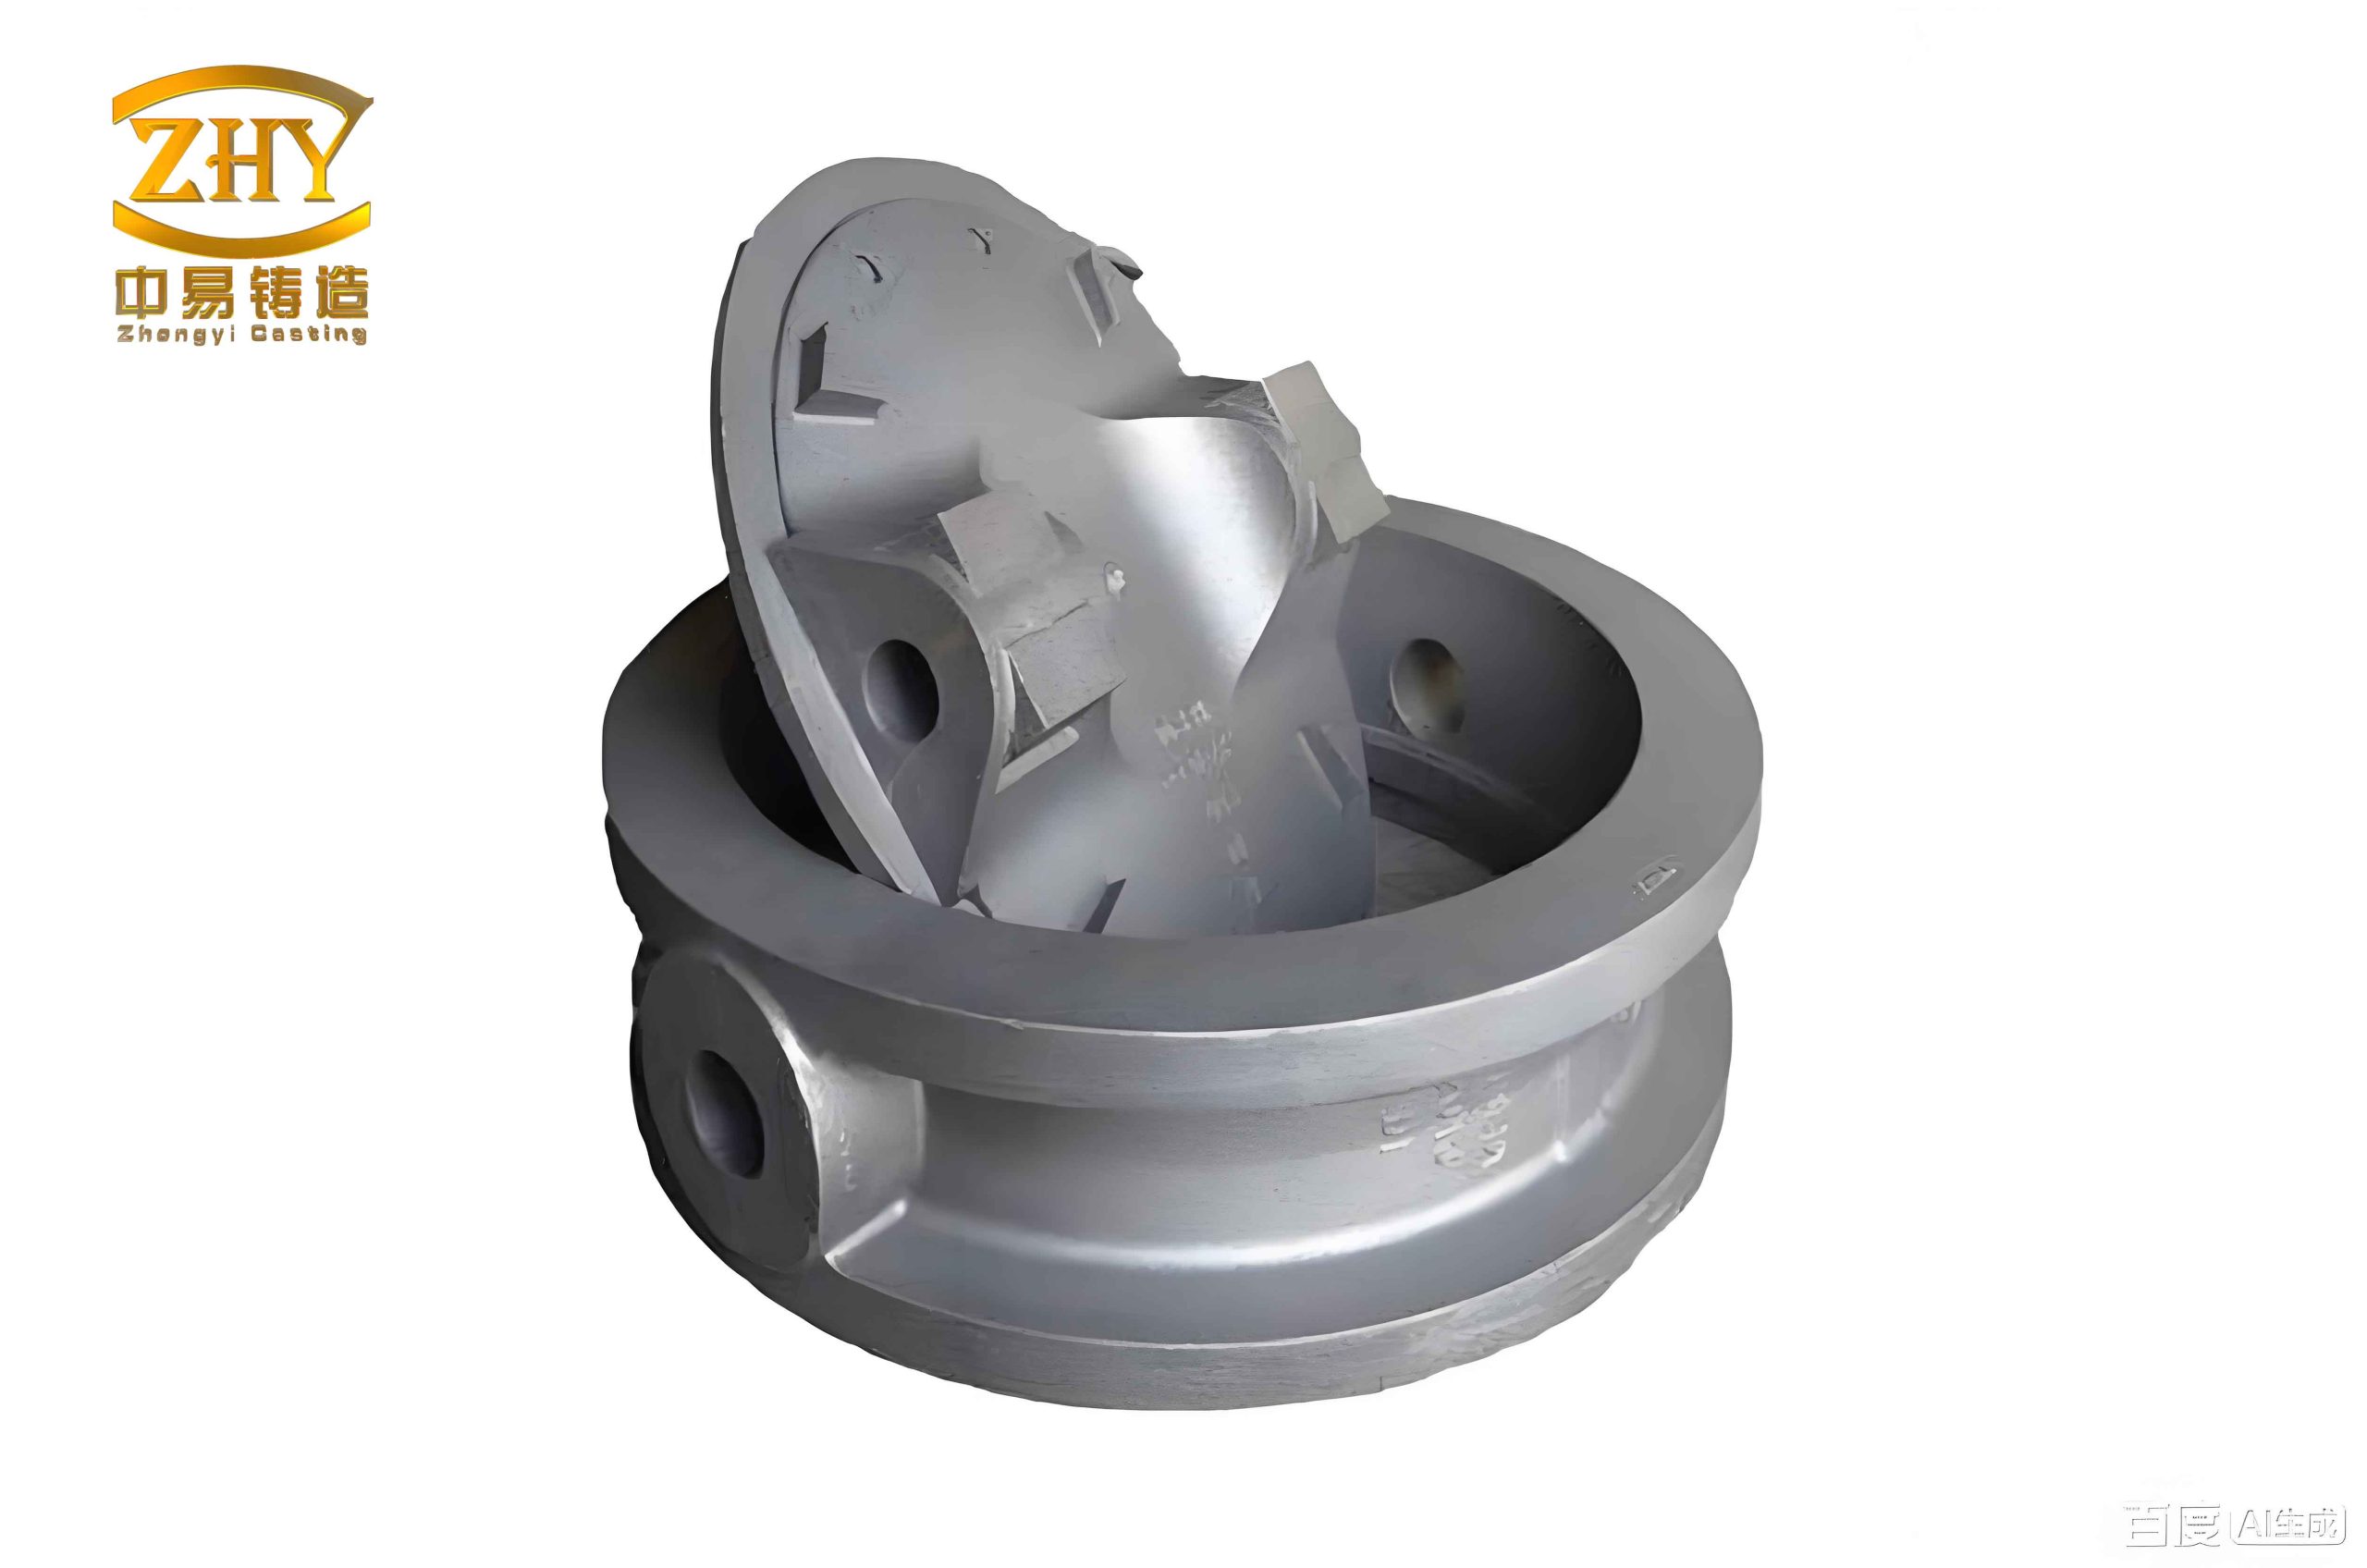
To validate our model, we apply it to a real-world case involving sand casting products: a locking disk component for wind turbines. This sand casting product is made of ductile iron QT500-14, with a weight of 6,932 kg. Production parameters include a sand-to-metal ratio of 8.25, resin sand recycling rate of 93%, and excess molten metal ratio of 0.1. The molten metal composition is as follows.
| Ingredient | Proportion (%) |
|---|---|
| Steel scrap | 58.19 |
| Pig iron | 24.69 |
| Return material | 14.26 |
| Carbon additive | 2.20 |
| Silicon carbide | 0.49 |
| Ferrosilicon | 0.17 |
Material balance data from the enterprise over a period show fixed material consumption, such as 94.07 tons of refractory coating and 141.11 tons of methanol for an output of 60,000 tons of sand casting products. Waste generation per ton of casting is estimated from industry standards.
| Waste Type | Stage | Amount per Ton (kg) |
|---|---|---|
| Dust | Molding | 0.586 |
| Dust | Melting | 0.500 |
| Dust | Recycling | 1.050 |
| Dust | Machining | 0.011 |
| Slag | Melting | 0.054 |
Equipment parameters include crane power of 20.5 kW, speed of 16 m/min, and distances of 0 m (molding), 70 m (melting), 40 m (recycling), and 110 m (machining). Sand mixer power is 11.5 kW with an efficiency of 6.2855 kg/s. Furnace electricity consumption is 500 kWh per ton of molten metal, and sand processing line consumption is 0.0119 kWh per ton of resin sand. Shot blasting machine power is 80 kW with an operation time of 20 minutes per sand casting product. Waste treatment device power is 7.5 kW with a processing speed of 14.2515 kg/h. For slag transport, equipment has a power of 5 kW, distance of 126.25 m, speed of 16 m/min, and load capacity of 500 kg.
Using these inputs, we calculate the carbon emissions for the locking disk sand casting product. Material carbon emissions \( CM_d \) are computed as:
$$CM_d = 6932 \times 8.25 \times (1 – 0.93) \times 0.02543 + \frac{94070}{60000} \times 6.0232 + \frac{141110}{60000} \times 2.5 + 6932 \times (1 + 0.1) \times (0.5819 \times 8.2 + 0.2469 \times 2.13 + 0.1426 \times 2.67 + 0.022 \times 4.2 + 0.0049 \times 14.68 + 0.0017 \times 2.3) + \frac{0.129}{60000} \times 8.2$$
This yields \( CM_d = 44,791.79 \) kg CO₂. Energy carbon emissions \( CE_d \) are:
$$CE_d = \left( \frac{11.5 \times 6932 \times 8.25}{6.2855} + \frac{20.5 \times 0}{16} \right) \times 0.93 + 6932 \times (1 + 0.1) \times 500 \times 0.93 + 6932 \times 8.25 \times 0.0119 \times 0.93 + \left( 80 \times 20 + \frac{20.5 \times 110}{16} \right) \times 0.93$$
Resulting in \( CE_d = 4,234.82 \) kg CO₂. Waste carbon emissions \( CU_d \) are:
$$CU_d = 6932 \times \left( \frac{0.586 \times 7.5}{14.2515} + \frac{0.500 \times 7.5}{14.2515} + \frac{1.050 \times 7.5}{14.2515} + \frac{0.011 \times 7.5}{14.2515} \right) \times 0.93 + 6932 \times \frac{0.054 \times 5 \times 126.25}{500 \times 16} \times 0.93$$
Which gives \( CU_d = 14.552 \) kg CO₂. The total carbon emission \( C_d \) for this sand casting product is:
$$C_d = 44,791.79 + 4,234.82 + 14.552 = 49,041.16 \text{ kg CO}_2$$
A detailed breakdown of emissions by category and stage is presented in the following table.
| Category | Material/Energy | Consumption | Unit | CO₂ Emission (kg) | Percentage (%) | Stage |
|---|---|---|---|---|---|---|
| Material | Resin sand | 4,001.13 | kg | 101.75 | 0.21 | Molding |
| Material | Refractory coating | 10.87 | kg | 65.46 | 0.13 | Molding |
| Material | Methanol | 16.3 | kg | 40.76 | 0.08 | Molding |
| Material | Steel scrap | 4,437.1 | kg | 36,384.25 | 74.19 | Melting |
| Material | Pig iron | 1,882.66 | kg | 4,010.07 | 8.18 | Melting |
| Material | Return material | 1,087.35 | kg | 2,906.5 | 5.93 | Melting |
| Material | Carbon additive | 167.75 | kg | 704.57 | 1.44 | Melting |
| Material | Silicon carbide | 37.36 | kg | 548.5 | 1.12 | Melting |
| Material | Ferrosilicon | 12.96 | kg | 29.81 | 0.06 | Melting |
| Material | Steel shot | 0.01 | kg | 0.12 | 0.00 | Machining |
| Energy | Crane (molding) | 0 | kWh | 0 | 0.00 | Molding |
| Energy | Sand mixer | 29.05 | kWh | 27.03 | 0.06 | Molding |
| Energy | Crane (melting) | 1.49 | kWh | 1.39 | 0.00 | Melting |
| Energy | Furnace | 3,812.6 | kWh | 3,545.72 | 7.23 | Melting |
| Energy | Crane (recycling) | 0.85 | kWh | 0.79 | 0.00 | Recycling |
| Energy | Sand processing line | 680.19 | kWh | 632.91 | 1.29 | Recycling |
| Energy | Crane (machining) | 2.35 | kWh | 2.18 | 0.00 | Machining |
| Energy | Shot blasting machine | 26.67 | kWh | 24.80 | 0.05 | Machining |
| Waste | Dust treatment (molding) | 4.28 | kWh | 3.97 | 0.01 | Molding |
| Waste | Dust treatment (melting) | 3.65 | kWh | 3.39 | 0.01 | Melting |
| Waste | Dust treatment (recycling) | 7.66 | kWh | 7.12 | 0.00 | Recycling |
| Waste | Dust treatment (machining) | 0.08 | kWh | 0.07 | 0.00 | Machining |
| Waste | Slag transport | 0.002 | kWh | 0.002 | 0.00 | Melting |
Analysis of the results reveals that material carbon emissions dominate the total footprint for sand casting products, accounting for over 90% of emissions. Within material emissions, the melting stage contributes more than 99%, primarily due to high-emission factors for ingredients like steel scrap. This highlights a key area for intervention: optimizing molten metal composition by increasing the proportion of low-carbon materials, such as pig iron or recycled content, can significantly reduce emissions for sand casting products. Additionally, minimizing excess molten metal through better gating and riser design can lower material consumption. Energy emissions, though smaller, offer reduction opportunities through equipment efficiency improvements, such as using high-efficiency furnaces or renewable energy sources. Waste emissions are negligible in this case, but in larger-scale production, they may become more relevant, warranting attention to waste minimization and treatment technologies.
The model’s strength lies in its ability to allocate emissions to individual sand casting products, enabling precise carbon footprint tracking. This granularity supports decision-making in product design, process optimization, and supply chain management. For instance, designers can use the model to compare emissions across different material choices or geometries for sand casting products. Production managers can identify high-emission stages and implement targeted measures, such as adjusting sand-to-metal ratios or upgrading recycling systems. Furthermore, the model aligns with carbon accounting standards like ISO 14067 and PAS 2050, facilitating compliance and reporting for enterprises producing sand casting products.
Limitations of the approach include data availability and accuracy. Collecting detailed consumption data for each production stage can be challenging, especially in traditional foundries. The model relies on emission factors that may vary by region or source, introducing uncertainty. Future work could integrate real-time monitoring systems to improve data precision or develop industry-specific emission factor databases. Additionally, expanding the system boundary to include upstream and downstream phases would provide a more holistic assessment for sand casting products, though this may increase complexity.
In conclusion, we have developed a robust quantitative method for calculating carbon emissions in sand casting products. By combining input-output and process analysis within a life cycle framework, the model effectively breaks down emissions into material, energy, and waste categories across production stages. Application to a wind turbine locking disk demonstrates its practicality and insights for emission reduction. For sand casting products, this approach not only quantifies carbon footprints but also guides sustainable manufacturing practices. As industries strive toward carbon neutrality, such tools are essential for transforming traditional processes like sand casting into greener alternatives. We encourage further research to refine the model and explore its integration with digital technologies for broader impact on sand casting products and beyond.