
In my work as a foundry engineer, I have been involved in the production of pump shell castings made from GG30 material, each weighing 28.8 kg. The production line uses a KW molding system imported from Germany, with flask dimensions of 800 mm × 600 mm × 300 mm/300 mm. The cores are made from resin-coated sand, and the pattern layout is four pieces per mold. Melting is performed in a 3 t/h medium-frequency induction furnace. Over time, I encountered several persistent sand casting defects that significantly affected yield and quality. This article details my systematic approach to identifying, analyzing, and mitigating these defects, with a focus on quantitative measures and practical solutions.
The primary sand casting defects observed were shrinkage porosity, core shift, and gas porosity. Each defect exhibited distinct characteristics and required tailored interventions. Below, I describe these defects in detail, along with the root cause analysis and corrective actions taken. Extensive use of tables and formulas will illustrate the process improvements and outcomes.
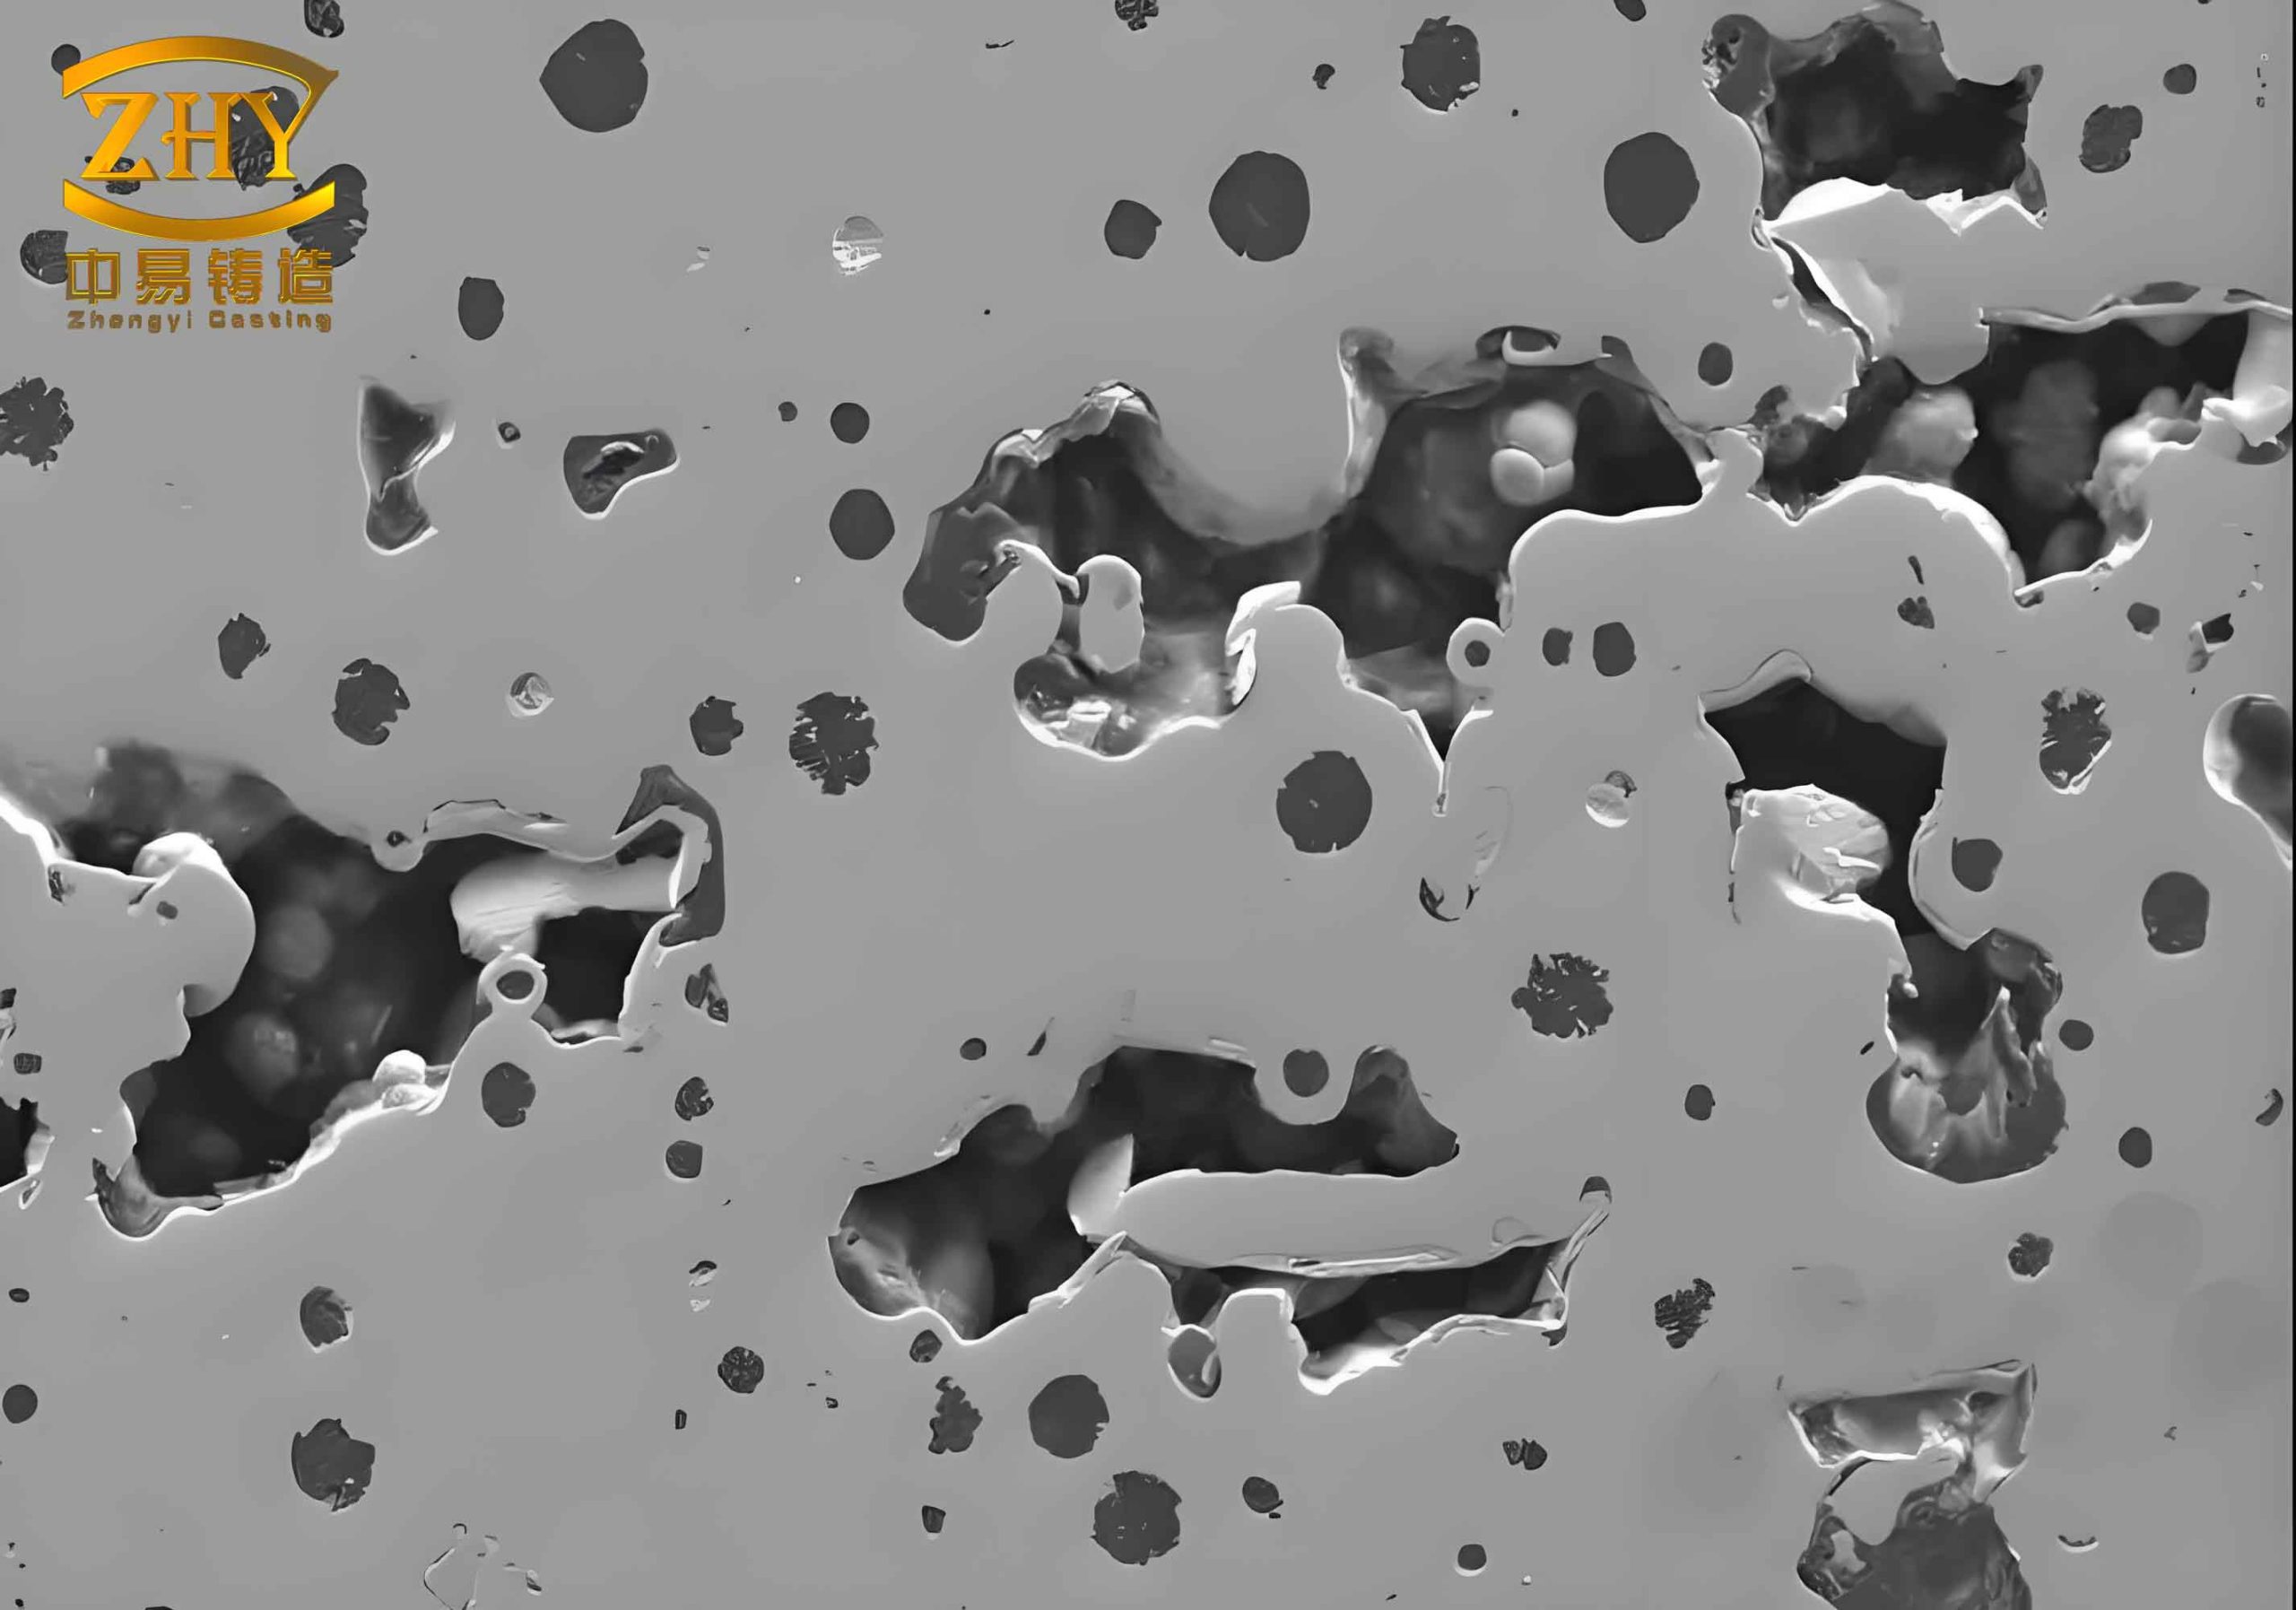
Defect Characterization
1. Shrinkage Porosity – This defect occurred approximately 30–25 mm from the flange face, within a small region of about 5 mm × 6 mm × 7 mm. This area corresponds to the threaded hole location used for assembling the pump shell with the rear cover. The shrinkage was fine and dispersed, making it difficult to detect visually but becoming evident during machining. The defect was classified as a typical micro-shrinkage porosity in sand casting, resulting from inadequate feeding of the last solidifying liquid metal.
2. Core Shift – Dimensional inspection revealed a wall thickness variation of 2.2–2.5 mm at the tail end of the pump shell (where the 55 mm bore is located). The lower wall was thicker than the upper wall, exceeding the permissible tolerance. This core shift defect is common in sand casting when the core is displaced during mold assembly or metal pouring.
3. Gas Porosity – External gas pores appeared at a specific location on the casting, with one isolated pore per casting measuring 6–15 mm in diameter and 3–6 mm in depth. The scrap rate due to this sand casting defect reached 45%, causing significant production losses.
Quantitative Analysis of Defect Mechanisms
To understand the shrinkage porosity, I calculated the volumetric contraction of the liquid iron during solidification. The density of molten iron at pouring temperature (~1400°C) is approximately 7.0 g/cm³, while solid iron at room temperature is about 7.8 g/cm³. The total solidification shrinkage for gray iron is around 2–3% due to graphitization expansion partially compensating for contraction. However, in the absence of proper feeding channels, even a small shrinkage can cause porosity. The volume of the shrinkage cavity can be estimated by:
$$ V_{shrink} = \beta \cdot V_{liquid} $$
where β is the volumetric shrinkage factor (typically 0.02–0.03 for GG30). For the local region near the flange, the liquid volume was small, but the lack of a feeder meant that the shrinkage could not be compensated. The core shift defect was analyzed by measuring the resultant displacement vector. The core shift distance d can be expressed as:
$$ d = \sqrt{(\Delta x)^2 + (\Delta y)^2 + (\Delta z)^2} $$
where Δx, Δy, Δz are the deviations in three orthogonal directions. In our case, the dominant shift was along the vertical direction (z-axis) due to buoyancy forces acting on the core during pouring. Gas porosity was attributed to trapped air or mold gases unable to escape. The pressure of entrapped gas can be modeled by the ideal gas law:
$$ P_{gas}V_{gas} = nRT $$
which, combined with the metallostatic pressure, determines whether a pore will form.
Countermeasures and Process Modifications
Based on the analysis, I implemented several corrective actions targeting each sand casting defect:
1. Elimination of Shrinkage Porosity
Since the shrinkage was fine and without a direct feeding path, I focused on enhancing graphitization expansion during solidification. The carbon equivalent (CE) was increased by raising the carbon content from 3.0–3.1% to 3.1–3.2%, while keeping silicon constant. The total inoculant addition was raised from 0.4% to 0.5%. Additionally, the mold hardness was increased from 85 ±5 to 90 ±5 to resist the expansion pressure and ensure that the graphite expansion effectively compensates for shrinkage. To maintain tensile strength, small additions of copper and tin were made to stabilize pearlite. The chemical composition before and after modification is summarized in Table 1.
| Element | Before | After |
|---|---|---|
| C | 3.0–3.1 | 3.1–3.2 |
| Si | 1.8–2.0 | 1.8–2.0 |
| Mn | 0.6–0.8 | 0.6–0.8 |
| P | ≤0.10 | ≤0.10 |
| S | ≤0.08 | ≤0.08 |
| Cu | 0.2–0.3 | 0.3–0.4 |
| Sn | 0.02–0.03 | 0.04–0.05 |
| Inoculant | 0.4 | 0.5 |
The graphitization expansion volume can be approximated by the following equation assuming complete graphitization:
$$ \Delta V_{graph} = \frac{\Delta C}{100} \cdot \frac{\rho_{Fe} – \rho_{graphite}}{\rho_{Fe} \cdot \rho_{graphite}} \cdot V_{casting} $$
where ΔC is the increase in carbon content, ρ_Fe is the density of iron (7.2 g/cm³ at solidus), and ρ_graphite is the density of graphite (2.25 g/cm³). For a 1% increase in carbon, the theoretical expansion is about 2.5% in volume, but in practice only a fraction is effective due to gas evolution and mold dilation. The hardened mold (90 ±5) restricted dilation, maximizing the benefit.
2. Correction of Core Shift
To compensate for the predictable downward movement of the core during pouring, I shifted the core print center in the mold by 1.2 mm downward. This offset accounted for the expected sand compressibility and buoyancy forces. The design change ensured that after solidification, the casting wall thickness met the tolerance. Table 2 shows the measured wall thickness before and after the modification.
| Measurement Location | Before (max deviation) | After (max deviation) |
|---|---|---|
| Upper wall (55 mm end) | −2.5 | +0.4 |
| Lower wall (55 mm end) | +2.2 | −0.3 |
| Overall variation | 4.7 | 0.7 |
The core shift problem was thus resolved, reducing dimensional scrap to negligible levels.
3. Mitigation of Gas Porosity
Gas porosity in sand casting is often caused by inadequate venting. Instead of placing a vent pin directly on the casting surface (which would require post-cleaning and risk creating a new defect), I positioned the vent pin on the core print area. A 1 mm thick vent channel connected the vent pin to the casting cavity. This design allowed gases generated during pouring to escape efficiently without affecting the casting surface integrity. Figure 1 (shown earlier) illustrates the general layout, though the specific venting modification is described here. The venting capacity was calculated using the gas flow rate equation:
$$ Q = A \cdot \sqrt{\frac{2 \cdot (P_{mold} – P_{atm})}{\rho_{gas}}} $$
where A is the cross-sectional area of the vent channel, P_mold is the gas pressure in the mold cavity, P_atm is atmospheric pressure, and ρ_gas is the density of the gas. By ensuring adequate vent area, the gas pores were eliminated. The resulting scrap rate from gas porosity dropped from 45% to below 1%.
Experimental Validation and Production Results
Following the process changes, I conducted a series of trials followed by a pilot production run of several hundred castings. Ultrasonic testing and destructive sectioning were performed to evaluate shrinkage. The fine shrinkage porosity was transformed into a much smaller dispersed porosity region of 2 mm × 2 mm × 2 mm, which was completely removed during the subsequent drilling operation for the threaded hole. Table 3 summarizes the defect comparison.
| Defect Type | Before | After |
|---|---|---|
| Shrinkage porosity (size) | 5×6×7 mm³ | < 2×2×2 mm³ |
| Core shift (wall thickness variation) | 4.7 mm | 0.7 mm |
| Gas porosity (scrap rate) | 45% | <1% |
The overall yield increased substantially, and the cost savings from reduced rework and scrap were significant. Additionally, the mechanical properties of the castings remained within specification, with tensile strength exceeding 250 MPa as required for GG30.
Discussion on the Role of Graphitization Expansion
The success in controlling shrinkage porosity highlights the importance of managing volume changes during solidification in sand casting. Gray iron’s graphite expansion can be harnessed to self-feed if the mold is rigid enough. The expansion pressure generated can be expressed as:
$$ P_{exp} = \frac{E \cdot \epsilon}{1 – \nu} $$
where E is the modulus of the sand mold (increased with hardness), ε is the volumetric strain due to graphite, and ν is Poisson’s ratio. By increasing mold hardness from 85 to 90, I effectively increased E, allowing the expansion to compress the liquid metal into the shrinkage region. The increased carbon and inoculation promoted more nucleation sites for graphite, ensuring a finer and more dispersed graphite structure, which also benefitted mechanical properties.
Furthermore, the core shift correction is a classic example of compensating for predictable mold deformation in sand casting. The offset approach is simple yet effective, avoiding complex core support systems. For gas porosity, the venting strategy proved that proper channel design can eliminate one of the most common sand casting defects without additional machining.
Conclusion
Through systematic analysis and targeted modifications, I successfully reduced the occurrence of three major sand casting defects: shrinkage porosity, core shift, and gas porosity. The key actions included:
- Raising carbon content and inoculant addition to leverage graphitization expansion.
- Increasing mold hardness to restrict dilation.
- Offsetting the core print to counteract buoyancy-driven shift.
- Installing vent channels connected to core prints to expel gases.
These changes reduced the shrinkage region to dimensions that are fully removed during subsequent machining, brought wall thickness variation within tolerance, and cut gas porosity scrap from 45% to less than 1%. This case demonstrates that a deep understanding of sand casting defect mechanisms, combined with quantitative process control, can yield robust solutions even for complex castings like pump shells.