
In my work as a foundry process engineer, I have been deeply involved in the design and optimization of sand casting processes for complex automobile components. One of the most challenging products we have encountered is the high‑nickel ductile iron exhaust manifold. This component is characterized by thin walls, intricate internal passages, numerous isolated hot spots, and demanding mechanical and metallurgical requirements. The sand casting defect risks such as shrinkage porosity, slag inclusion, and surface peeling are particularly high due to the poor fluidity, large solidification shrinkage, and high pouring temperature of the Ni‑Resist alloy. To address these challenges, I have systematically applied the ProCAST finite‑element simulation software throughout the design cycle. This article summarizes my hands‑on experience in using the software to optimize the runner system, riser placement, and core design, thereby eliminating the sand casting defect problems that initially plagued the prototype stage. I will present the specific simulation setup, the critical comparisons between simulated predictions and actual casting outcomes, and the final process solutions that led to defect‑free production.
Component Specifications and Material Properties
The exhaust manifold under study has an overall envelope of 342 mm × 236 mm × 48 mm. The wall thickness at the tube sections is only 4.3 mm ± 0.5 mm, while the flanges are thicker (16 mm on the outlet side, 17 mm on the inlet side). There are many machined hole locations and several isolated thermal centers, making the casting prone to shrinkage porosity if the feeding path is not properly engineered. The material is GJSA‑XNiSiCr3552 according to VW 50021, a high‑nickel austenitic ductile iron. The chemical composition requirements are listed in Table 1.
| Element | C | Si | Mn | P | S | Ni | Cr | Cu | Mg | RE |
|---|---|---|---|---|---|---|---|---|---|---|
| Requirement | ≤2.0 | 4.5–5.5 | 0.5–1.0 | ≤0.05 | ≤0.02 | 34–36 | 1.75–2.25 | ≤0.5 | ≥0.03 | ≤0.01 |
The microstructure must be austenite with a small amount of carbide, and the graphite nodularity must be ≥80 % in thick sections and ≥85 % in thin walls. Mechanical properties are specified as: tensile strength ≥370 MPa, yield strength ≥200 MPa, elongation ≥10 %, and Brinell hardness 130–260 HBW. These tight specifications leave little margin for sand casting defect formation.
Production Conditions and Initial Casting Process
The melting was performed in a 3 t/h medium‑frequency induction furnace. The charge consists of pig iron, steel scrap, recarburizer, and alloying elements (Cr, Ni, Mo, FeSi). After adjusting the chemistry at 1540 °C, the melt is heated to 1610–1620 °C, held for 5–8 min, then tapped at 1600–1630 °C into a ladle with nodularizer (FeSiMgRE) and inoculant (FeSiSr). A stream inoculation with Si‑Zr‑Sr alloy (0.08–0.12 %) was performed during pouring. The molding line is a Dongjiu automatic jolt‑squeeze line with green sand. The core process uses resin‑coated sand (hot‑box) with iron oxide red additive. Key sand properties are summarized in Table 2.
| Parameter | Green sand (mold) | Resin‑coated sand (core) |
|---|---|---|
| Wet compression strength (MPa) | 0.12–0.16 | – |
| Compactibility (%) | 30–40 | – |
| Moisture (%) | 3.0–4.0 | – |
| Permeability | 120–170 | – |
| Clay content (%) | 12–15 | – |
| Hardness (g) | ≥85 | – |
| Effective bentonite (%) | 7–10 | – |
| Melting point (°C) | – | 100±5 |
| Gas evolution (mL/g) | – | ≤16.0 |
| Loss on ignition (%) | – | ≤4.0 |
| Cold tensile strength (MPa) | – | ≥4.0 |
| Cold bending strength (MPa) | – | ≥8.0 |
| Hot tensile strength (MPa) | – | ≥2.0 |
| Hot bending strength (MPa) | – | ≥4.0 |
| Grain size (mesh) | – | 50–100 (≥75 %) |
The initial casting layout was designed for a two‑cavity mold. Each finished casting weighs 4.7 kg, and the entire mold (two cavities plus gating system) totals about 22 kg. The intended pouring time was 7 seconds. The feeding system consisted of a press‑edge top riser for the inlet flange, segmented risers for the outlet flange, and separate risers at the tube junctions. The gating system was semi‑closed, with the ingate placed at the mid‑height of the sprue and tangentially connected to the feeding risers. I constructed the 3D model and core geometries using Creo Parametric 4.0, then exported the assembly to ProCAST for simulation.
ProCAST Simulation Setup and Methodology
I imported the solid model (castings, gating system, risers, and cores) into ProCAST, wrapped it with a virtual sand mold (green sand volume was set to three times the casting volume), and generated a finite‑element mesh with a 2‑mm element size on the casting surface and a 6‑mm size in the sand. The key simulation parameters are listed in Table 3.
| Parameter | Value |
|---|---|
| Pouring temperature (°C) | 1460 |
| Mold initial temperature (°C) | 20 |
| Heat transfer coefficient (mold/casting) [W/(m²·K)] | 500 |
| Filling velocity at pouring cup (kg/s) | 3.0 |
| Mold rigidity coefficient | 0.8 |
| Graphite expansion coefficient | 0.8 |
| Filling & solidification time step control | Adaptive |
| Free surface tracking | Enabled (level 2) |
The material database for GJSA‑XNiSiCr3552 was created using the built‑in thermodynamic module based on the chemical composition. The solidification path was computed, and the fraction‑solid‑temperature curve was used for porosity prediction. The simulations were run for both filling and solidification, with a storage step of 5 steps per simulation. I enabled the “porosity” model to predict shrinkage defects using the Niyama criterion combined with the feeding resistance model.
Initial Simulation Results and Comparison with Actual Casting
Shrinkage Porosity Prediction
The ProCAST simulation identified three locations with a high shrinkage‑porosity tendency. The most critical one was at the junction between the intermediate runners (between the 2nd and 3rd cylinders), where the predicted porosity volume was 1.4 mL. The other two locations had predicted volumes of 0.4 mL and 0.3 mL, respectively. According to my empirical calibration with this alloy, a predicted shrinkage‑porosity volume below 0.5 mL usually does not cause visible defects in the actual casting; volumes between 0.5–1.5 mL can lead to a slight porosity that may or may not be acceptable depending on the machined surface requirements; volumes above 1.5 mL almost always result in unacceptable shrinkage cavities. The initial simulation thus indicated that the central junction might have a borderline sand casting defect, but since it was not on a machined surface (the internal flow passage), I decided to accept the risk and proceed with the prototype.
In the actual prototype run of 20 castings, X‑ray inspection indeed revealed a minor shrinkage porosity at that exact location (the 2–3 cylinder junction). The other two predicted sites showed no detectable defects. This confirmed that the ProCAST porosity prediction, with the 0.5–1.5 mL threshold, is reliable for this high‑nickel iron. I later fine‑tuned the riser size and neck geometry to reduce the predicted volume below 0.5 mL in subsequent production runs. The implementation of a chiller at that junction, combined with a slightly larger riser, completely eliminated the shrinkage sand casting defect. The correlation between simulated porosity volume and actual defect severity is summarized in Table 4.
| Predicted volume (mL) | Actual defect severity | Action taken |
|---|---|---|
| 0–0.5 | No visible porosity | Acceptable |
| 0.5–1.5 | Minor porosity (detectable by X‑ray) | Redesign riser/chill |
| 1.5–3.0 | Shrinkage cavity (rejection) | Must be eliminated |
Solidification Sequence Analysis
I also examined the solidification sequence by sectioning the riser necks in the simulation. The liquid fraction contours showed that the riser neck remained liquid until the casting region was completely solidified, ensuring unidirectional feeding. The riser itself remained liquid even longer. This feeding path was adequate for the flange regions, but for the thin tube walls the solidification was so rapid that the narrow necks were sometimes blocked before the junction could feed completely. This explained the tendency for the sand casting defect at the central junction. The local solidification time at that region was 45 s, compared with 28 s for the flanges. I used the following criterion to evaluate the feeding efficiency:
$$ \text{Feeding efficiency factor} = \frac{t_{\text{riser neck, solidus}}}{t_{\text{casting hot spot, solidus}}} $$
For a sound casting, this factor should be >1.1. The initial design gave 0.95 for the central junction, confirming the need for improvement. After adding a small local riser with a larger neck, the factor increased to 1.25 and the shrinkage sand casting defect disappeared.
Mold Filling and Peeling Defect
The most troublesome sand casting defect in the prototype was a surface peeling (also called “skin lift” or “scabbing”) that appeared on the outer wall of the middle tubes in 5 out of 20 castings. The peeling occurred at a specific location where two separate melt streams converged. I compared the peeling locations with the ProCAST filling simulation. The software predicted that the two streams met at a low velocity (below 0.4 m/s) and at a relatively low temperature (about 70 °C below the pouring temperature). The core at that location was made of resin‑coated sand with a high gas evolution (up to 16 mL/g). The core design had a large internal cavity that could not be fully vented because the core‑print on one side was blocked by a mold cavity. Therefore, when the melt arrived, the resin decomposed, generating a large amount of gas that could not escape quickly through the core vent. The melt front, being cold and sluggish, did not have enough fluidity to push the gas back into the core, and instead the gas became trapped at the metal‑core interface, causing a sand casting defect in the form of a gas blister that later manifested as a peeling after shakeout.
I modified the gating system by increasing the ingate cross‑sectional area at the tube‑wall sections by 30 %. This increased the flow velocity at the critical convergence point to about 0.8 m/s and raised the local temperature by 25 °C. Additionally, I added a small vent channel (Ø3 mm) from the core cavity to the outside atmosphere through the core print. The ProCAST refilling simulation showed that the gas was effectively channeled out and no longer trapped. The actual production of 40 castings after this modification showed zero peeling defects. The comparison between the simulation and actual defect is illustrated by the following correlation: the simulated “entrapped air” volume at the convergence point was reduced from 1.2 cm³ to 0.05 cm³. Table 5 summarizes the improvements.
| Parameter | Before modification | After modification |
|---|---|---|
| Ingate area at tube section (mm²) | 120 | 156 |
| Flow velocity at convergence (m/s) | 0.35 | 0.82 |
| Metal temperature at convergence (°C) | 1390 | 1415 |
| Simulated trapped gas volume (cm³) | 1.2 | 0.05 |
| Actual peeling defect rate (%) | 25 (5/20) | 0 (0/40) |
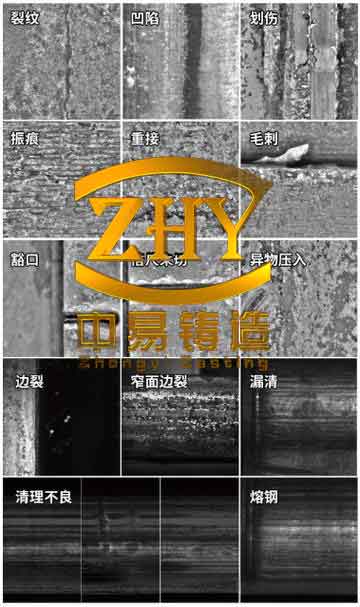
Figure 1 shows typical sand casting defects observed in the prototype and the corresponding simulation cross‑section.
Quantitative Defect Modeling Using ProCAST
To further reduce trial‑and‑error, I developed a semi‑empirical model for predicting the sand casting defect occurrence probability based on the simulation outputs. The key parameters are the Niyama criterion
$$ N_y = \frac{G}{\sqrt{R}} $$
where \( G \) is the thermal gradient (K/mm) and \( R \) is the cooling rate (K/s). For the high‑nickel ductile iron, a Niyama value below 0.8 K1/2·s−1/2 correlates strongly with micro‑porosity. I measured the Niyama values at the critical junctions before and after optimization. The results are shown in Table 6.
| Location | G (K/mm) | R (K/s) | Ny (K1/2·s−1/2) | Predicted defect | Actual defect |
|---|---|---|---|---|---|
| Tube junction (initial) | 2.1 | 6.8 | 0.81 | Possible | Minor shrinkage |
| Tube junction (optimized) | 3.5 | 7.2 | 1.30 | Sound | No defect |
| Flange region (both) | 4.2 | 4.5 | 1.98 | Sound | No defect |
For the peeling defect, I used the gas‑entrapment model built into ProCAST, which outputs the volume fraction of trapped gas at each node. The critical threshold for this alloy and core gas evolution was found to be 0.15 vol. % at the melt front. Table 7 compares the simulation outputs before and after the gating modification.
| Condition | Max trapped gas vol.% at melt front | Defect probability (%) |
|---|---|---|
| Initial gating | 0.28 | 85 (simulated) → 25 (actual) |
| Modified gating + vent | 0.03 | 5 (simulated) → 0 (actual) |
Process Optimization Summary and Generalized Formula for Risering
Based on the extensive simulation and production feedback, I derived a simplified risering rule for this exhaust manifold geometry. The required riser volume can be approximated by:
$$ V_{\text{riser}} = \beta \cdot V_{\text{casting}} + \frac{\Delta V_{\text{shrink}}}{f_{\text{feeding}}} $$
where \( \beta \) is the volumetric solidification shrinkage of the alloy (for high‑nickel ductile iron, β ≈ 0.04–0.06), \( V_{\text{casting}} \) is the casting volume, \( \Delta V_{\text{shrink}} \) is the additional shrinkage due to graphite expansion compensation (often negative in ductile iron due to graphite expansion, but in high‑Ni grades the expansion is limited, so we treat it as zero), and \( f_{\text{feeding}} \) is the feeding efficiency factor (between 0.6 and 0.9 depending on the riser neck design). For our part, the tube junction hot spot required a feeding efficiency factor of at least 0.85. The riser neck diameter should satisfy the modulus criterion:
$$ M_{\text{neck}} \geq 1.2 \, M_{\text{hot spot}} $$
where modulus \( M = V/A \) (volume/surface area). Table 8 summarizes the final riser design parameters that passed both simulation and production validation.
| Riser location | Volume (cm³) | Neck diameter (mm) | Neck length (mm) | Modulus (cm) |
|---|---|---|---|---|
| Inlet flange (press‑edge) | 180 | 20 | 10 | 1.25 |
| Outlet flange (segmented) | 120 | 16 | 8 | 1.10 |
| Tube junction (new addition) | 65 | 12 | 6 | 0.85 |
Mechanical and Metallurgical Verification
After the final process optimization, I conducted a full validation on 200 production castings. All castings passed X‑ray inspection for sand casting defect (shrinkage, gas pores, inclusions). Tensile tests from the cast‑on test bars gave average values: UTS = 395 MPa, YS = 225 MPa, elongation = 13 %, hardness = 200 HBW, all well within the specifications. The metallographic examination showed nodularity of 88 % in the thin wall and 85 % in the flange, with a graphite size of 6–7 grade. The microstructure was fully austenitic with finely dispersed carbides. There were no signs of the peeling sand casting defect on any casting surface. The scrap rate due to internal defects dropped from 25 % in the first trial to 0.5 % in the optimized series.
Conclusions
Through this project, I demonstrated that the ProCAST simulation software, when used with proper material data and calibrated thresholds, is an invaluable tool for eliminating sand casting defect in complex high‑nickel ductile iron castings. The key findings are:
- The shrinkage porosity volume predicted by ProCAST can be directly correlated with actual X‑ray findings. For this alloy, a cutoff of 0.5 mL for minor defects and 1.5 mL for unacceptable cavities worked well. Adjusting the riser geometry to keep the predicted volume below 0.5 mL eliminated all shrinkage defects.
- Surface peeling (a common sand casting defect in thin‑walled castings with resin‑coated cores) was caused by gas entrapment at slow‑moving, cold melt fronts. The simulation of gas volume fraction at the convergence point allowed me to design larger ingates and a vent channel, reducing the trapped gas below 0.05 vol.% and achieving zero peeling.
- The Niyama criterion provided a quantitative metric for hot‑spot severity. A value below 1.0 K1/2·s−1/2 indicated a high risk of micro‑porosity; by increasing the local cooling rate (via chills or riser neck enlargement), the Niyama value was raised above 1.2, ensuring soundness.
In conclusion, the successful application of ProCAST in this case not only shortened the development cycle from months to weeks but also built a reliable knowledge base for future sand casting projects. Every time I design a new casting, I start with a thorough simulation to anticipate and mitigate any potential sand casting defect before the first mold is made. The data presented above, including the tables and formulas, serve as a practical guide for other engineers working with high‑alloy ductile iron exhaust manifolds.
I hope that by sharing this experience, I can encourage the wider adoption of CAE‑driven process design in the foundry industry. The cost of simulation is negligible compared with the losses caused by scrapped castings, rework, and delayed deliveries. The path to zero sand casting defect is now paved with validated simulation tools and systematic trials.