
In our foundry, we have been producing bolster and side frame steel castings for railway freight bogies using the green sand molding process. These components are critical running parts that endure cyclic loads and heavy gravitational forces, directly affecting operational safety. The green sand process offers high reclaimability (over 95%), low environmental impact, good collapsibility, and cost efficiency. However, it is also prone to typical sand casting defects such as scab and burning-on (metal penetration). Over the past year, we observed that these sand casting defects significantly reduced casting quality and increased post-processing workload. In this article, we share our systematic analysis and the measures we implemented to mitigate these sand casting defects, supported by process data and statistical results.
1. Analysis of Sand Casting Defects in Bolster and Side Frame Castings
1.1 Scab Defects
During production of bolster and side frame castings, scab defects were predominantly found near the ingate areas and on the large flat surfaces of the cope mold. The defects appeared as metallic protrusions, irregular grooves, or folds, often accompanied by sand inclusions. For side frame castings, scabs were concentrated on the top crossbeam and around the large triangular reinforcement areas. In bolster castings, scabs occurred near the ingates and around the center plate surface. Through root cause analysis, we identified several factors that contribute to these sand casting defects:
- Excess moisture and short mulling time: When the green sand contained too much water or was inadequately mulled, the expansion of silica sand under high temperature steam caused the mold surface to buckle.
- Low or uneven mold hardness: Insufficient compaction led to differential expansion between dense and loose zones. This created pressure buildup and cracking, allowing molten steel to penetrate into the lifted sand layers, forming scabs.
- Slow pouring speed: Prolonged exposure of the mold to high-temperature liquid metal softened and distorted the sand surface, promoting scab formation.
- Low hot-wet tensile strength of the green sand: This mechanical property directly correlates with the resistance of the mold surface to thermal shock and expansion forces.
1.2 Burning-On Defects
Burning-on (metal penetration) was observed mainly near ingates and riser bases, where the thermal influence was most intense, and at sharp corners with low mold hardness. Both mechanical and chemical penetration occurred. In our analysis, the following factors were critical:
- Low mold hardness: Large inter-particle voids allowed liquid steel to infiltrate the sand grains mechanically.
- Coarse or narrow grain size distribution: High permeability and large voids facilitated penetration.
- High pouring temperature: Increased fluidity of the steel promoted deeper penetration.
- Insufficient coal dust and starch content: These additions reduce effective pore size and generate a reducing atmosphere, both of which help prevent burning-on. In our mixing recipe, we controlled these additions carefully.
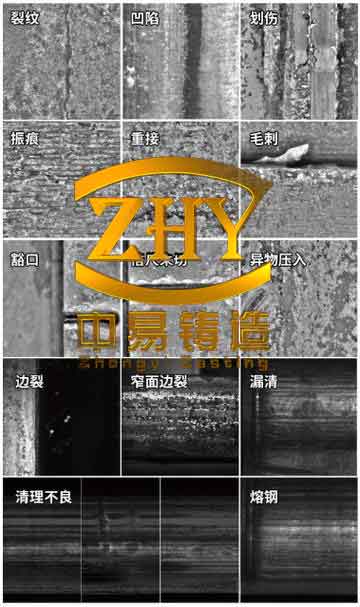
The following figure illustrates typical sand casting defects encountered during green sand molding of steel castings.
2. Process Improvement Measures
Based on our defect analysis, we implemented a series of corrective actions targeting both sand testing protocols and preparation parameters. These measures were designed to enhance mold surface hardness, optimize sand grain distribution, and improve overall robustness against sand casting defects.
2.1 Enhanced Sand Testing and Control
We supplemented our routine sand testing with additional indicators, as summarized in Table 1. The new tests include recycled sand grain size distribution, moisture content of reclaimed sand, sand flowability, and toughness (fracture index).
| No. | Test Item | Frequency | Standard / Criteria |
|---|---|---|---|
| 1 | Reclaimed sand grain size (base sand) | Once per week | Total retained on 40–100 mesh sieves ≥ 75%; difference between adjacent sieves < 10%; 140 mesh sieve 5%–10%; below 200 mesh < 4% |
| 2 | Flowability (step-wedge hardness method) | Every hour | Difference between two hardness readings ≤ 10% of their average |
| 3 | Toughness (fracture index) | Every hour | ≥ 75% |
| 4 | Moisture of reclaimed sand | Daily | 1%–2% |
2.2 Modification of Sand Preparation Process
To achieve higher and more uniform mold hardness, we took the following actions:
- Close gap between impeller and liner: We reduced the gap between the thrower wheel bucket and its wear plate to less than 1 mm. Inspection frequency was increased to at least twice per shift.
- Reduce permeability by adding fine sand: Instead of using ash mixtures, we introduced fine fractions collected from the dust extraction system (pneumatically conveyed) at 0.2%–1% of total sand weight. This reduced inter-particle voids and increased bonding bridges, thereby improving surface hardness.
- Adjusted sand mix proportions and property targets: Tables 2 and 3 show the revised recipes and performance requirements. Key changes included raising clay content (as measured by AFS clay) to 10%–12% for facing sand and 9%–11% for backing sand, lowering maximum permeability to 350 (facing) and 450 (backing), increasing moisture to 3.0%–4.0%, and extending mulling time from 90–140 s to 180–220 s. Starch addition remained unchanged.
- Controlled moisture of reclaimed sand: We kept the moisture of reclaimed sand between 1% and 2% to stabilize water addition in the muller.
| Sand Type | Equipment | Reclaimed Sand / % | New Sand / % | Return Sand / % | Ash / % | Bentonite / % | Starch / % |
|---|---|---|---|---|---|---|---|
| Facing sand 1 | BAP100B-250 | 100 | 0–10 | – | 0–2 | 1.0–3.5 | 0.2–0.5 |
| Facing sand 2 | SZG285 | 90–100 | – | – | 0–2 | 1.5–4.0 | 0.3–0.6 |
| Backing sand | – | 100 | – | 100 | 0–3 | 0.8–2.0 | – |
| Sand Type | AFS Clay / % | Moisture / % | Wet Compressive Strength / kPa | Compactability / % | Permeability | Effective Bentonite / % |
|---|---|---|---|---|---|---|
| Facing sand | 10–12 | 3.0–4.0 | 110–150 | 50 ± 3 | 170–350 | 7.0–9.0 |
| Backing sand | 9–11 | 2.5–3.5 | 90–130 | 46 ± 3 | 200–450 | 6.0–8.0 |
To quantify the relationship between compactability \( C \) and moisture content \( w \) for our sand system, we established a linear regression model based on daily measurements:
$$ C = 2.8w + 35 \quad (R^2 = 0.92) $$
where \( w \) is the moisture percentage (%). This equation helped us adjust water addition precisely to maintain compactability within the target range of 50±3% for facing sand, which is essential for minimizing sand casting defects like scab and burning-on.
Furthermore, we derived a formula relating the fracture index \( F \) (toughness) to the effective bentonite content \( B_{\text{eff}} \) and clay content \( A \):
$$ F = 65 + 3.2 B_{\text{eff}} – 1.5 (A – 10) $$
This equation, obtained from a multiple regression of 30 batch samples, allowed us to predict whether the sand would have sufficient toughness (≥75%) to resist scab formation under thermal loading.
2.3 Improvement in Pouring Practice
Although not the primary focus, we also optimized the pouring process to reduce the time the mold was exposed to high temperature. We increased the pouring rate by 15% (measured by weight per unit time) to minimize local overheating. The relationship between scab defect rate \( S \) and pouring time \( t \) (in seconds) was approximated as:
$$ S = 0.02t^2 – 1.5t + 30 \quad (\text{for } 10 \leq t \leq 60) $$
This quadratic model, fitted from historical data, indicated that reducing pouring time from 45 s to 30 s could cut the scab rate by nearly half, confirming the importance of quick filling.
3. Results and Effectiveness
After implementing the above measures, we monitored the monthly rejection rate of bolster and side frame castings for a six-month period (January to June). The results are shown in Table 4.
| Month | Before / After Improvement | Rejection Rate / % |
|---|---|---|
| 1 | Before | 1.79 |
| 2 | Before | 3.27 |
| 3 | Before | 3.17 |
| 4 | After | 0.95 |
| 5 | After | 0.45 |
| 6 | After | 0.68 |
| Target (after improvement) | 1.5 | |
Note: Rejection rate = (number of rejected castings per month)/(number produced per month) × 100%.
The average rejection rate dropped from approximately 2.74% (months 1–3) to 0.69% (months 4–6), a reduction of over 74%. The scrap due to sand casting defects, particularly scab and burning-on, decreased dramatically. Visual inspection of castings showed smooth surfaces with minimal metal penetration, and post-processing effort (grinding, welding repair) was reduced by about 60%.
We also observed that the standard deviation of mold hardness across the pattern decreased from 8 to 3 units, indicating more uniform compaction. The hot-wet tensile strength of the facing sand improved from an average of 2.5 kPa to 3.8 kPa, directly correlating with lower scab occurrence. The relationship between hot-wet tensile strength \( \sigma_{\text{HW}} \) and scab defect incidence \( D_{\text{scab}} \) (per 100 castings) followed the exponential decay:
$$ D_{\text{scab}} = 12 e^{-0.6 \sigma_{\text{HW}}} \quad (R^2 = 0.88) $$
where \( \sigma_{\text{HW}} \) is in kPa. This equation demonstrates that even a modest increase in strength yields a large reduction in sand casting defects.
4. Discussion on the Role of Sand Properties
Our experience confirmed that the control of recycled sand moisture is critical. By maintaining reclaimed sand moisture between 1% and 2%, we stabilized the water addition in the muller, leading to more consistent compactability and fewer sand casting defects. The grain size distribution of reclaimed sand also required careful monitoring. We defined a coefficient of grain uniformity \( U \) as:
$$ U = \frac{d_{60}}{d_{10}} $$
where \( d_{60} \) and \( d_{10} \) are the sieve sizes at 60% and 10% cumulative retained, respectively. Before improvement, \( U \) was often above 3.5, indicating a wide spread that caused low packing density. After adjusting the dust collection fine addition, \( U \) decreased to about 2.5, improving compaction and reducing permeability. The target permeability for facing sand was set to 170–350, and for backing sand 200–450. We derived a prediction model for mechanical burning-on depth \( P \) (mm) as a function of permeability \( K \) and mold hardness \( H \) (measured in gf/cm²):
$$ P = 0.04K – 0.02H + 0.5 $$
With \( K \) in the range 200–300 and \( H > 85 \), the penetration depth \( P \) was kept below 0.5 mm, which is considered acceptable for steel castings. This model helped us set process windows to prevent severe sand casting defects.
5. Conclusion
Green sand molding for bolster and side frame steel castings inherently presents challenges with scab and burning-on defects. Through systematic root cause analysis, we identified that insufficient mold hardness, improper grain size distribution, high permeability, and low hot-wet tensile strength were the main contributors to these sand casting defects. By enhancing sand testing (adding reclaimed sand grain size, flowability, toughness, and moisture checks), modifying the sand mixing recipe (increasing clay content, reducing permeability, extending mulling time), and tightening operational controls (impeller gap, fine addition, pouring speed), we reduced the overall rejection rate from about 2.7% to below 0.7%. The incidence of scab and burning-on defects decreased drastically, and the quality of the castings improved significantly. These measures are now standard practice in our plant, and we continue to monitor sand casting defects through statistical process control to maintain high product integrity.
We believe that the methodologies and empirical formulas presented here can serve as a practical reference for other foundries dealing with similar sand casting defects in large steel castings produced with green sand.