
Steel casting is one of the most challenging manufacturing routes for structural components because of the high pouring temperature, relatively poor fluidity, large volumetric shrinkage, and complex solidification behavior of liquid steel. In my recent project, I was responsible for developing a reliable sand casting process for a steel casting beam that would be used as a load-bearing member in a crane structure. The beam is essentially a long, flat and uniformly walled component with several local thick sections. Because the steel casting must satisfy strict internal quality requirements, I decided to use numerical simulation to support the design phase. This article describes my complete workflow, starting from conventional casting process design, continuing with numerical simulation of the initial layout, then moving through defect analysis and process optimization, and ending with the validation of the optimized steel casting process by actual production and inspection.
1. Engineering Significance and Initial Challenges of the Steel Casting Beam
The steel casting beam is a typical structural component in mechanical engineering. It is widely used in machine tools, cranes, and other heavy equipment. In service, the beam is often subjected to large bending moments and impact loads, so the steel casting must possess excellent strength, ductility, and impact toughness. I selected the cast steel grade ZG270-500, which is a medium-carbon steel with a nominal yield strength of 270 MPa and a tensile strength of 500 MPa. This steel casting grade offers a good balance between strength and plasticity. However, medium-carbon steel also presents several foundry difficulties. The solidification temperature interval is relatively wide, and the volumetric shrinkage is significant. As a result, the steel casting is prone to shrinkage cavities, porosity, hot cracking, and deformation. These defects severely reduce the load-carrying capacity of the steel casting, so the foundry process must be designed with extreme care.
Table 1 lists the nominal chemical composition of the selected steel casting grade. The total carbon content is moderate, which provides high strength while retaining acceptable weldability. Nevertheless, the presence of carbon increases the susceptibility to solidification shrinkage and microporosity. Therefore, my design strategy was to promote directional solidification in all regions of the steel casting and to ensure that every isolated liquid pool is connected to an adequate riser during the solidification sequence.
| Element | C | Si | Mn | P | S | Mo | Cr | Ni |
|---|---|---|---|---|---|---|---|---|
| Content | 0.32–0.42 | 0.20–0.45 | 0.50–0.80 | ≤0.04 | ≤0.04 | ≤0.20 | ≤0.35 | ≤0.30 |
The component geometry is relatively simple, but the high quality requirements make the steel casting process more demanding. According to the engineering specification, the steel casting beam is not allowed to contain cracks, cold shuts, visible shrinkage cavities, or penetrating porosity. Moreover, the entire casting must be inspected by ultrasonic testing according to MC2000 standard. I knew that such requirements could not be satisfied by trial-and-error alone, so I decided to combine conventional casting design calculations with a computational model of the filling and solidification process.
2. Conventional Design of the Steel Casting Process
2.1 Casting Method and Preliminary Data
Because the steel casting beam is a medium-sized component and the production quantity is large, I used sand casting with self-hardening sodium silicate sand as the molding material. The overall dimensions of the steel casting beam are approximately 1900 mm × 260 mm × 190 mm. The wall thickness is almost uniform, but there are two reinforcing ribs and thicker end sections that form local thermal centers. To maximize production efficiency, I arranged two steel casting beam cavities in one flask. This approach reduces the pouring time per casting and increases the productivity of the foundry.
Before designing the gating system, I estimated the total mass of the steel casting, including the cast beam, the gating system, and the risers. The pouring weight determines the nozzle diameter and the filling time. For a medium-sized steel casting poured from a bottom-pour ladle, a nozzle diameter of 45 mm is often a suitable starting point. The pouring rate must be high enough to fill the steel casting mold before the liquid steel loses too much temperature, but low enough to prevent sand erosion and turbulent entrapment.
2.2 Gating System Design
The steel casting has a narrow solidification range and a high melting point. It also oxidizes easily when exposed to air. Therefore, I chose an open gating system with a large effective cross-section. An open gating system is beneficial for steel casting because it can be filled quickly and quietly. The slag separation is mainly achieved by the bottom-pour ladle, so the gating system itself does not need to provide complex slag trapping. The critical design target is to deliver the liquid steel into the mold cavity smoothly, without causing jetting or aspiration.
I started by selecting the nozzle diameter \(d_n = 45\ \text{mm}\). The cross-sectional area of the nozzle is:
\[
A_n = \frac{\pi d_n^2}{4}
\]
Substituting the nozzle diameter, I obtained:
\[
A_n = \frac{\pi \times 45^2}{4} \approx 1590\ \text{mm}^2
\]
For an open steel casting gating system, the commonly used area ratio is:
\[
A_n : A_{\text{ingate}} : A_{\text{runner}} : A_{\text{sprue}} = 1 : (1.8 \sim 2.0) : (1.8 \sim 2.0) : (2.0 \sim 2.5)
\]
Using the lower part of this range, I calculated the preliminary areas for the ingate, runner, and sprue. The detailed dimensions of the gating system are summarized in Table 2. These dimensions were later imported into the View Cast software model for the initial steel casting simulation.
| Component | Cross-section shape | Key dimension / mm | Cross-sectional area / mm² |
|---|---|---|---|
| Runner | Trapezoid | Top width 55, bottom width 40, height 45 | ≈ 2138 |
| Sprue | Circular at bottom | Diameter 64 | ≈ 3217 |
| Ingate | Trapezoid | Width 35, height 30 | ≈ 1875 |
The filling time of a steel casting is usually kept short to avoid excessive heat loss. For this steel casting beam, the estimated filling time was in the range of 12 to 15 seconds. This value is consistent with the general recommendation for medium-carbon steel casting, which specifies a rapid mold filling to prevent cold shut and surface defects. The gating system dimensions shown in Table 2 were intended to produce a flow rate that fills the entire steel casting cavity in less than 15 seconds.
2.3 Riser Design and Thermal Modulus Calculations
Riser design is the most important step in a steel casting process because the volumetric solidification shrinkage of steel is large. A riser must remain liquid until the critical feeding paths have solidified, and it must supply enough liquid metal to compensate for the contraction of the steel casting. In order to determine the riser dimensions, I first identified the hot spots in the steel casting beam. The two end flanges and the two reinforcing ribs are thicker than the adjacent walls, so they are the natural locations for riser placement.
For each hot spot, I calculated the thermal modulus \(M\), which is defined as the ratio of volume to cooling surface area:
\[
M = \frac{V}{A}
\]
Using the solid model in UG, I measured the volume and surface area of each hot spot region. The end flanges had a modulus of about 1.9 cm, while the reinforcing rib junctions had a modulus of about 2.4 cm. According to the conventional modulus method for steel casting, the riser modulus must be larger than the casting modulus in order to solidify later. The relation used in my design was:
\[
M_r = f_r M_c
\]
where \(M_c\) is the modulus of the feeding region, \(M_r\) is the riser modulus, and \(f_r\) is a safety factor. For steel casting, \(f_r\) is often taken as 1.2. Therefore, the required riser modulus for the end flanges was approximately 2.28 cm, and for the reinforcing ribs it was approximately 2.88 cm.
For the end flanges, I used a cylindrical top riser with diameter \(d = 120\ \text{mm}\) and height \(h = 180\ \text{mm}\). The modulus of such a riser was calculated as:
\[
M_r = \frac{\pi r^2 h}{\pi r^2 + 2\pi r h}
\]
where \(r\) is the radius of the riser. With \(d = 120\ \text{mm}\), \(r = 60\ \text{mm}\) and \(h = 180\ \text{mm}\), I obtained:
\[
M_r = \frac{60 \times 180}{60 + 2 \times 180} \approx 24.6\ \text{mm} = 2.46\ \text{cm}
\]
This value was slightly larger than the required 2.28 cm, so the top riser was acceptable. For the reinforcing ribs, the wall thickness was too small to mount a practical top riser. I therefore designed side risers with diameter \(d = 140\ \text{mm}\) and height \(h = 280\ \text{mm}\). Each side riser was shared by two steel casting beam cavities in the two-cavity mold, allowing a more economical feeding arrangement. Table 3 summarizes the riser system used in the initial steel casting design.
| Location | Riser type | Diameter / mm | Height / mm | Modulus / cm |
|---|---|---|---|---|
| End flanges | Cylindrical top riser | 120 | 180 | 2.46 |
| Reinforcing ribs | Side riser | 140 | 280 | 2.92 |
The initial layout of the steel casting process was then generated as a three-dimensional solid model. The model included the two beam cavities, the gating system, the top risers, and the side risers. I exported this model as an STL file and imported it into View Cast for numerical simulation of filling and solidification.
3. Numerical Simulation of the Initial Steel Casting Process
3.1 Mesh Generation and Simulation Parameters
The View Cast software solves the governing transport equations for fluid flow and heat transfer in the mold and in the solidifying steel casting. Before computation, I generated a hexahedral mesh for the entire computational domain. The mesh density has a direct influence on the accuracy of the shrinkage prediction. A very coarse mesh may not resolve the thin walls and hot spots of the steel casting beam, while a very fine mesh consumes excessive computational time. I selected a mesh size that produced approximately two million control volumes. This resolution was sufficient to capture the temperature gradients and the solidification sequence in the steel casting beam.
The thermal and physical properties used for the steel casting and the sand mold are listed in Table 4. The initial pouring temperature was set to 1550 °C, and the initial sand mold temperature was 20 °C. The heat transfer coefficient at the casting-mold interface was set according to the View Cast database for steel casting in self-hardening sodium silicate sand. I also activated a constant heat convection boundary condition on the external surfaces of the mold.
| Parameter | Value |
|---|---|
| Pouring temperature | 1550 °C |
| Initial mold temperature | 20 °C |
| Molding material | Self-hardening sodium silicate sand |
| Mesh element count | 2,000,000 |
| Interface heat transfer coefficient | 500 W/(m²·K) |
| Liquidus temperature of steel casting | ≈ 1515 °C |
| Solidus temperature of steel casting | ≈ 1445 °C |
The transient temperature field in the steel casting and mold was computed using the Fourier heat conduction equation:
\[
\rho c_p \frac{\partial T}{\partial t} = \frac{\partial}{\partial x}\left(k\frac{\partial T}{\partial x}\right) + \frac{\partial}{\partial y}\left(k\frac{\partial T}{\partial y}\right) + \frac{\partial}{\partial z}\left(k\frac{\partial T}{\partial z}\right) + \rho L \frac{\partial f_l}{\partial t}
\]
In this equation, \(\rho\) is the density of the steel casting, \(c_p\) is the specific heat capacity, \(k\) is the thermal conductivity, \(L\) is the latent heat of fusion, and \(f_l\) is the liquid fraction. The last term represents the release of latent heat during solidification. In View Cast, the latent heat release is treated by the lever rule or the Scheil model depending on the micro-segregation assumption. For the medium-carbon steel casting selected here, I used a temperature-dependent solid fraction curve based on the Scheil equation:
\[
f_s = 1 – \left(\frac{T_m – T}{T_m – T_l}\right)^{1/(k_0 – 1)}
\]
where \(T_m\) is the melting point of pure iron, \(T_l\) is the liquidus temperature of the steel casting, and \(k_0\) is the equilibrium partition coefficient. The simulated steel casting solidification path could then be visualized by plotting the liquid fraction field at different times.
3.2 Simulated Solidification Sequence of the Initial Steel Casting Process
Figure 1 shows my recording of the liquid fraction evolution in the initial steel casting process. I have divided the solidification sequence into several time steps. At \(t = 172\ \text{s}\), the edges of the steel casting beam had begun to solidify. The outer corners and thin wall sections cooled first because their surface-to-volume ratio was large. At \(t = 352\ \text{s}\), the gating system had almost completely solidified, and the temperature of the steel casting was decreasing steadily. At \(t = 712\ \text{s}\), the thin walls between the end flanges and the reinforcing ribs had solidified, leaving several isolated pools of liquid steel. At \(t = 981\ \text{s}\), a large isolated liquid island appeared in the middle of the steel casting beam. This region was too far from any riser to receive liquid feed. At \(t = 1132\ \text{s}\), the four top risers had nearly solidified, but some liquid remained in the reinforcing rib region near the side risers. Finally, at \(t = 1342\ \text{s}\), the last liquid metal at the neck of the side risers solidified. Table 5 summarizes the solidification events observed in the initial steel casting simulation.
| Time / s | Observed event in the steel casting |
|---|---|
| 172 | Edges and thin sections begin to solidify |
| 352 | Gating system completely solidified |
| 712 | Thin walls between hot spots solidify |
| 981 | Isolated liquid pools appear in the central region |
| 1132 | Top risers are almost fully solidified |
| 1342 | Complete solidification of the steel casting |
3.3 Defect Prediction in the Initial Steel Casting
The distribution of shrinkage cavities and porosity in the initial steel casting process is shown in Figure 2. This predicted defect pattern revealed two critical problems. The first problem was located in the middle area of the steel casting beam, between the two reinforcing ribs. This central region was beyond the effective feeding distance of the adjacent side risers, and as a result the liquid steel isolated there could not be compensated during solidification. The second problem was located at the connection between the riser neck and the reinforcing rib. At this position, the local temperature remained high for a long time, and the side riser solidified before the feeding demand of the steel casting was fully satisfied. Consequently, shrinkage porosity formed at the riser neck.
These simulation results confirmed that the conventional design was not sufficient for a high-integrity steel casting. The risers were generally placed at the correct locations, but the feeding distance was too short for a steel casting beam of nearly 1900 mm in length. The feeding distance concept can be expressed for a plate-like steel casting by the equation:
\[
L_f = K M_c^{1/2}
\]
where \(L_f\) is the maximum feeding distance, \(M_c\) is the local modulus of the steel casting section, and \(K\) is a material constant. For steel casting, \(K\) is often close to 10 mm^{0.5}. In the central thin-wall region, the modulus was only about 1.2 cm, which gave a feeding distance of approximately:
\[
L_f = 10 \times (12)^{0.5} \approx 34.6\ \text{cm}
\]
The actual distance from the central hot spot to the nearest side riser was larger than this value. Therefore, the liquid steel in the middle of the steel casting beam could not be fed by the riser. In order to eliminate the predicted defects, I had to improve both the feeding capacity and the directional solidification of the steel casting.
4. Optimization of the Steel Casting Process
4.1 Addition of Chills to Control the Solidification Sequence
After analyzing the initial steel casting simulation, I decided to use chills to create additional cooling zones along the length of the beam. Chills increase the local cooling rate and reduce the effective solidification time of the adjacent steel casting. By placing chills at the central thin-wall sections and at the transition zones between the reinforcing ribs and the end flanges, I could divide the long steel casting beam into shorter feeding zones. Each feeding zone then had its own direct path to a riser, and the total feeding distance was shortened.
The effect of a chill can be approximated by modifying the local modulus of the steel casting surface. A chill acts as an additional heat sink, so the effective cooling area is increased. The equivalent modulus of a chilled section can be expressed as:
\[
M_{\text{eq}} = \frac{V}{A_{\text{mold}} + \eta A_{\text{chill}}}
\]
where \(A_{\text{mold}}\) is the sand surface area, \(A_{\text{chill}}\) is the chill surface area in contact with the steel casting, and \(\eta\) is the chilling efficiency factor. For steel chills in contact with a steel casting, I used \(\eta \approx 0.7\). This equation clearly shows that increasing the chill area reduces the equivalent modulus and promotes earlier solidification.
I placed steel chills with a thickness of 40 mm and a length of about 300 mm on the external surfaces of the central thin-wall region. Additional chills were placed near the under-rib fillets where the initial simulation had predicted shrinkage. The chills were properly coated to avoid sand fusing and were secured to the mold surface. The location and size of the chills were selected without introducing excessive thermal stress in the steel casting.
4.2 Replacement of Standard Risers with Insulating Risers
In addition to the chills, I modified the riser system of the steel casting process. The conventional sand risers used in the initial design had a relatively high heat loss from their exposed surfaces. To improve the feeding efficiency, I replaced the ordinary top risers and side risers with insulating riser sleeves. An insulating riser reduces the heat transfer from the liquid metal to the surrounding sand, thereby keeping the riser molten for a longer time. This means that the riser can feed the steel casting more effectively without increasing the riser volume.
The modulus of an insulating riser can be increased virtually because the effective heat loss coefficient is lower. In mathematical terms, the effective modulus \(M_{r,\text{eff}}\) of the riser is:
\[
M_{r,\text{eff}} = \frac{V_r}{A_e/\beta}
\]
where \(\beta\) is the insulating efficiency factor. For the insulating sleeve used in my optimized steel casting process, \(\beta\) was approximately 1.8. This allowed the side riser diameter to be reduced slightly while still maintaining adequate feeding capacity. The final optimized riser dimensions are given in Table 6.
| Location | Riser type | Diameter / mm | Height / mm | Insulating sleeve |
|---|---|---|---|---|
| End flanges | Insulated cylindrical top riser | 120 | 180 | Yes |
| Reinforcing ribs | Insulated side riser | 140 | 280 | Yes |
4.3 Final Optimized Steel Casting Layout
The optimized three-dimensional model of the steel casting process was created by adding the chills and modifying the riser sleeves. The overall geometrical arrangement remained the same as the initial design, with two steel casting beams sharing one side riser. The choke of the gating system was unaltered, because the filling simulation of the initial steel casting process had shown acceptable filling behavior. Only the solidification-related parameters were changed. The complete optimized model was again meshed in View Cast with the same two-million-cell grid to ensure that differences in the results were caused by the process modifications and not by numerical artifacts.
5. Simulated Performance of the Optimized Steel Casting Process
5.1 Filling Simulation of the Optimized Steel Casting
I first repeated the filling simulation for the optimized steel casting process. Table 7 summarizes the filling progress. At \(t = 0.7\ \text{s}\), the liquid steel first entered the mold cavity through the ingates. At \(t = 8.1\ \text{s}\), the gating system and the main lower section of the steel casting beam were completely filled. At \(t = 12.7\ \text{s}\), the liquid steel reached the top of the risers, and the entire mold cavity was filled.
| Time / s | Filling state |
|---|---|
| 0.7 | Liquid steel starts to enter the casting cavity |
| 8.1 | Casting cavity and gating system largely filled |
| 12.7 | Mold and risers completely filled |
The simulated filling front was smooth and continuous. There was no obvious jetting, air aspiration, or surface turbulence. The filling behavior satisfied the requirements of rapid and stable pouring for a steel casting. The gating system was therefore considered suitable for the optimized process, and no further changes were necessary.
5.2 Solidification Simulation of the Optimized Steel Casting
After the filling simulation, I analyzed the solidification of the optimized steel casting process. Table 8 lists the key solidification events. At \(t = 158\ \text{s}\), the edge regions of the steel casting beam had begun to solidify, and the areas in contact with the chills cooled much faster than the surrounding parts. At \(t = 338\ \text{s}\), the gating system had completely solidified. At \(t = 458\ \text{s}\), the chilled regions had formed continuous solidified shells, dividing the steel casting into several smaller isolated liquid pools. Each pool was connected to its own riser. At \(t = 1148\ \text{s}\), the end flanges had solidified, but the top risers still contained liquid steel. At \(t = 1478\ \text{s}\), the top risers were completely solidified, and two small isolated liquid zones remained inside the side risers. Finally, at \(t = 1598\ \text{s}\), these last liquid zones solidified inside the risers rather than inside the steel casting beam.
| Time / s | Observed event in the optimized steel casting |
|---|---|
| 158 | Edge and chill zones begin to solidify |
| 338 | Gating system completely solidified |
| 458 | Solidified shells divide the casting into feeding zones |
| 1148 | End flanges and top risers almost solidified |
| 1478 | Top risers solidified; side risers contain final liquid pools |
| 1598 | Final liquid solidifies inside risers |
This solidification sequence clearly showed that the optimized steel casting process achieved the desired directional solidification. The last remaining liquid metal was always located in the riser system, never in the load-bearing section of the steel casting beam. The chills successfully shortened the solidification time of the central thin-wall regions, preventing the formation of isolated shrinkage zones. The insulating risers kept the feeding metal liquid for a sufficient period, allowing complete feeding of the steel casting.
5.3 Defect Prediction of the Optimized Steel Casting
Figure 3 shows the predicted shrinkage cavities and porosity in the optimized steel casting simulation. The comparison between the initial and optimized processes is summarized in Table 9. In the initial steel casting design, significant shrinkage porosity was predicted in the middle of the beam and at the riser necks. In the optimized design, those internal defects disappeared. A very small amount of surface porosity remained at the bottom of the steel casting beam, but this was not considered critical because it could be removed or repaired by grinding and welding during subsequent machining. The optimized steel casting process was therefore accepted as the final production solution.
| Region of the steel casting | Initial process | Optimized process |
|---|---|---|
| Central thin-wall section | Shrinkage porosity present | No internal defect |
| Riser neck / rib junction | Shrinkage cavity present | No internal defect |
| End flanges | Minor porosity at surface | Minor surface porosity only |
6. Production Validation of the Optimized Steel Casting Process
After completing the numerical simulations, I transferred the optimized steel casting process to the foundry floor. The mold was prepared with self-hardening sodium silicate sand. Chills were placed according to the optimized model, and insulating riser sleeves were installed at both the top riser positions and the side riser positions. The steel was melted and refined to meet the chemical specification of ZG270-500. After tapping, the liquid steel was poured into the mold at 1550 °C. The pouring time was approximately 13 seconds, which agreed well with the simulated filling time. The actual as-cast steel casting beam is shown in the photograph below.
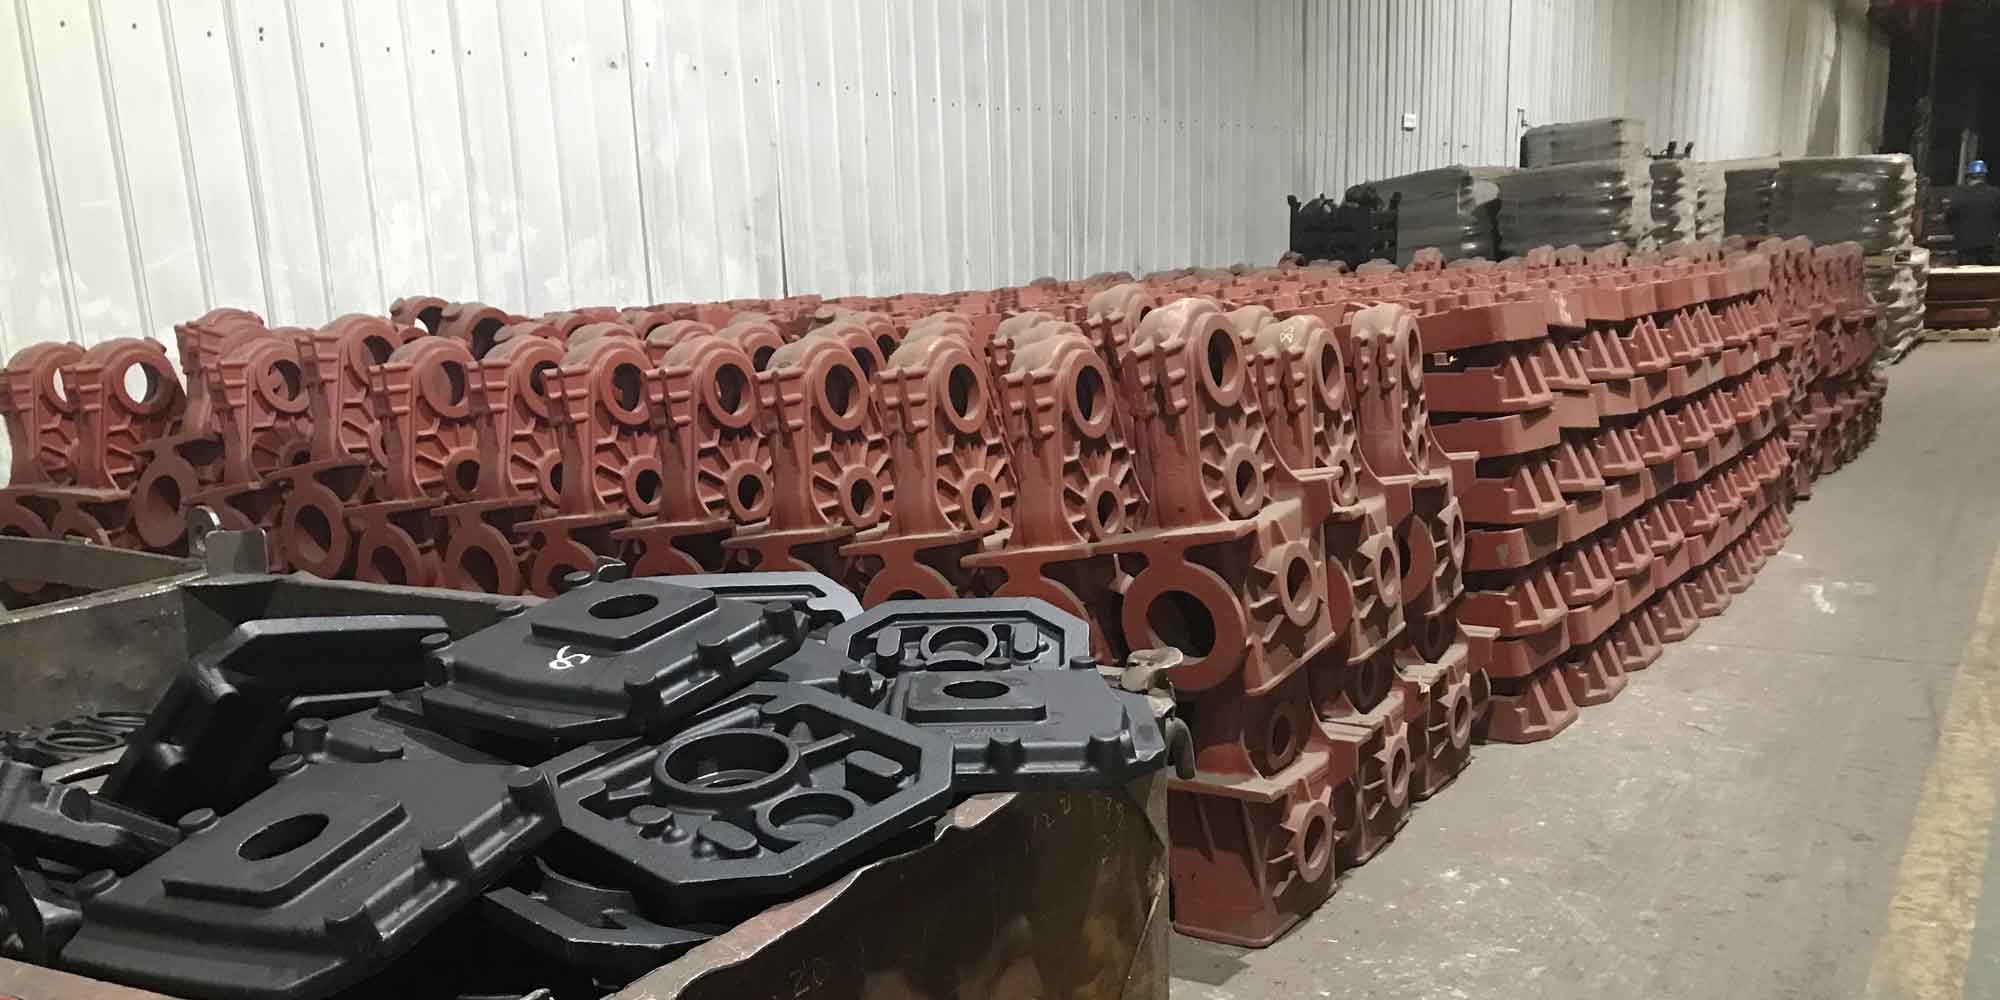
The first production batch produced several steel casting beam castings. After shakeout and sand cleaning, I inspected the external surfaces of the steel castings. The surfaces were smooth, and no visible cracks or cold shuts were found. The gating system was cut off, and the feeding areas were ground. The steel casting beam was then subjected to ultrasonic testing according to the MC2000 specification. The ultrasonic test result was extremely satisfactory: no significant internal shrinkage cavities or porosity were detected in the load-carrying sections of the steel casting. This confirmed that the optimized riser and chill layout had successfully eliminated the defects that had been predicted in the initial design.
6.1 Hardness and Mechanical Property Evaluation
In order to quantitatively assess the quality of the steel casting beam, I removed samples from the attached test blocks that were cast together with the steel casting. These test blocks were produced under exactly the same thermal conditions as the main steel casting. I conducted Rockwell hardness measurements at five different positions on the polished samples. Table 10 lists the measured hardness values. The individual values were 50, 47, 53, 52, and 52 HRC, with an average hardness of 50.8 HRC. The hardness uniformity was reasonably good, and the average value satisfied the technical requirement for the steel casting grade.
| Test point | 1 | 2 | 3 | 4 | 5 | Average |
|---|---|---|---|---|---|---|
| Hardness / HRC | 50 | 47 | 53 | 52 | 52 | 50.8 |
Hardness is only one indicator of the mechanical performance of a steel casting. In this project, the tensile strength and yield strength were not directly measured, but the hardness result was consistent with the expected strength level of a medium-carbon steel casting. The hardness variation between the test positions was within an acceptable range, which indicated that the cooling rate did not differ excessively from one region of the steel casting beam to another. The chill placement did not create severe hard spots or cracks in the steel casting.
6.2 Microstructural Examination of the Steel Casting
For further verification, I prepared metallographic specimens from the test block of the steel casting beam. The samples were ground, polished, and etched with 4% nitric acid in alcohol. Figure 4 shows the typical microstructure observed under an optical microscope. The steel casting exhibited the normal structure of a hypoeutectoid carbon steel. The light-colored phase was ferrite, and the darker lamellar constituent was pearlite. I also observed a proportion of acicular ferrite that grew into the prior austenite grain boundaries, forming a typical Widmanstätten structure. This structure appears in many steel castings because the as-cast austenite grains are relatively coarse, and the cooling rate during transformation is sufficiently fast to produce ferrite plates along certain crystallographic planes.
The presence of Widmanstätten ferrite can reduce the ductility and impact toughness of a steel casting. Since the steel casting beam is a structural component required to carry dynamic loads, I recommended a normalizing heat treatment after cutting off the risers. The normalizing temperature should be about 850–900 °C, followed by cooling in still air. Such a heat treatment refines the austenite grains and transforms the Widmanstätten structure into a more equiaxed ferrite-pearlite structure. The resulting steel casting would then possess improved tensile ductility, impact toughness, and resistance to brittle fracture.
6.3 Casting Yield and Economic Considerations
Another important indicator of a steel casting process is the casting yield, which is the ratio of the casting mass to the total poured mass. For the optimized steel casting beam process, I calculated the mass of the finished casting and the total mass of poured steel, including the gating system, risers, and feeders. The casting yield of the optimized process was approximately 72%. This value is quite good for a medium-carbon steel casting with long horizontal risers. The use of insulating sleeves was particularly beneficial because it increased feeding efficiency without adding more riser metal. The reduction in shrinkage defects also reduced the amount of welding repair and increased the productivity of the foundry.
From an economic point of view, the numerical simulation approach saved a significant amount of time and material. In the conventional development path, a foundry engineer would have poured a test mold of the initial steel casting design, discovered the shrinkage defects by cutting and etching, and then modified the riser system by trial and error. Each iteration would require another mold and another heat of steel. In my project, the View Cast simulation identified the critical defect regions before the first production mold was poured. I was able to move directly from the initial design to the optimized design without wasting expensive alloy steel. The only additional costs were the chills and the insulating sleeves, which were relatively small compared with the savings in steel, labor, and machining time.
7. Discussion of Simulation Accuracy and Limitations
Although the numerical simulation of the steel casting beam was successful, I am aware of its limitations. The accuracy of a casting simulation depends strongly on the accuracy of the thermal and physical property data. In my model, I used the default material database in View Cast for a medium-carbon steel casting. The actual properties of the steel may vary slightly because of differences in melt chemistry, pouring temperature, and mold moisture. I therefore used conservative safety margins in the riser design and in the chill dimensions. The good agreement between the simulated defect distribution and the actual ultrasonic inspection results confirmed that the material data were sufficiently accurate for engineering purposes.
The heat transfer coefficient at the casting-mold interface is another important factor. During the initial stage of filling, a thin air gap forms because of the solidification contraction of the steel casting. This gap reduces the heat flux across the interface. In my simulation, I used a constant interface heat transfer coefficient. In reality, this coefficient changes as the gap grows and as the mold surface heats up. A more advanced simulation would use a temperature-dependent and pressure-dependent interface model. However, the constant coefficient still provided a reliable prediction of the general solidification pattern in the steel casting beam, particularly for the riser and chill placement.
The simulation also assumed that the mold was filled at a constant flow rate. In an actual bottom-pour ladle, the pouring rate depends on the nozzle geometry and the ferrostatic height in the ladle. Minor differences between the simulated filling sequence and the actual pouring process can affect the initial temperature distribution in the steel casting. Nevertheless, the final solidification sequence and the defect pattern are mainly governed by the thermal modulus and the riser design, so the conclusions of the optimization remain valid.
8. Conclusions
In this project, I successfully combined conventional casting design methods with View Cast numerical simulation to develop an optimized sand casting process for a steel casting beam. The initial steel casting design, produced by conventional modulus calculations and standard gating rules, displayed a risk of shrinkage porosity in the central section and at the riser necks. Through numerical simulation, I identified the exact locations of these potential defects and understood that the feeding distance of the side risers was insufficient for the long steel casting beam.
The optimized steel casting process used steel chills to create additional cooling zones along the beam and insulating sleeves to improve the feeding efficiency of the risers. Simulation of the optimized process showed a smooth filling sequence and a directional solidification pattern in which the final liquid remained in the risers. The predicted internal shrinkage defects were eliminated. After transferring the optimized process to production, the actual steel casting beam passed ultrasonic testing without significant internal defects. Hardness testing gave an average value of 50.8 HRC, which met the technical requirements. Metallographic examination showed a typical as-cast ferrite-pearlite structure with some Widmanstätten ferrite, and I recommended normalizing to improve ductility and impact toughness.
The casting yield of the optimized steel casting process reached approximately 72%. This represents a substantial improvement compared with the initial unmodified design, which would have required defects to be repaired or the casting to be scrapped. The project demonstrates that numerical simulation is an indispensable tool for modern steel casting process development. It allowed me to reduce the number of physical trials, shorten the design cycle, and improve the overall quality of the steel casting beam. In future work, I plan to use the same workflow for other steel casting components with more complex geometries, including differential cooling, multiple riser interactions, and heat treatment optimization. This systematic approach will continue to improve the efficiency and reliability of steel casting production in the foundry industry.