
1. Introduction
The manufacturing of steel castings has a long history and a relatively mature production technology. However, the casting process is influenced by numerous process parameters that interact with one another. If any parameter deviates beyond a certain range, the quality of the steel casting will be affected. As a result, obtaining an optimal process for a specific steel casting remains a challenging task. In actual production environments, particularly during the initial stages of producing a new steel casting, various defects often appear even after repeated process trials. This inevitably increases production costs and extends delivery times. This challenge is especially prominent in the current global environment of overcapacity and intense competition among foundries.
The BOSS component at the root of the excavator arm is the connecting part between the large arm and the frame. It is welded to the arm at one end and connected to the frame through a pin at the other end. Before the localization of excavator production, the BOSS was imported from Japan. After localization, it was initially manufactured by welding two forgings with a steel tube. Considering the lower cost of steel castings compared with forgings, the forged parts were later replaced by castings, but the assembly method remained unchanged. However, during the operation of the excavator, the large arm root BOSS bears significant alternating loads in various directions, leading to a considerable risk of cracking in the weld seams.
To reduce this risk, our factory agreed with the excavator manufacturer to adopt a one-piece steel casting for the BOSS. This approach eliminates the welding step and reduces the probability of weld seam cracking. However, the BOSS steel casting is a thin-walled part with a minimum wall thickness of 15 mm and a maximum of 52 mm, which creates substantial differences in wall thickness. The technical requirements are stringent, as surface fluorescent magnetic particle inspection must not reveal linear defects larger than 2 mm. Therefore, the overall casting difficulty is considerable. Additionally, the factory originally used carbon dioxide hardened sodium silicate sand for molding. While this material offers good control over surface micro-cracks and low cost, the removal of sodium silicate sand is difficult. Especially for the BOSS, if the sand in the middle shaft hole is not completely cleaned, it can greatly reduce the service life of the product and become a quality hazard for the excavator.
Through preliminary analysis and communication with the original manufacturer, it was learned that when conventional casting processes were used, cracks appeared at the root of the BOSS steel casting, and the sand in the shaft hole was difficult to remove completely. Therefore, the conventional process could not be directly adopted. Typically, a new casting process for steel castings requires multiple physical trials before being put into practical application, which demands significant time and material costs. This conflicts with the factory’s requirements for cost saving and tight production schedules.
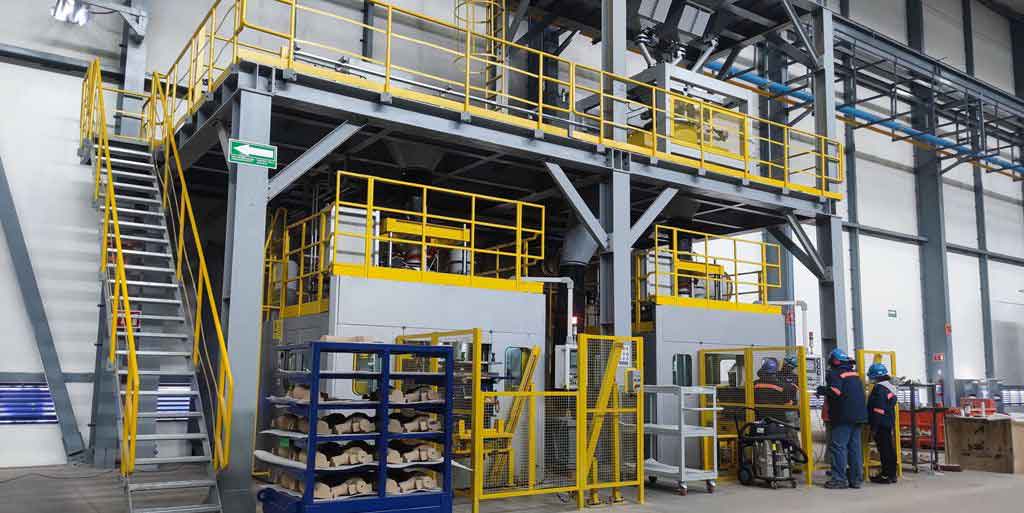
This thesis aims to investigate the casting process design for the BOSS steel casting by combining PROCAST numerical simulation with physical trial production. The research focuses on identifying the root cause of hot tears in steel castings under the conventional process, evaluating the impact of replacing the core material, and solving the difficult problem of sand removal in the shaft hole. The findings are expected to provide a scientific basis for process optimization of steel castings with complex geometries.
2. Technical Fundamentals
2.1 Mold Materials
Based on practical experience, the mold cavity for the BOSS steel casting is produced using sodium silicate-bonded silica sand, while the core is produced using limestone sand. Table 2.1 lists the chemical composition and technical parameters of the sodium silicate used.
Table 2.1 Chemical components and technical parameters of water glass
| Chemical Composition (%) | SiO₂ | Na₂O | Modulus (M) | Specific Gravity (20°C) |
|---|---|---|---|---|
| Value | 25–35 | 12–14 | 2.2–2.5 | 1.48–1.52 |
The modulus of sodium silicate is defined as the molar ratio of SiO₂ to Na₂O:
$$M = 1.033 \times \frac{\% \text{SiO}_2}{\% \text{Na}_2\text{O}} \quad (2.1)$$
When CO₂ gas is introduced into the sodium silicate-bonded sand mold, the following hardening reaction occurs:
$$\text{Na}_2\text{O} \cdot m\text{SiO}_2 \cdot n\text{H}_2\text{O} + \text{CO}_2 \rightarrow \text{Na}_2\text{CO}_3 + m\text{SiO}_2 \cdot n\text{H}_2\text{O} + \text{heat} \quad (2.2)$$
Sodium silicate sand exhibits poor collapsibility, which makes steel casting cleaning difficult. The residual strength of sodium silicate sand is mainly determined by the amount of glassy phase formed at high temperatures. The melting point of sodium silicate is 800–810°C. The molten silicate has low surface tension and can fill voids in the binder film, bonding sand particles into a strong agglomerate. This is the principal reason for the poor collapsibility.
Limestone sand, with calcium carbonate (CaCO₃) as its main component, decomposes upon heating:
$$\text{CaCO}_3 \rightarrow \text{CaO} + \text{CO}_2 \uparrow \quad (2.3)$$
The CO₂ released reacts with the steel at the mold interface:
$$\text{Fe} + \text{CO}_2 \rightarrow \text{FeO} + \text{CO} \uparrow \quad (2.4)$$
$$3\text{FeO} + \text{CO}_2 \rightarrow \text{Fe}_3\text{O}_4 + \text{CO} \uparrow \quad (2.5)$$
$$2\text{Fe}_3\text{O}_4 + \text{CO}_2 \rightarrow 3\text{Fe}_2\text{O}_3 + \text{CO} \uparrow \quad (2.6)$$
The limestone sand core creates a thick iron oxide layer on the steel casting surface, which facilitates sand removal and prevents burn-on. The thermal expansion of limestone sand is only about one-third that of silica sand, and its collapsibility is considerably better. However, limestone sand produces more gas during pouring, requiring careful venting design. The gas evolution per gram of limestone sand is approximately 40–50 mL.
Table 2.2 compares the characteristics of limestone sand and silica sand as mold materials for steel castings.
Table 2.2 Comparison of limestone sand and silica sand
| Property | Silica Sand | Limestone Sand |
|---|---|---|
| Free SiO₂ content | High (≥98%) | Low (~2%) |
| Thermal expansion | High | Low (1/3 of silica) |
| Collapsibility | Poor | Good |
| Gas evolution | Low | High |
| Surface finish of steel castings | Possible burn-on | Clean surface |
| Occupational health hazard | Silicosis risk | Minimal |
2.2 Crack Defects in Steel Castings
Cracks are among the most common and serious defects in steel castings. They significantly impair the service performance of the component. According to the temperature range of formation and the appearance characteristics, cracks can be divided into hot tears, cold cracks, warm cracks, and cracks in thick sections.
Hot tears are distinguished by their dark, rough, and irregular appearance. They typically result from intergranular fracture at temperatures near the solidus. Since hot tears form at elevated temperatures and are exposed to oxidizing atmospheres, their fracture surfaces are covered by a dark brown or black oxide layer. Hot tears can be further classified into external and internal types, depending on their location in the steel casting.
Two principal mechanisms explain the formation of hot tears: the strength theory and the liquid film theory.
A. Strength Theory
According to the strength theory, when the crystal skeleton is formed and begins to shrink linearly during the late stage of solidification, resistance to contraction generates stress or plastic deformation in the steel casting. If this stress or strain exceeds the ultimate strength or elongation of the alloy at that temperature, cracking occurs. Hot tears generally appear at hot spots in the steel casting where solidification is last to complete, such as at the transition between thick and thin wall sections.
B. Liquid Film Theory
The liquid film theory considers that near the solidus temperature, a thin liquid film surrounds the solid grains. During solidification shrinkage, if the film is stretched beyond a critical limit, it tears, forming a hot tear. The film becomes thinner as the temperature approaches the solidus, increasing the risk of tearing.
Regardless of the theoretical perspective, hot tears in steel castings result from contraction being hindered during the solidification process, leading to stress exceeding the material’s strength at that temperature.
For steel castings, the factors influencing hot tear formation include:
- Properties of the molten steel, such as composition, the effective solidification range, initial crystal structure, fluidity, segregation, and the presence of inclusions.
- The resistance from the mold and core. Better collapsibility of the mold reduces the hindrance to contraction of steel castings.
- The structural design of the steel casting, including wall thickness transitions and fillet radii.
- The placement of ingates and risers, which may create local hot spots or hinder contraction.
The effective solidification range is given by:
$$\varepsilon = \alpha \times \left( t_{\text{start}} – t’_{\text{solid}} \right) \quad (2.7)$$
where \(t_{\text{start}}\) is the temperature at which linear contraction begins, \(t’_{\text{solid}}\) is the non-equilibrium solidus temperature, and \(\alpha\) is the average linear contraction coefficient in the effective solidification range.
For preventing hot tears in steel castings, effective measures include improving the collapsibility of the mold and core, optimizing gating and risering systems, reducing sulfur and phosphorus content, using chillers properly, and adding process ribs where necessary.
2.3 Stress Field Simulation of Gravity Casting with PROCAST
The stress generated during the solidification and cooling of steel castings can be divided into thermal stress, phase transformation stress, and mechanical hindrance stress. Thermal stress arises from uneven cooling and contraction of different regions of the steel casting at different times. It is one of the most important causes of hot tearing.
The solidification process of steel castings is essentially a thermo-mechanical coupled process. The heat transfer and stress development interact with each other, as shown in the schematic representation below.
In the thermo-mechanical coupling analysis, the thermal field is first solved, and the resulting temperature distribution is then used as a thermal load for the stress analysis. The stress analysis may also affect the heat transfer through the formation of an air gap at the casting/mold interface. This coupling is schematically represented as:
$$\text{Temperature field} \rightleftharpoons \text{Stress/Strain field}$$
For the stress analysis, PROCAST uses the thermo-elastic-plastic model. The total strain rate is decomposed into elastic, plastic, and thermal components:
$$\dot{\varepsilon}_{\text{total}} = \dot{\varepsilon}_{\text{elastic}} + \dot{\varepsilon}_{\text{plastic}} + \dot{\varepsilon}_{\text{thermal}} \quad (2.8)$$
The linear hardening model is expressed as:
$$\sigma = \sigma_0 + H \varepsilon_{\text{pl}} \quad (2.9)$$
where \(\sigma_0\) is the yield stress, \(\varepsilon_{\text{pl}}\) is the plastic strain, and \(H\) is the plastic modulus.
PROCAST employs the Niyama criterion to predict shrinkage porosity in steel castings. The Niyama criterion is defined as:
$$Niyama = \frac{G}{\sqrt{R}} \quad (2.10)$$
where \(G\) is the local temperature gradient and \(R\) is the cooling rate. For steel castings, when Niyama < 6.19–8.52 (K·s)^(1/2)/cm, micro-porosity is likely to form. When the value is larger, macro-shrinkage tends to occur.
For hot tear prediction, PROCAST provides a Hot Tearing Indicator (HTI) based on the strain-driven model:
$$HTI = \int_{t_c}^{t_s} \dot{\varepsilon}_p \, dt \quad (2.11)$$
where \(t_c\) is the time when grains first come into contact, \(t_s\) is the time when the temperature reaches the solidus, and \(\dot{\varepsilon}_p\) is the plastic strain rate. Under identical conditions, a larger HTI value corresponds to a higher tendency for hot tears in the steel casting.
3. Casting Process Design for the BOSS Steel Casting
3.1 Component Requirements and Material
The BOSS component is shown in its product drawing in Figure 3.1. It is a slender part with a main length of 754 mm and a width of 171 mm, belonging to a thin-walled steel casting category.
The technical requirements for the BOSS steel casting are as follows:
- The steel casting shall be manufactured and accepted according to GB/T11352 “Carbon Steel Castings for General Engineering.”
- No cracks, slag inclusions, or gas porosity are permitted. Undefined casting fillets shall be R5–8.
- Hardness testing shall follow JIS Z2243 or JIS Z2245.
- Surface and near-surface fluorescent magnetic particle inspection shall be performed according to JIS G0565.
The casting material is KSC-C1528, and its chemical composition is given in Table 3.1.
Table 3.1 Chemical composition of the BOSS steel casting
| Element | C | Si | Mn | P | S | Ni | Cr | Cu | Al |
|---|---|---|---|---|---|---|---|---|---|
| Content (%) | 0.25–0.35 | 0.30–0.50 | 0.60–1.10 | ≤0.04 | ≤0.04 | <0.30 | <0.30 | <0.30 | ≤0.04 |
The composition of the BOSS steel casting is similar to that of ZG25, with a slightly higher manganese content. The pouring temperature range for this type of steel is approximately 1525–1575°C. The linear shrinkage is about 1.5–2.0%, and the solidification shrinkage is approximately 4.2%. Due to the higher casting stress and hot tearing tendency, the structural design of the BOSS steel casting was optimized by increasing the transition radius and adjusting the riser position.
3.2 Quality Standards and Inspection Methods
Table 3.2 Quality standard, detection methods and means of BOSS casting
| Inspection Item | Inspection Standard | Method/Instrument |
|---|---|---|
| Chemical composition | JIS G0321 | Spectrometer PDA-500S |
| Surface quality | JIS G0588 | Visual inspection |
| Dimensions | JIS B0403, CT10 | Tape measure, calipers |
| Roughness | External ≤100S, target 70S; internal ≤100S, target 140S | Visual |
| Hardness | JIS Z2243 / Z2245 | HBC hammer hardness tester |
| Crack inspection | JIS G0565 | Fluorescent magnetic particle testing (MT) |
3.3 Gating System and Parting Line Design
The design of the gating system for the BOSS steel casting must ensure directional solidification toward the risers. The ingate was positioned so that the molten steel flows toward the riser, allowing effective feeding. The gating system is illustrated in the process scheme for the BOSS steel casting.
For ease of molding and core setting, a flat parting line was selected. The BOSS steel casting has two ear sections with protruding branches, requiring side cores. The shaft hole core was designed with a locating head to prevent rotation during assembly.
The shrinkage allowance was set to 2.0% for most dimensions. However, the distance between the two ears was not given shrinkage allowance to avoid dimensional deviation caused by mold resistance to contraction. The machining allowance was designed as +7 mm on the top surface and +5 mm on the bottom and side surfaces. The draft angle was set at 2° to facilitate pattern removal.
3.4 Riser Design
According to the principle of directional solidification for steel castings, risers were placed at the thick sections connected to the ears. A cylindrical riser with a diameter of 150 mm and a height of 300 mm was initially designed to provide sufficient feed metal and adequate pressure head for feeding. The riser placement is shown in Figure 3.5.
3.5 Chill Design and Process Schemes
The material composition of the BOSS steel casting exhibits significant casting stress, partly due to the uneven wall thickness. Based on conventional practice, an external chill was placed at the thick section. Table 3.3 lists the three chill schemes designed for the numerical simulation experiments.
Table 3.3 Chill setting schemes
| Scheme | Chill location | Chill dimensions (mm) | Description |
|---|---|---|---|
| Scheme 1 | Bottom of casting | 32 × 40 × 750 | One large continuous chill, similar to the original supplier’s process |
| Scheme 2 | Bottom thick sections | 32 × 30 × 120 | Two separate small chills, thickness equal to 0.5 times the casting wall thickness |
| Scheme 3 | No chill | — | No external chill used |
In all three schemes, the mold and core materials were initially sodium silicate-bonded silica sand for investigating the influence of the chill on hot tears in the steel casting.
3.6 Mold Materials for the BOSS Steel Casting
For the production of the BOSS steel casting, the cavity was produced using sodium silicate-bonded silica sand, while the shaft hole core was produced using limestone sand for improved collapsibility. The composition and technical parameters of these materials are listed in Tables 3.4 to 3.7.
Table 3.4 Silica sand used in molding (GB/T 9442-2010)
| Property | SiO₂ (wt%) | Al₂O₃ | Fe₂O₃ | CaO+MgO | K₂O+Na₂O |
|---|---|---|---|---|---|
| Value | ≥98 | <1.0 | <0.3 | <0.2 | <0.5 |
Table 3.5 Limestone raw sand
| Property | Grain size | SiO₂ | CaO+MgO | MgO |
|---|---|---|---|---|
| Value | 40/70 mesh | <6% | ≥45% | 3–5% |
Table 3.6 Composition and technical parameters of CO₂-sodium silicate sand
| Mass fraction (%) | Grain size | Sodium silicate | Water | Wet permeability | Wet compressive strength (kPa) |
|---|---|---|---|---|---|
| Value | 40/70 | 6.5–7.5 | 4.5–5.5 | >300 | 5–15 |
Table 3.7 Composition and technical parameters of CO₂ hardened limestone sand
| Mass fraction (%) | Limestone sand | Sodium silicate | Na₂CO₃ | Moisture | Permeability | Wet compressive strength (kPa) | Dry tensile strength (kPa) | Mixing time (min) Dry / Wet |
|---|---|---|---|---|---|---|---|---|
| Value | 100 | 7–8 | 0.1–0.2 | 4.5–5.5 | ≥400 | 5–15 | >6 | 1–2 / 5–6 |
3.7 Process Flow and Parameters
The molding process for the BOSS steel casting includes: molding, core making, drying, mold assembly, pouring, cooling, shakeout, and heat treatment. Key parameters include:
- Coating: FOSECO-300
- Drying: gas flame baking for 5 minutes before mold closing
- Mold temperature: ambient (20°C)
- Pouring: gravity pouring under atmospheric pressure
- Pouring temperature: 1565°C
- Pouring time: 25 seconds (9.5 kg/s)
- Cooling: natural cooling in the mold for at least 6 hours
- Cleaning: manual cleaning
- Heat treatment: normalizing at 880 ± 10°C for 2 hours
4. Numerical Simulation of the BOSS Steel Casting Process
4.1 Finite Element Model and Boundary Conditions
The three-dimensional solid model of the BOSS steel casting and the mold was created in SolidWorks and converted to the IGES format for import into PROCAST. Mesh generation was performed using the MeshCAST module. Areas with high gradients in the simulation data, such as the casting, chill, and gating/riser systems, were assigned a mesh size of 10 mm, while the mold was assigned a coarser mesh size of 40 mm. The total number of elements was 830,843.
The temperature-dependent material properties of the steel casting are shown in Table 3.8 and Figure 3.10.
Table 3.8 Data of the BOSS steel casting used in numerical modeling
| Property | Value / Description |
|---|---|
| Liquidus temperature | 1501.1°C |
| Solidus temperature | 1142.8°C |
| Thermal conductivity | Temperature-dependent (Figure 3.10a) |
| Density | Temperature-dependent (Figure 3.10b) |
| Enthalpy | Temperature-dependent (Figure 3.10c) |
| Solid fraction | Temperature-dependent (Figure 3.10d) |
| Viscosity | Temperature-dependent (Figure 3.10e) |
| Thermal expansion coefficient | Temperature-dependent (Figure 3.10f) |
| Young’s modulus | Temperature-dependent (Figure 3.10g) |
| Poisson’s ratio | Temperature-dependent (Figure 3.10h) |
| Yield stress | Temperature-dependent (Figure 3.10i) |
The heat exchange coefficient at the casting/mold interface was set to 300 W/(m²·K) for general contact, and 2000 W/(m²·K) for the casting/chill interface.
Table 3.9 lists the key simulation parameters.
Table 3.9 Other parameters used in the simulation experiment
| Parameter | Value |
|---|---|
| Pouring temperature | 1565°C |
| Pouring time | 25 s (9.5 kg/s) |
| Initial mold temperature | 20°C |
| Ambient temperature | 20°C |
| Interface heat transfer coefficient (silica mold / silica core) | 300 W/(m²·K) |
| Interface heat transfer coefficient (silica mold / limestone core) | 300 W/(m²·K) |
| Interface heat transfer coefficient (casting / chill) | 2000 W/(m²·K) |
| Calculation termination temperature | 1132.8°C |
Table 3.10 Key calculation parameter settings in PROCAST
| Category | Parameter | Value | Description |
|---|---|---|---|
| General | TSTOP | 1132.8°C | Computation stop temperature |
| General | DTMAX | 5 s | Max time step |
| Thermal | MACROFS | 0.7 | Max solid fraction for liquid feeding |
| Thermal | PIPEFS | 0 | Feeding channel closure threshold |
| Thermal | NIYAMA | 0.9 | Shrinkage porosity criterion |
| Flow | FREESF | 2 | Free surface model for gravity-controlled slow filling |
| Flow | LVSURF | 1 | Threshold for switching from flow to thermal analysis |
| Stress | CRITFS | 0.5 | Solid fraction at which stress calculation begins |
5. Results and Discussion of Numerical Simulation
5.1 Mold Filling and Solidification Analysis
Taking Scheme 1 as an example, the mold filling of the BOSS steel casting was analyzed. The filling sequence is shown in Figure 4.1. The molten steel filled the mold cavity in a stable manner. However, the gas enclosed at the ear sections of the BOSS steel casting could potentially create defects. Therefore, vent holes were required at the ear areas to allow gas to escape.
Figure 4.2 shows the filling time distribution, and Figure 4.3 depicts the gas pressure distribution. Regions of gas entrapment were identified at the upper parts of the ears. In actual production, vent holes were designed in these areas to prevent gas porosity and incomplete filling.
Figure 4.4 shows the temperature distribution and solid fraction at 1206 seconds after pouring. The risers effectively fed the thick sections of the steel casting, and the temperature distribution followed a directional solidification pattern toward the risers.
Figure 4.5 presents the macro-shrinkage prediction. The shrinkage defects were mainly concentrated at the upper part of the riser, with some micro-shrinkage at the bottom of the riser in the casting body. Though the liquid metal in the riser could feed the region under gravity, the fluidity was limited when the solid fraction exceeded 70%. Therefore, the riser modulus might need to be increased, or chilling measures could be adopted.
Using the Niyama criterion (Niyama < 7.0), the micro-porosity distribution was predicted, as shown in Figure 4.6. The middle thin-wall region of the BOSS steel casting showed some micro-porosity, but the porosity level did not exceed 2%. This is due to the large solidification range of the casting material (358°C between liquidus and solidus), where the dendritic skeleton hinders feeding of the residual viscous liquid.
5.2 Comparison of Simulation Results for the Three Chill Schemes
Table 5.1 summarizes the simulation results for the three chill schemes.
Table 5.1 Data of filling and solidification for the three chill schemes
| Data Item | Silica core / One chill | Silica core / Two chills | Silica core / No chill |
|---|---|---|---|
| Total process time (s) | 5154 (1 h 25 min) | 5290 (1 h 28 min) | 5327 (1 h 29 min) |
| Filling time (s) | 24.27 | 24.25 | 24.14 |
| Average solidified fraction at end of filling (%) | 15.1 | 11.3 | 11.5 |
| Complete solidification time (s) | 4916 (1 h 22 min) | 5019 (1 h 24 min) | 5040 (1 h 24 min) |
| Maximum chill surface temperature (°C) | 1178.3 (at 84% solidification) | 1257.0 (at 78% solidification) | — |
| Maximum core surface temperature (°C) | 1420.8 (at 85% solidification) | 1421.1 (at 87% solidification) | 1594.7 (at 32% solidification) |
The total process time includes the time from the start of pouring to when the casting cools to 1132.8°C. Scheme 1, with the larger chill, cooled somewhat faster. However, the average solidified fraction at the end of filling was 15.1% for Scheme 1, which was higher than for the other schemes. A higher solidified fraction at the end of filling indicates greater risk of cold shut or misrun. The core surface temperature in Scheme 3, without any chill, reached a maximum of 1594.7°C when the casting was only 32% solidified. Such a high temperature increases the risk of metal penetration and burn-on. Therefore, if Scheme 3 were used, a coating should be applied to the core surface, especially at the thick sections at both ends of the shaft hole.
5.3 Hot Tear Prediction for the Three Chill Schemes
Using the liquid film theory-based Hot Tearing Indicator (HTI), the hot tear risk in the BOSS steel casting was evaluated when the local solidified fraction reached 99%. Figure 4.7 shows the potential hot tear locations. Table 5.2 lists the maximum HTI values and stress components at the potential crack locations.
Table 5.2 Maximum hot tearing indicator and stress at potential crack zones
| Data Item | Silica core / One chill | Silica core / Two chills | Silica core / No chill |
|---|---|---|---|
| HTI | 0.0042 | 0.0029 | 0.0030 |
| Equivalent stress σ (MPa) | 234.3 | 199.2 | 210.8 |
| σₓ (MPa) | 29.1 | 6.3 | 2.0 |
| σᵧ (MPa) | 316.5 | 150.4 | 222.6 |
| σ_z (MPa) | 19.2 | 25.1 | 11.8 |
For Scheme 1, the maximum HTI was predicted to locate at the wall thickness transition zone, close to the chill. The σᵧ component (along the length direction of the casting) was significantly larger than the other components, indicating that a hot tear in this location would likely propagate perpendicular to the axial direction. This prediction is consistent with the crack observed in the original production of the BOSS steel casting.
Comparing the three schemes, Scheme 2 and Scheme 3 exhibited significantly lower hot tearing tendencies than Scheme 1. The large continuous chill in Scheme 1 generates a larger friction resistance at the casting/chill interface. Furthermore, the simultaneous contraction of solidified and unsolidified sections in the wall thickness transition region, combined with the mechanical constraint of the sand core and mold, produces a higher stress level near the solidus temperature, increasing the risk of hot tears in the steel casting.
Adding chills accelerates the cooling of the thick sections and creates a larger temperature gradient between thick and thin regions. According to the strength theory, this promotes stress concentration and increases the hot tearing susceptibility. Moreover, chills often increase the risk of gas porosity. Therefore, for the BOSS steel casting, the use of chills at the thick sections is not recommended.
5.4 Influence of Limestone Sand Core on Casting Quality
Considering that the limestone sand core has higher thermal conductivity and specific heat capacity than the silica sand core, the effect of replacing the core material on the quality of the BOSS steel casting was investigated. Table 5.3 compares the simulation results between the silica sand core and the limestone sand core, both without a chill.
Table 5.3 Data contrast of two sand core types in casting filling and solidification
| Data Item | Silica sand core / No chill | Limestone sand core / No chill |
|---|---|---|
| Total process time (s) | 5327 (1 h 29 min) | 5205 (1 h 27 min) |
| Filling time (s) | 24.14 | 24.14 |
| Average solidified fraction at end of filling (%) | 11.5 | 11.2 |
| Complete solidification time (s) | 5040 (1 h 24 min) | 4936 (1 h 22 min) |
| Maximum core surface temperature (°C) | 1594.7 (at 32% solidification) | 1388.6 (at 87% solidification) |
The limestone sand core significantly reduced the maximum core surface temperature. This is because the higher thermal conductivity and specific heat of the limestone sand core allowed more heat to be absorbed from the shaft hole region and transferred to the mold. The lower core surface temperature reduces the risk of metal penetration and burn-on.
Table 5.4 summarizes the data at the extraction point when the average solid fraction of the casting reached 90%.
Table 5.4 Data summary at average solid fraction of 90%
| Data Item | Silica sand core | Limestone sand core |
|---|---|---|
| Solid fraction at extraction point (%) | 70.4 | 79.8 |
| Solidification temperature (°C) | 1466.1 | 1450.3 |
| Solidification time (s) | 3908.4 | 3410.9 |
| Thermal modulus (cm) | 1.550 | 1.502 |
The data indicate that the temperature distribution toward the riser increased progressively, confirming directional solidification. The higher solid fraction at the extraction point (79.8%) for the limestone sand core indicates better riser feeding efficiency compared to the silica sand core. The smaller thermal modulus also requires less feed metal, which is beneficial for riser design.
Table 5.5 compares the hot tearing prediction between the two core materials.
Table 5.5 Maximum HTI at potential crack zone after core material change
| Data Item | Silica sand core / No chill | Limestone sand core / No chill |
|---|---|---|
| HTI | 0.0030 | 0.0027 |
| Equivalent stress σ (MPa) | 210.8 | 179.0 |
| σₓ (MPa) | 2.0 | 0.7 |
| σᵧ (MPa) | 222.6 | 184.8 |
| σ_z (MPa) | 11.8 | 13.1 |
All values for the limestone sand core were lower than those for the silica sand core. This indicates that, under the same conditions, the use of the limestone sand core further reduces the hot tearing risk for the BOSS steel casting. The enhanced cooling capability of the limestone sand core reduces the size of the mushy zone and improves the solidification structure of the steel casting.
6. Physical Trial Verification and Process Improvement
6.1 First Physical Trial
Since the collapsibility of limestone sand is not within the scope of PROCAST simulation, physical trials were necessary to verify the simulation results. Four trial castings were produced, with two castings using silica sand cores and two using limestone sand cores. The trial parameters are listed in Table 6.1.
Table 6.1 Physical trial parameters
| Casting No. | Type of shaft core (1#) | Number of vent cords in core | Actual pouring temperature (°C) | Actual pouring time (s) |
|---|---|---|---|---|
| 1 | Silica sand core | 2 | 1561 | 24 |
| 2 | Silica sand core | 2 | 1554 | 26 |
| 3 | Limestone sand core | 4 | 1578 | 28 |
| 4 | Limestone sand core | 4 | 1569 | 27 |
The actual chemical composition of the castings is given in Table 6.2.
Table 6.2 Actual casting composition (%)
| C | Si | Mn | P | S | Cu | Cr | Ni |
|---|---|---|---|---|---|---|---|
| 0.30 | 0.41 | 0.85 | 0.02 | 0.01 | 0.25 | 0.23 | 0.25 |
During the first trial, no significant increase in gas evolution was observed from the core vents. In the actual cleaning process, the shaft hole sand of castings No. 1 and No. 2 was time-consuming and labor-intensive to remove, while the shaft hole sand of castings No. 3 and No. 4 was relatively easy to remove. Table 6.3 compares the sand cleaning time for the shaft holes of the BOSS steel castings.
Table 6.3 Comparison of sand cleaning time
| Casting No. | Type of shaft core (1#) | Cleaning time (min) |
|---|---|---|
| 1 | Silica sand core | 8 |
| 2 | Silica sand core | 11 |
| 3 | Limestone sand core | 4 |
| 4 | Limestone sand core | 3 |
The cleaning order was 1→3→2→4 to eliminate the influence of the worker’s skill differences and fatigue. The data show that the limestone sand core significantly improved the sand removal efficiency for the shaft hole of the BOSS steel casting.
After shot blasting, castings No. 3 and No. 4 exhibited clean internal cavities without burn-on. However, local burn-on was suspected in the shaft holes of castings No. 1 and No. 2. To confirm this, castings No. 1 and No. 2 were cut open. Upon re-shot blasting, burn-on was confirmed in the shaft hole area.
During machining of casting No. 3, gas porosity was found in the shaft hole. This was likely caused by the larger gas evolution of the limestone sand core. If the vent cords were compressed during molding, the effective venting area would be reduced, leading to gas entrapment. Thus, redesigning the venting system for the limestone sand core was necessary.
6.2 Revised Venting System for the Limestone Sand Core
In the second physical trial, all four castings were produced with limestone sand cores. Instead of vent cords, a 20 mm diameter through-hole was created along the axis of the shaft hole core. Corresponding through-holes were made in the mold to lead the gas out. Additionally, a 40 mm diameter vent hole was drilled at the highest point of the ears.
The castings produced in the second trial showed no gas porosity defects upon machining and dissection. The mechanical properties of separately cast test bars are listed in Table 6.4.
Table 6.4 Mechanical properties of separately cast test bars
| Yield strength (MPa) | Tensile strength (MPa) | Elongation (%) | Impact toughness (J/cm²) | Reduction of area (%) | Hardness (HB, normalized) |
|---|---|---|---|---|---|
| 325 | 570 | 25 | 37 | 26 | 197 |
The hardness of the castings, as measured by the HBC-type hammer hardness tester, was qualified.
6.3 Crack Evaluation under No-Chill Conditions
The four BOSS steel castings produced in the second physical trial passed the surface quality inspection, dimensional inspection, and fluorescent magnetic particle testing. No cracks were detected in any of the BOSS steel castings. The results confirm that the elimination of the chill is a reasonable approach for avoiding hot tears in the BOSS steel casting.
Based on the PROCAST simulation results, the factory no longer needed to conduct additional physical trials for the chill configuration of Scheme 2, which significantly shortened the process development cycle. The removal of the chill also reduced the casting cost, molding complexity, and labor intensity.
7. Conclusions and Outlook
7.1 Conclusions
By combining PROCAST numerical simulation with physical trial production, this thesis investigated the casting process design for the BOSS steel casting. The main conclusions are as follows:
- PROCAST numerical simulation is capable of assessing the feasibility of the casting process for the BOSS steel casting. It can reveal the rationality of the gating and riser system design, predict hot tearing tendency and location, and offer targeted assistance in solving practical problems.
- The root cause of crack generation in the original production process was the use of a large continuous external chill at the bottom of the steel casting. The combination of substantial friction resistance at the casting/chill interface, the interaction forces between solidified and unsolidified sections in the wall thickness transition region, and the mechanical constraint from the sand core and mold increased the risk of hot tearing near the solidus temperature.
- Because the hot tearing prediction and quality comparison under different process schemes were performed in advance using PROCAST, the physical trials did not need to explore the chill structure and layout again, thereby saving trial time and material costs.
- The collapsibility of limestone sand is superior to that of silica sand. For the shaft hole of the BOSS steel casting, which is difficult to reach with conventional cleaning tools, using a limestone sand core instead of a silica sand core facilitates shaft hole cleaning and more readily produces an inner cavity free of burn-on. However, greater attention must be paid to mold venting.
- The final process determined for the BOSS steel casting is: no external chill, limestone sand core in a silica sand mold, gravity casting at 1565°C pouring temperature, and 25 seconds pouring time.
7.2 Outlook
Casting formation is an extremely complex process with numerous factors influencing steel casting quality. This thesis only analyzed the chill at specific locations and the sand removal in the shaft hole of the BOSS steel casting. The influence of mold collapsibility on cracking cannot be directly represented by PROCAST. The database of PROCAST is not yet complete; in this study, the limestone sand core was simulated using zircon sand as a substitute. The final process still required physical trial verification. Furthermore, due to time limitations and the author’s capabilities, this research leaves room for further improvement. In the era of big data, computer-aided engineering in the field of casting will continue to accumulate knowledge across factories, countries, and language regions. Numerical simulation will become increasingly mature, allowing foundries to stand on the shoulders of giants and advance further.