
As a researcher in the field of materials science and engineering, I have dedicated my work to exploring the integration of traditional casting with additive manufacturing, specifically focusing on 3d sand printing for complex castings. The motivation for this research stems from the increasing demand for high-precision, lightweight, and geometrically intricate components in industries such as aerospace, defense, and automotive. Traditional sand casting methods face significant limitations when dealing with complex cavities, thin walls, and intricate internal channels, often requiring lengthy tooling production and manual core assembly. 3d sand printing technology, based on binder jetting, offers a digital, moldless approach that enables the direct fabrication of sand molds and cores, thereby reducing lead times and enhancing design freedom. However, several challenges remain, including lower strength compared to conventionally compacted molds, higher gas evolution, and insufficient permeability. Additionally, the low utilization of build volume in 3D printers necessitates systematic investigation into spatial arrangement and multi-cavity casting strategies to improve efficiency.
In this thesis, I systematically investigated the influence of spatial grid structures on the performance of 3D sand printing molds. I employed response surface methodology (RSM) to optimize the printing process parameters. Based on the optimized parameters, I designed and simulated the casting process for a thin-walled complex aluminum alloy housing, followed by experimental validation. Furthermore, I compared the microstructure and mechanical properties of ZL101A alloy castings produced by traditional molding and 3D sand printing molding. Finally, I proposed a “multiple pieces in one box” approach and optimized the spatial layout of different sand molds in the printer to maximize the sand utilization ratio. The complete technical route is illustrated by considering the connection between mold design, process simulation, and experimental verification.
1. Materials and Experimental Methods
The sand mold printing was performed on a DZ2000C binder jetting machine. The printing parameters were set as follows: layer thickness of 0.5 mm, a saturation level adjusted to achieve the desired binder content, and a print head speed calibrated for consistent droplet deposition. The raw sand used was silica sand with an AFS fineness of 85–95, containing less than 0.2% water and over 90% SiO2. Furan resin was used as the binder, and a sulfonic acid-based hardener was mixed with the sand prior to printing. Table 1 lists the key properties of the materials.
| Material | Parameter | Value |
|---|---|---|
| Silica sand | AFS | 85–95 |
| Clay content | 0.1–0.15% | |
| Moisture | ≤0.2% | |
| Bulk density | ≥1.3 g/cm³ | |
| Furan resin | Density | 1.12–1.18 g/cm³ |
| Viscosity | 5–20 mPa·s | |
| Hardener | Total acid | 25.5–26.5% |
| Density | 1.30–1.35 g/cm³ | |
| Free sulfuric acid | <2.5% |
For strength tests, standard cylindrical specimens (50 mm diameter × 50 mm height) were printed for compressive strength and permeability measurements, while rectangular bar specimens (151 mm × 11.2 mm × 11.2 mm) were used for flexural strength tests. For tensile strength, “8”-shaped specimens were printed. The gas evolution was measured using an SFL-IIS intelligent gas evolution tester at 850°C for 120 seconds. Permeability was tested on an STD-III apparatus. All tests were repeated five times and the averages were reported.
2. Optimization of Spatial Grid Structure Using Response Surface Methodology
The initial part of my research focused on the design of spatial grid structures inside the sand mold to reduce material usage, increase permeability, and control gas evolution. I introduced three geometric parameters: the hole structure (circular, square, or hexagonal), the gap size between grid features (wall thickness), and the structural size (nominal diameter or circumscribed diameter of the holes). Single-factor experiments were first conducted to establish the effect of each parameter on mold performance.
2.1 Single-Factor Effects
For the hole structure, I compared solid specimens with those having circular (diameter 5 mm), square (circumscribed diameter 5 mm), and hexagonal (circumscribed diameter 5 mm) cavities, with a constant gap of 3 mm. The results are shown in Table 2. Compared to the solid reference, the circular grid structure reduced compressive strength by 29.8%, flexural strength by 32.3%, gas evolution by 1.55 mL/g, and increased permeability by 123.9%. Among the three structures, circular holes gave the best overall performance.
| Structure | Compressive strength (MPa) | Flexural strength (MPa) | Gas evolution (mL/g) | Permeability |
|---|---|---|---|---|
| Solid | 4.726 | 2.687 | 12.35 | 104.3 |
| Circular | 3.316 | 1.818 | 10.80 | 233.5 |
| Square | 3.144 | 1.621 | 10.89 | 231.6 |
| Hexagonal | 2.769 | 1.474 | 11.01 | 220.5 |
Next, I varied the gap size from 1 to 5 mm while keeping the hole structure circular and the size constant at 5 mm. As shown in Table 3, increasing the gap size increased both compressive and flexural strength, because more binder was deposited to form thicker walls. However, gas evolution increased and permeability decreased. The rate of change slowed beyond 3 mm. Therefore, a gap size of 3 mm was selected as the center point for subsequent optimization.
| Gap (mm) | Compressive strength (MPa) | Flexural strength (MPa) | Gas evolution (mL/g) | Permeability |
|---|---|---|---|---|
| 1 | 2.26 | 1.21 | 10.18 | 245.2 |
| 2 | 2.89 | 1.53 | 10.51 | 239.8 |
| 3 | 3.32 | 1.82 | 10.80 | 233.5 |
| 4 | 3.72 | 1.95 | 10.79 | 230.1 |
| 5 | 4.26 | 2.02 | 10.81 | 226.3 |
For the structural size (hole diameter/circumscribed diameter), I varied it from 3 to 7 mm while keeping the gap constant at 3 mm. The results in Table 4 indicate that increasing the structural size reduced the strength because less binder was needed to form the thinner lattice. Gas evolution first decreased and then increased, with a minimum at 5 mm. Permeability showed the opposite trend, peaking at 5 mm. Thus, 5 mm was selected as the center for the structural size.
| Size (mm) | Compressive strength (MPa) | Flexural strength (MPa) | Gas evolution (mL/g) | Permeability |
|---|---|---|---|---|
| 3 | 4.47 | 2.29 | 11.24 | 226.1 |
| 4 | 3.76 | 2.05 | 11.02 | 230.8 |
| 5 | 3.32 | 1.82 | 10.80 | 233.5 |
| 6 | 2.92 | 1.61 | 10.77 | 228.4 |
| 7 | 2.31 | 1.02 | 10.99 | 207.8 |
2.2 Box-Behnken Design
Based on the single-factor results, a three-factor, three-level Box-Behnken design (BBD) was constructed. The independent variables were: hole structure (A), coded as -1 (square), 0 (circular), +1 (hexagonal); gap size (B), with levels of 2, 3, and 4 mm; and structural size (C), with levels of 4, 5, and 6 mm. The responses were compressive strength (Y1), flexural strength (Y2), gas evolution (Y3), and permeability (Y4). Table 5 shows the design matrix and measured responses.
| Run | A | B (mm) | C (mm) | Compressive (MPa) | Flexural (MPa) | Gas (mL/g) | Permeability |
|---|---|---|---|---|---|---|---|
| 1 | -1 | 2 | 5 | 2.628 | 1.360 | 10.63 | 235.0 |
| 2 | 0 | 3 | 5 | 3.273 | 1.813 | 10.81 | 231.9 |
| 3 | 0 | 2 | 6 | 2.549 | 1.369 | 10.76 | 223.8 |
| 4 | 1 | 3 | 4 | 2.989 | 1.659 | 11.37 | 220.0 |
| 5 | -1 | 4 | 5 | 3.423 | 1.903 | 10.75 | 231.2 |
| 6 | 1 | 2 | 5 | 2.433 | 1.288 | 10.79 | 231.1 |
| 7 | 0 | 3 | 5 | 3.306 | 1.830 | 10.79 | 232.4 |
| 8 | 0 | 3 | 5 | 3.362 | 1.796 | 10.78 | 233.4 |
| 9 | 1 | 3 | 6 | 2.395 | 1.422 | 11.20 | 209.8 |
| 10 | -1 | 3 | 4 | 3.429 | 1.779 | 11.24 | 222.1 |
| 11 | 0 | 3 | 5 | 3.259 | 1.816 | 10.83 | 234.5 |
| 12 | 0 | 3 | 5 | 3.398 | 1.835 | 10.82 | 233.5 |
| 13 | 0 | 4 | 4 | 3.937 | 2.010 | 11.11 | 229.6 |
| 14 | 0 | 4 | 6 | 3.587 | 1.844 | 10.93 | 221.3 |
| 15 | 1 | 4 | 5 | 3.206 | 1.768 | 11.08 | 228.5 |
| 16 | -1 | 3 | 6 | 2.605 | 1.538 | 11.09 | 219.0 |
| 17 | 0 | 2 | 4 | 3.239 | 1.615 | 10.89 | 227.0 |
2.3 Regression Models and ANOVA
Using analysis of variance (ANOVA), I developed the following quadratic regression equations for each response:
$$Y_1 = 3.3196 – 0.13275A + 0.413B – 0.30725C – 0.0055AB + 0.0575AC + 0.085BC – 0.4353A^2 + 0.382B^2 – 0.0298C^2$$
$$Y_2 = 1.818 – 0.055375A + 0.23663B – 0.11125C – 0.01575AB + 0.001AC + 0.02BC – 0.17413A^2 – 0.064125B^2 – 0.044375C^2$$
$$Y_3 = 10.806 + 0.06625A + 0.125B – 0.07875C – 0.0075AB – 0.005AC – 0.0125BC + 0.1795A^2 – 0.123B^2 + 0.2395C^2$$
$$Y_4 = 233.14 – 2.2375A – 0.7875B – 3.15C + 0.3AB – 1.775AC – 1.275BC – 4.6955A^2 + 3.005B^2 – 10.72C^2$$
The ANOVA results confirmed the high significance of all models (P < 0.0001). For compressive strength, the model had R² = 0.9866, adjusted R² = 0.9693, and a non-significant lack-of-fit (P = 0.1793). The importance of factors decreased in the order B > C > A. Similar rankings were observed for flexural strength and gas evolution. However, for permeability, the ranking was C > A > B, with the interaction AC being significant (P = 0.033). Table 6 summarizes the key ANOVA statistics.
| Response | R² | Adj. R² | Pred. R² | Cv (%) | Significant factors |
|---|---|---|---|---|---|
| Compressive strength | 0.9866 | 0.9693 | 0.8487 | 2.50 | A, B, C |
| Flexural strength | 0.9939 | 0.9861 | 0.9210 | 1.51 | A, B, C |
| Gas evolution | 0.9877 | 0.9719 | 0.8410 | 0.31 | A, B, C |
| Permeability | 0.9838 | 0.9629 | 0.8171 | 0.59 | A, C, AC |
The response surface plots revealed that for strength, the gap size had the steepest slope, confirming its dominant influence. For permeability, the structural size and its interaction with hole structure were most critical. After numerical optimization, the optimal combination was predicted as: hole structure = circular, gap size = 3.67 mm, and structural size = 4.76 mm. Considering the actual printing constraints, I adjusted these to gap size = 3.7 mm and structural size = 4.8 mm, keeping the circular holes. Table 7 lists the confirmation experiments performed under these conditions.
| Sample | Compressive strength (MPa) | Flexural strength (MPa) | Gas evolution (mL/g) | Permeability |
|---|---|---|---|---|
| 1 | 3.78 | 2.06 | 10.9 | 235.7 |
| 2 | 3.81 | 2.03 | 10.8 | 236.3 |
| 3 | 3.85 | 1.98 | 10.1 | 236.5 |
| 4 | 3.87 | 2.04 | 10.5 | 235.9 |
| 5 | 3.79 | 1.99 | 10.7 | 236.6 |
| Average | 3.82 | 2.02 | 10.6 | 236.2 |
The optimized grid structure reduced compressive strength by 19.2% compared to a solid mold, but this value still exceeded the minimum required for handling and pouring. Most importantly, gas evolution decreased by 12.5% and permeability increased by 126.9%, which significantly reduces the risk of gas-related casting defects and improves mold venting.
3. Casting Process Design and Simulation for a Thin-Walled Complex Housing
Using the optimized sand mold parameters, I proceeded to design a complete casting process for a thin-walled ZL101A aluminum alloy housing. The housing had overall dimensions of approximately 145 mm × 125 mm × 130 mm, with wall thicknesses ranging from 2 to 18 mm and an average of 5.5 mm. The part was asymmetric with many bosses and internal features, making it a good candidate for 3D sand printing.
3.1 Gating System Design
An unpressurized (open) gating system was chosen to avoid aspiration and turbulence. The cross-sectional area ratio of vertical runner (ΣA直) to horizontal runner (ΣA横) to inner gate (ΣA内) was set to 1 : 2 : 2.2. The minimum cross-sectional area of the inner gate (A内) was calculated using the following formula:
$$A_{\text{内}} = \frac{G_L}{\rho_L \mu t \sqrt{2 g h_p}}$$
where \(G_L\) is the total mass of metal including gating and risers, \(\rho_L\) is the density of the liquid alloy, \(\mu\) is the flow loss coefficient, \(t\) is the pouring time, and \(h_p\) is the effective pressure head. Based on an assumed casting yield of 70%, the total metal weight was about 2.5 kg. Using an empirical coefficient \(S = 2.3\) for small aluminum castings, the pouring time was calculated as \(t = S\sqrt{G_L} \approx 4\) s. Substituting the relevant values, the required inner gate area was about 3.2 cm². The final gating system consisted of a sprue, a runner bar, and six inner gates arranged at the bottom of the casting to ensure smooth upward filling.
3.2 Initial Simulation and Defect Analysis
The model was meshed in ProCAST with 5 mm elements for the casting and 20 mm for the mold (a 200 mm cube box). The casting material was set to EN AC-42100 (AlSi7Mg0.3), poured at 725°C into the mold at room temperature. The filling simulation showed a stable, progressive fill without splashing. However, the solidification sequence was unfavorable: thin sections solidified first, creating isolated liquid regions at thicker and more complex locations, which led to shrinkage porosity. The initial defect prediction indicated a total shrinkage porosity volume of 0.102 cc, mostly located at critical junctions.
3.3 Optimized Casting Design
To eliminate these defects, I added a combination of chills (cold irons) to accelerate cooling at hot spots and redesigned the riser system. The optimized design included three chills at the bottom, one chill at the middle complex region, three chills near the top thick sections, an enlarged top open riser, and three additional blind risers. The location of chills and risers was determined iteratively through simulation. The filling simulation after optimization showed that the casting filled completely in 4.6 s with no adverse turbulence. The solidification sequence became more directional, with the casting solidifying first, followed by the risers providing feed metal until late in the process. The final shrinkage porosity volume was reduced to 0.045 cc, a decrease of 55.9%. Moreover, the remaining porosity was confined to the gating and riser systems, while the critical regions of the housing were sound.
| Case | Filling time (s) | Shrinkage volume (cc) | Defect location |
|---|---|---|---|
| Initial design | ~4.0 | 0.102 | Critical thin/thick junctions, isolated spots |
| Optimized design | 4.6 | 0.045 | Risers and gating only |
3.4 Rapid Fabrication and Validation
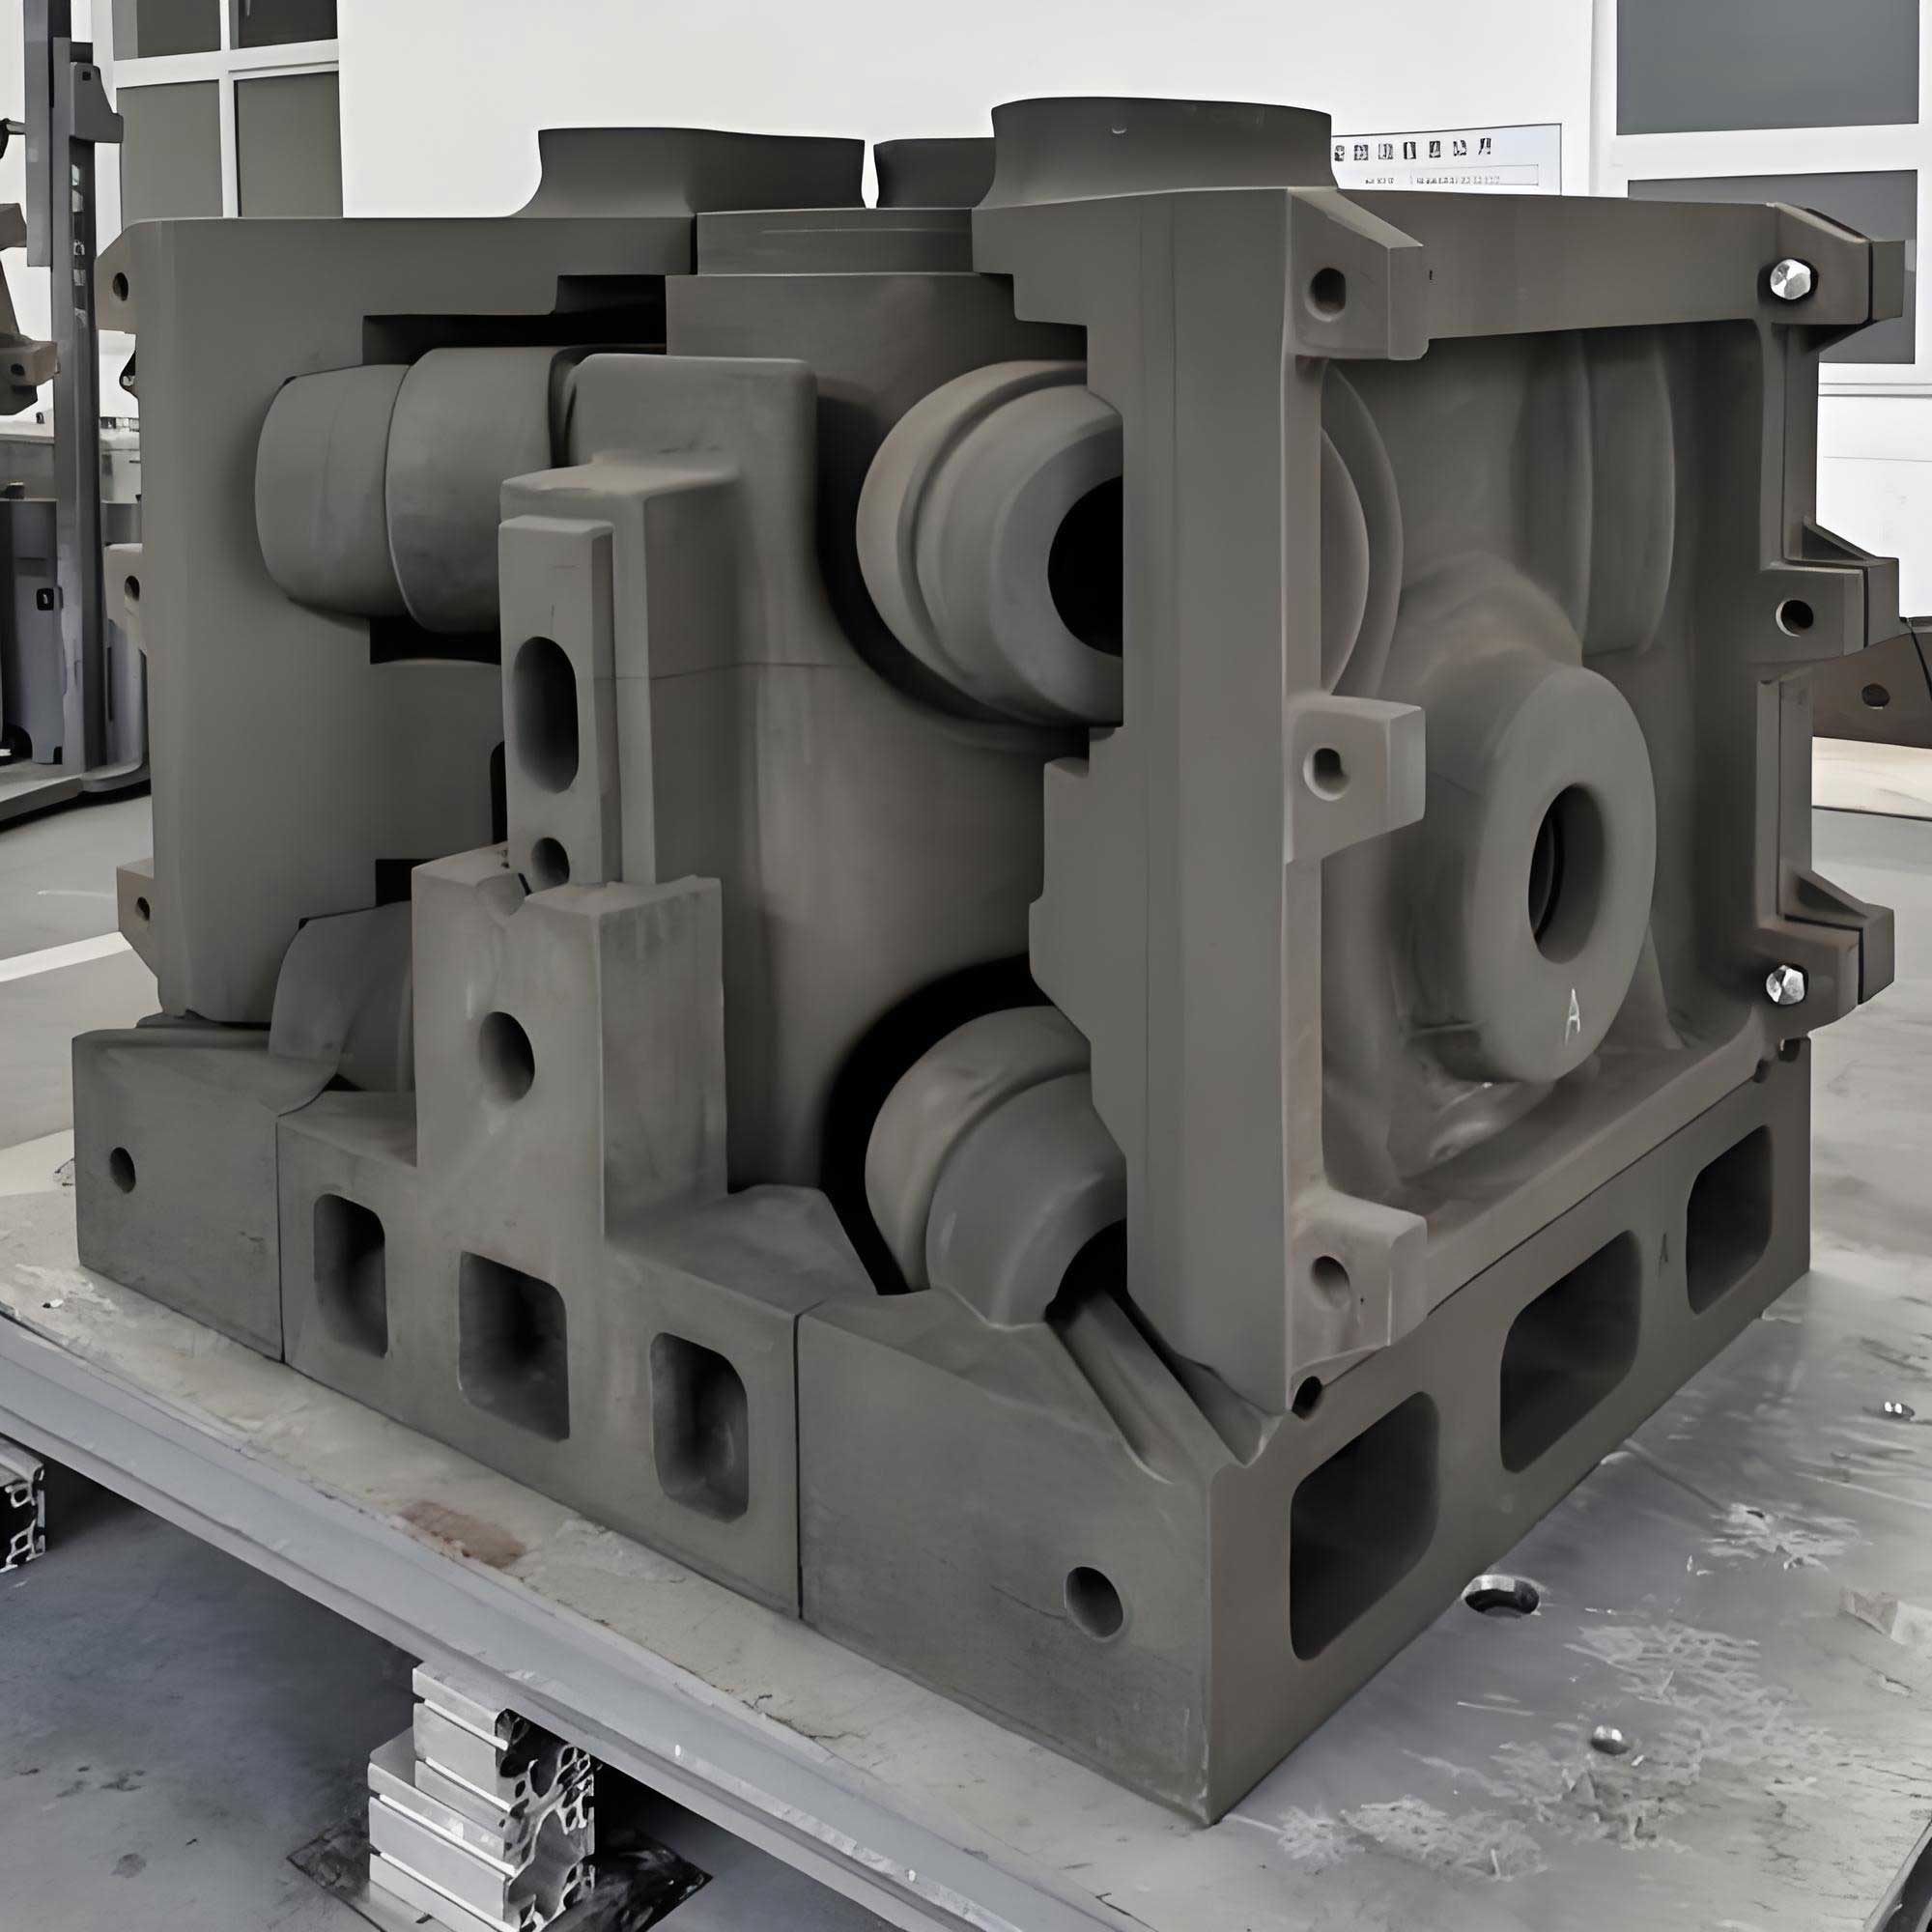
The optimized sand mold was designed as a multi-part assembly with alignment features (pins and recesses) and 0.1–0.2 mm assembly clearances. The mold was printed on the DZ2000C machine with the optimized grid parameters. The total printing time was 6 hours for 502 layers. After printing, the mold was cleaned, coated with a refractory coating, dried at 90°C for 1 hour, and assembled with chills and filters. The assembly is shown conceptually in the experimental section. The casting was poured at 725°C and allowed to cool. After knockout and fettling, the casting exhibited a smooth surface and good dimensional accuracy. X-ray inspection and pressure testing (0.2 MPa for 10–15 min) confirmed no leaks or critical internal defects. The entire cycle from design to finished casting took only 3 days, compared to approximately 12 days for conventional pattern-based tooling, representing a 75% reduction in lead time.
4. Comparison of Traditional and 3D-Printed Sand Molds on ZL101A Properties
To evaluate the practical significance of 3D sand printing, I produced identical ZL101A castings using both conventional manually molded sand molds and optimized 3D printed sand molds. All other conditions, including melting, pouring temperature, and heat treatment, were kept the same. Tensile specimens and metallographic samples were extracted from the castings in the as-cast and T6 heat-treated conditions (solution at 520°C for 3 h, water quench, aging at 200°C for 3 h).
4.1 Microstructure
Optical microscopy revealed that in the as-cast state, both mold types produced a microstructure with fine needle-like eutectic silicon, characteristic of non-equilibrium solidification. After T6 treatment, the eutectic silicon particles spheroidized and their aspect ratio decreased significantly. Interestingly, the secondary dendrite arm spacing (SDAS) was measured using the intercept method:
$$d = \frac{1}{m}\sum_{i=1}^{m}\frac{l_i}{n_i-1}$$
where \(l_i\) is the intercept length of the \(i\)-th dendrite group, \(n_i\) is the number of dendrite arms, and \(m\) is the total number of measured groups. The SDAS of the 3D-printed mold casting was approximately 15% smaller than that of the conventional mold casting. This was attributed to the higher cooling rate provided by the 3D-printed mold due to its lower thermal mass and the open grid structure that enhanced heat dissipation. The grains in the 3D-printed mold casting were more uniform and compact.
4.2 Mechanical Properties
The tensile properties after T6 treatment are summarized in Table 9. The 3D-printed mold casting exhibited a tensile strength of 288 MPa and an elongation of 2.8%, whereas the conventional mold casting reached only 249 MPa and 2.2%. The improvement is attributed to the finer dendritic structure and reduced defect density in the 3D-printed mold casting. The fracture surfaces showed a mixed ductile-brittle mode with dimples and cleavage facets; the conventional casting had more prominent cleavage planes and larger shrinkage porosity, explaining its lower strength.
| Mold type | Ultimate tensile strength (MPa) | Elongation (%) |
|---|---|---|
| Conventional | 249 | 2.2 |
| 3D printed sand mold | 288 | 2.8 |
These results clearly demonstrate that 3D sand printing not only accelerates the prototyping process but also enhances the mechanical performance of aluminum castings due to improved solidification conditions.
5. Multi-Cavity Casting and Build Space Optimization
The final part of my research addressed the low utilization of the build volume in 3D sand printing. I introduced a concept called the “sand mold ratio” (or sand utilization ratio, \(R_s\)), defined as:
$$R_s = \frac{V_{\text{mold}}}{V_{\text{total}}} \times 100\%$$
where \(V_{\text{mold}}\) is the volume of sand consumed by the molds and cores, and \(V_{\text{total}}\) is the total volume of the built enclosure (printer build box). A higher \(R_s\) indicates more efficient use of the build volume and shorter printing time per usable mold.
5.1 One-Box Six-Cavity for the Thin-Walled Housing
For the thin-walled housing, I designed a complete set of molds for pouring six castings simultaneously in one box. The mold package dimensions were 410 mm × 350 mm × 201 mm, split into four layers with alignment features. The printer’s build volume was 2000 mm × 1100 mm × 800 mm. I evaluated several spatial arrangements:
- Horizontal arrangement 1: 3 rows × 5 columns × 2 layers = 30 molds, \(R_s\) = 49.17%.
- Horizontal arrangement 2: 3 rows × 4 columns × 3 layers = 36 molds, \(R_s\) = 59.0%.
- Vertical arrangement 1: 1 row × 9 columns × 3 layers = 27 molds, \(R_s\) = 44.25%.
- Vertical arrangement 2: 3 rows × 4 columns × 3 layers = 36 molds, \(R_s\) = 59.0%.
- Mixed arrangement 1: 14 molds per layer × 3 layers = 42 molds, \(R_s\) = 65.55%.
- Mixed arrangement 2: 22 molds per layer × 2 layers = 44 molds, \(R_s\) = 72.11%.
The best utilization was achieved by the mixed arrangement 2, which allowed 44 mold sets in one print, yielding a sand utilization of 72.11%.
5.2 One-Box Four-Cavity for the Multi-Way Valve
I also designed a larger casting, a ductile iron multi-way valve (approximately 313 mm × 252 mm × 156 mm, weighing about 13.77 kg). The mold package size was 750 mm × 600 mm × 256 mm, with four cavities per package. The same spatial arrangement strategies were applied. The sand utilization percentages are given in Table 10.
| Arrangement | Number of packages | Sand ratio (%) |
|---|---|---|
| Horizontal A | 6 | 39.27 |
| Horizontal B | 9 | 58.91 |
| Vertical A | 7 | 45.82 |
| Vertical B | 8 | 52.36 |
| Vertical C | 12 | 78.55 |
| Mixed A | 10 | 65.45 |
| Mixed B | 12 | 78.55 |
The highest sand ratio of 78.55% was achieved by packing 12 packages vertically in a 3×4 arrangement. This nearly filled the entire printer, leaving very little empty volume.
5.3 Mixed Castings in a Single Build
Finally, I combined the smaller housing packages and the larger valve packages in a single print job to demonstrate the feasibility of simultaneous production of different castings. Using the vertical arrangement as the base, I placed 7 large packages (valve) and 16 small packages (housing), totaling 23 packages in one print. The calculated sand utilization was 72.04%, which is slightly lower than the best single-type arrangement but provides the advantage of producing two different components in one machine cycle. This approach significantly reduces idle time and enhances production flexibility.
| Package type | Number | Sand ratio (%) |
|---|---|---|
| Large (valve, 4-cavity) | 7 | 72.04 |
| Small (housing, 6-cavity) | 16 | |
| Total | 23 |
6. Conclusions
In this research, I systematically investigated the design, optimization, and application of 3D sand printing for complex castings. The main conclusions are as follows:
- Grid structures significantly affect the performance of 3D printed sand molds. Circular holes with a gap size of 3.7 mm and structural size of 4.8 mm provided an optimal trade-off: compressive strength of 3.82 MPa, flexural strength of 2.02 MPa, gas evolution of 10.6 mL/g, and permeability of 236.2. The strength was still sufficient for casting while permeability increased by over 120% and gas evolution decreased by 12.5% compared to solid molds.
- The combination of 3D sand printing with traditional casting process design enabled the rapid fabrication of a complex thin-walled aluminum housing. An open gating system with area ratio 1:2:2.2 and the use of chills and risers optimized through simulation reduced shrinkage porosity from 0.102 cc to 0.045 cc. The casting was sound and passed pressure testing. The total development time was reduced by 75% compared to conventional pattern making.
- The microstructure and mechanical properties of ZL101A castings produced in 3D-printed sand molds were superior to those produced in conventional molds. After T6 treatment, the 3D-printed mold casting achieved a tensile strength of 288 MPa and elongation of 2.8%, versus 249 MPa and 2.2% for the conventional mold casting. The finer microstructure was a direct result of enhanced cooling from the grid structure.
- Multi-cavity casting combined with optimized spatial arrangement can significantly increase the sand utilization ratio of 3D sand printing machines. For the housing package, a mixed arrangement reached 72.11% utilization; for the valve package, a vertical arrangement reached 78.55%. By combining both large and small mold packages in one build, I achieved a utilization of 72.04% while printing 23 mold packages at once, thereby reducing printing time and material waste.
Overall, this work demonstrates that 3D sand printing is not only a tool for rapid prototyping but also a production-ready technology for manufacturing complex and high-performance castings. The combination of optimized mold design, numerical simulation, and intelligent build planning offers a powerful route for the digital transformation of the foundry industry.