
Traditional casting is a manufacturing process composed of numerous complicated procedures, and mold design is often the bottleneck in casting process development. The difficulty of this stage largely depends on the structural features of the casting. However, with the rapid upgrading of high-end equipment, an increasing number of castings are trending toward lightweight and precision-oriented designs. Especially in advanced equipment manufacturing sectors such as aerospace and national defense, the demands on the comprehensive performance of castings are continuously increasing. Conventional casting methods are no longer capable of fulfilling the manufacturing requirements of such components. Thus, there is an urgent need to conduct research on digitalized, green, and intelligent casting processes for complex castings based on 3D sand printing. By developing intelligent casting technologies centered on 3D-printed sand molds, we aim to solve problems found in traditional casting, including difficulties in precisely controlling the shape and performance of complex castings, poor quality stability, severe resource waste, and environmental pollution. This work investigates the optimization of 3D sand printing forming processes and the verification of low-pressure die casting processes for a thin-walled complex shell casting used in the aerospace field. The specific findings of this study are summarized below.
1. Introduction and Background
Sand casting has long been the most widely used method for producing various castings due to its strong plasticity, broad material applicability, and capacity to satisfy diverse production requirements. The conventional sand casting process begins with designing expensive hard tooling, followed by manual or mechanical molding and core-making, and finally assembling the molds and cores for pouring. However, the increasing demand for single-piece, small-batch, and customised production, particularly for complex castings used in aerospace and defense sectors, has exposed the limitations of traditional sand casting. Typical lead times from mold design to finished mold are approximately 28 days, which is far too slow for modern production schedules. Moreover, the storage of hard tooling consumes vast warehouse resources, the open working environment contributes to severe pollution, and precise dimensional control of castings remains difficult to achieve. These factors collectively drove the development of a new casting paradigm known as 3D sand printing (also referred to as binder jetting additive manufacturing).
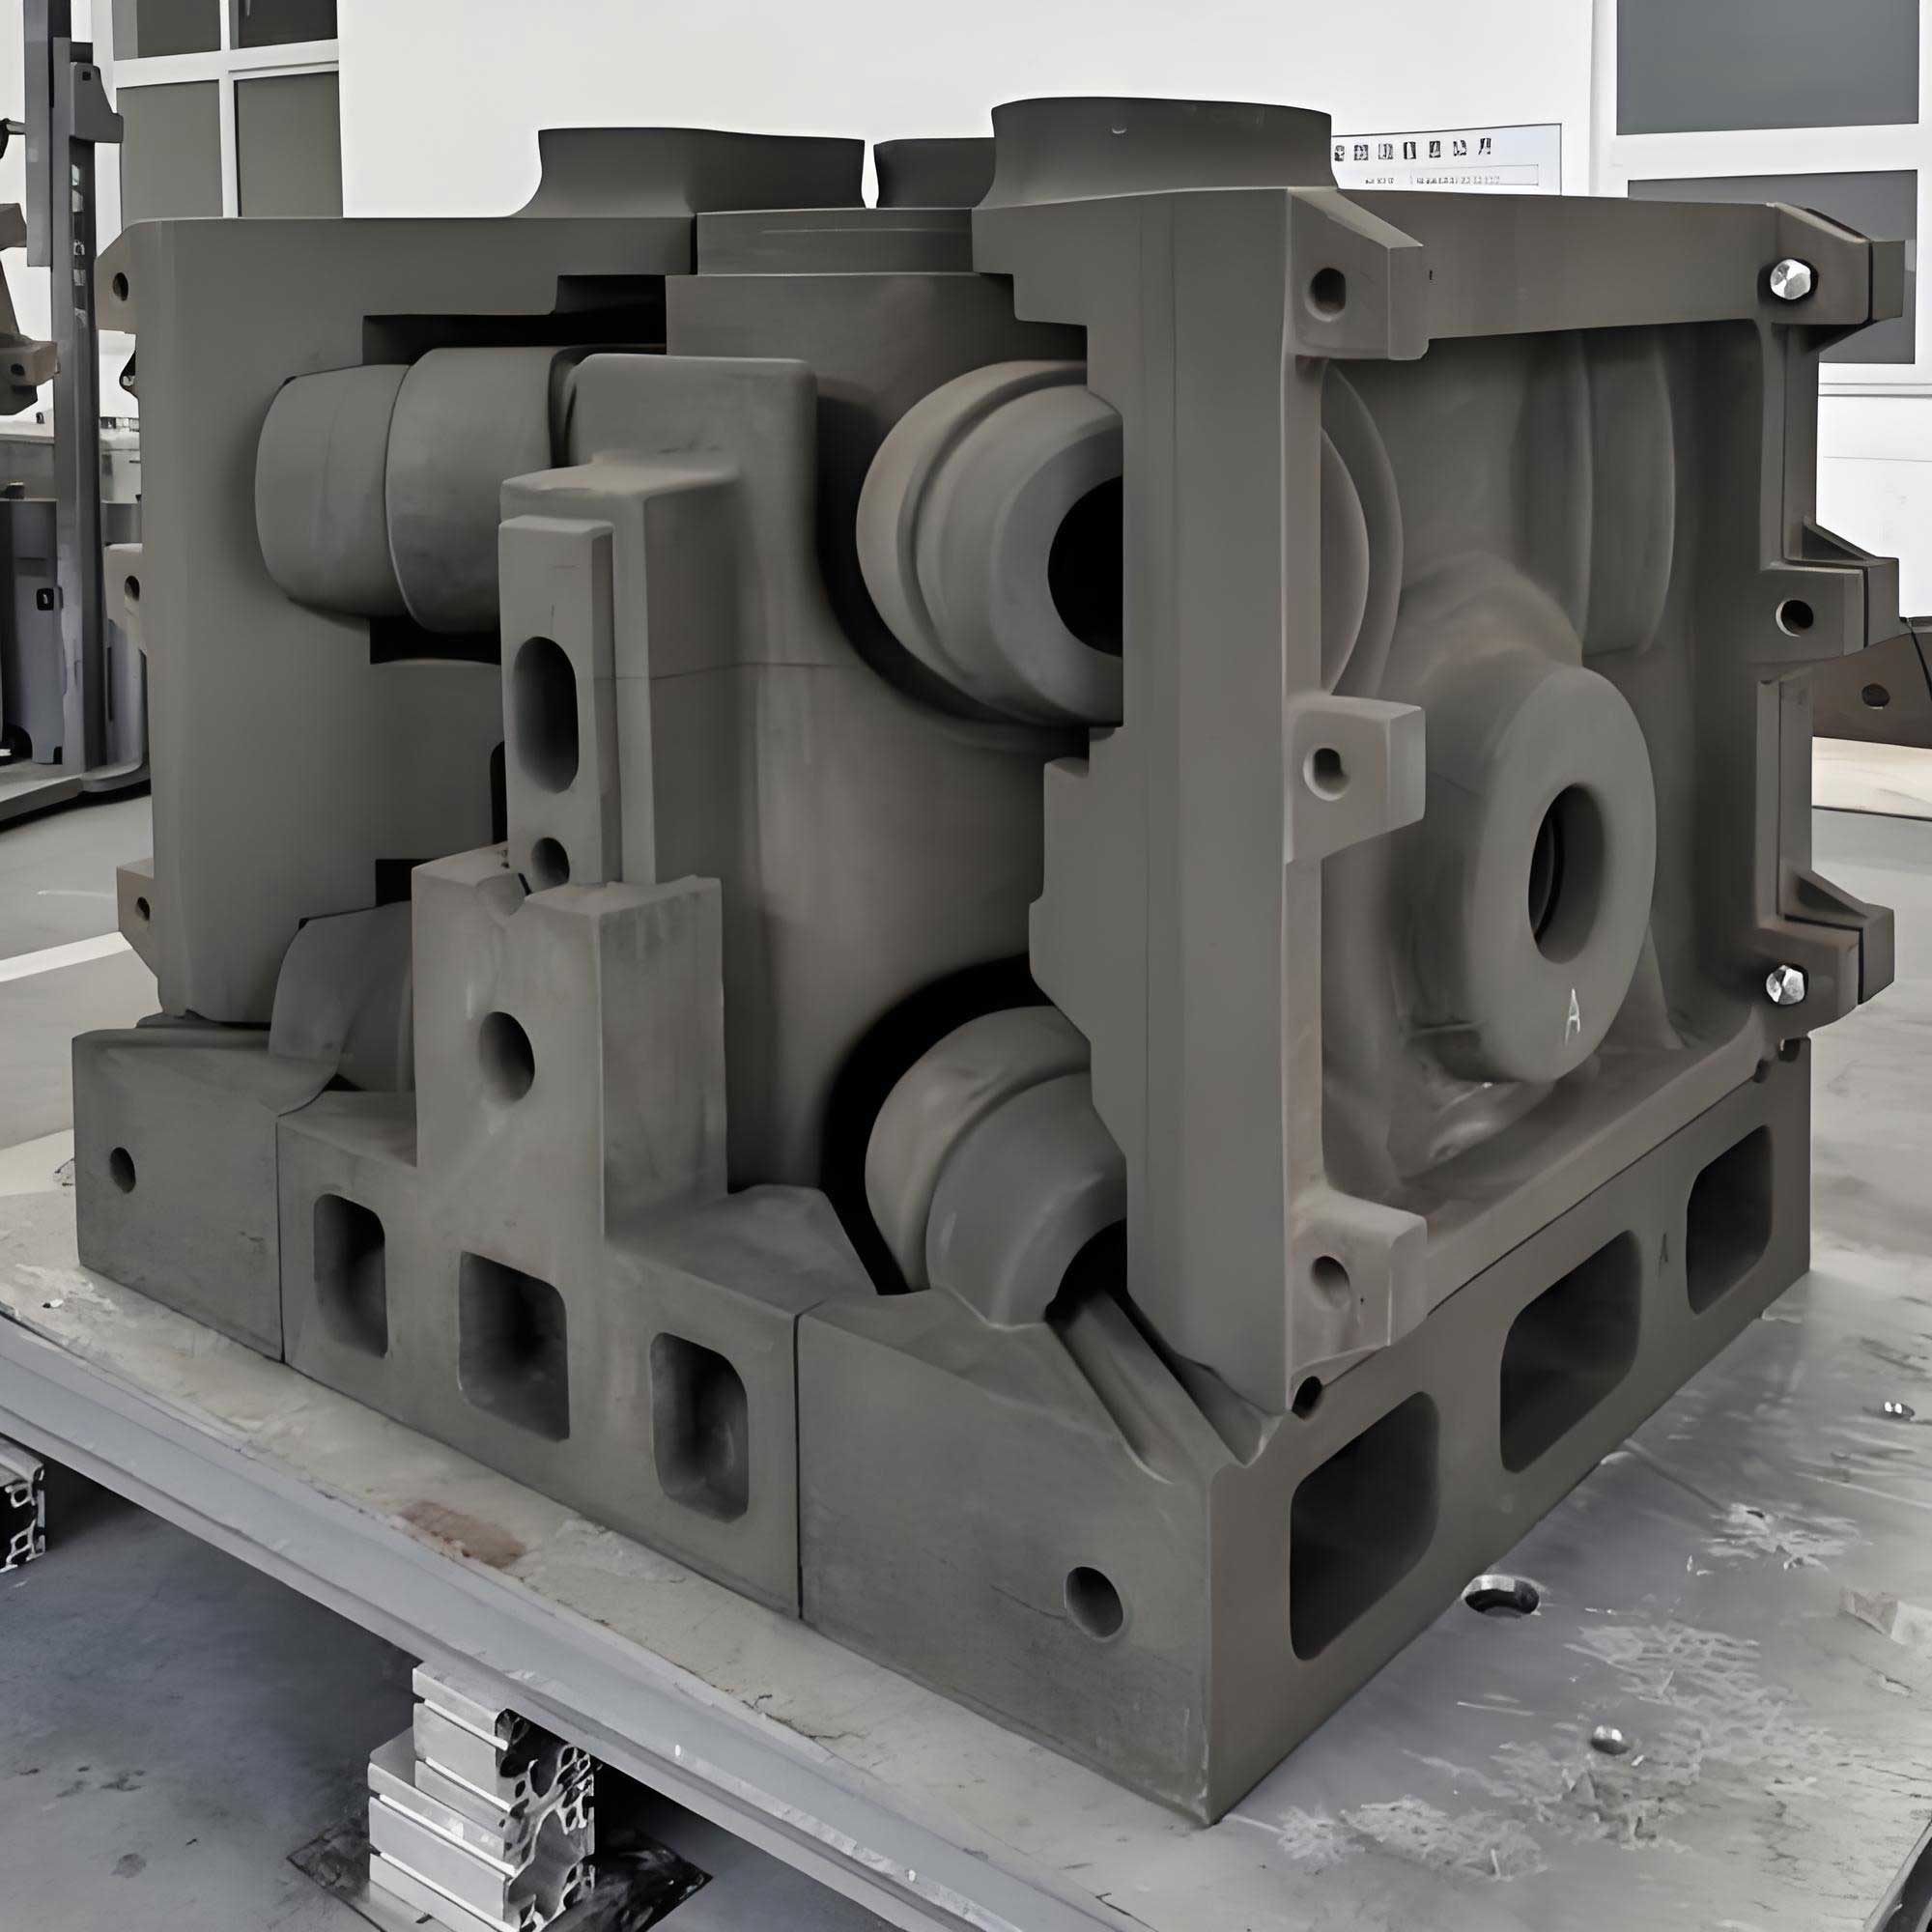
3D sand printing technology fabricates sand molds and cores layer-by-layer directly from digital models without the need for physical tooling. This approach significantly reduces the lead time associated with mold fabrication and offers design freedoms that are inconceivable with conventional pattern-based processes. For instance, sprue systems can follow the contour of the casting, cores can be printed as a whole unit, and internal cooling channels or gas vents can be integrated within the sand structure. This technology has enabled the production of complex, thin-walled castings that would otherwise be very difficult or even impossible to cast using traditional techniques. In parallel, low-pressure die casting (LPDC) has emerged as a preferred method for producing thin-walled aluminum alloy castings because it provides superior mold-filling capacity, controlled flow conditions, and the ability to feed solidification shrinkage effectively. The combination of 3D-printed sand molds with low-pressure die casting offers a promising route for rapid, high-quality production of complex structural castings. This research focuses on systematically optimizing the 3D sand printing process to obtain high-performance sand molds, and subsequently investigating the influence of low-pressure casting parameters on the microstructure and mechanical properties of ZL101A aluminum alloy. Finally, a thin-walled shell casting was designed, simulated, printed, and cast to validate the proposed methodology.
2. Experimental Materials and Procedures
2.1 Materials and Sand Mold Printing
The raw materials used in this study were supplied by Konshing (Shanxi) Intelligent Manufacturing Co., Ltd. An ExOne S-Max Pro sand mold 3D printer was employed for manufacturing test specimens and the shell casting mold package. The printer offers a build volume of 1800 mm × 1000 mm × 700 mm, layer thickness control ranging from 0.20 mm to 0.50 mm, and a printhead motion accuracy of ±0.3 μm. The specifications of key materials are summarized in the following tables.
| 3D printing silica sand | Value |
|---|---|
| Silicon content (%) | 90 – 92 |
| AFS number | 64 – 72 |
| Angular coefficient | < 1.25 |
| Bulk density (g/mL) | 1.35 – 1.45 |
| Furan resin binder | Value |
|---|---|
| Viscosity (mPa·s) | 6 – 8 |
| Density (g/cm³) | 1.12 – 1.18 |
| Electrical conductivity (μS/cm) | ≤ 20 |
| Surface tension (mN/m) | 35 – 40 |
| Curing agent | Value |
|---|---|
| Total acidity (%) | 25.5 – 26.5 |
| Viscosity (mPa·s) | 20 – 40 |
| Density (g/cm³) | 1.30 – 1.35 |
| Free sulfuric acid (%) | < 2.5 |
Before printing, the silica sand was thoroughly mixed with the curing agent and loaded into the sand hopper. During printing, a recoater spread the sand uniformly onto the build platform, and piezoelectric printheads selectively injected the furan resin binder onto the sand bed according to the cross-sectional geometry of the model. After each layer was completed, the build platform descended by one layer thickness, and the process was repeated until the full sand mold was formed. After printing, the molds were allowed to cure within the build box to develop sufficient green strength, followed by de-powdering and final cleaning.
2.2 Alloy Melting and Heat Treatment
The alloy used in this study was ZL101A aluminum alloy. Melting was performed in an 800 kg capacity low-pressure casting crucible furnace with a maximum allowable pressure of 0.30 MPa. The ZL101A ingots were melted and refined at approximately 720 °C. Refining was conducted using a rotary degassing device with argon gas at a flow rate of 12–30 NL/min and a rotor speed of 800 r/min for about 25 minutes to reduce the hydrogen content to below 0.001 mL/g. After refining, the melt was held at temperature for subsequent pouring. The actual composition of the resulting alloy is shown in the table below.
| Element | Si | Mg | Ti | Sr | Zr | Cu | Al |
|---|---|---|---|---|---|---|---|
| Content (wt.%) | 6.909 | 0.359 | 0.163 | 0.009 | 0.049 | 0.005 | Balance |
All test castings and specimens were subjected to T6 heat treatment. The solution treatment was conducted at 535 °C for 13 hours, followed by quenching in water at approximately 80 °C. The aging treatment was performed at 200 °C for 5 hours, followed by air cooling.
2.3 Testing and Characterization
Tensile strength of the 3D-printed sand specimens was measured according to GB/T 2684-2009 using a SWY-B digital hydraulic strength testing machine. Standard “8”-shaped specimens were printed and tested, and the reported values were the average of five replicates. The gas evolution of the printed sand was measured using a GET-Ⅲ intelligent gas evolution tester. Approximately 1.0 g of sand was heated to 850 °C in a quartz tube, and the volume of evolved gas was recorded. Dimensional accuracy was evaluated using cylindrical specimens measuring Φ50 mm × 50 mm with a base plate thickness of 10 mm and a center-to-center spacing of 70 mm. A vernier caliper was used to measure the diameters, heights, and relative positions of the cylinders. Three replicates were measured, and the average values were calculated.
For metallic specimens, metallographic samples were prepared by sectioning the tensile specimens, grinding with SiC paper from 80 to 4000 grit, and polishing with 1.0 μm diamond paste. The polished surfaces were etched with 0.2% HF solution. A metallurgical microscope was employed to observe the microstructure, and Nano measure software was used to quantify the sizes of cell crystals and secondary dendrite arm spacing. Tensile tests were conducted using an electronic universal testing machine in accordance with GB/T 228.1-2021. The fracture surfaces were examined using scanning electron microscopy. Hardness tests were performed on the casting specimens.
3. Optimization of 3D Sand Printing Process Parameters
3.1 Response Surface Methodology Design
Traditional single-factor experiments are insufficient for describing the combined effects of process parameters on the performance of 3D-printed sand molds. To overcome this limitation, response surface methodology was adopted. This statistical approach develops a mathematical relationship between input variables and response variables using regression analysis. In this study, a central composite design was selected to build a second-order polynomial model that describes the influence of three key process parameters: resin inkjet content, printing layer thickness, and curing agent content. The coded levels and corresponding actual values of the process parameters are presented in the table below.
| Variable | Code | −α | −1 | 0 | 1 | α |
|---|---|---|---|---|---|---|
| Resin inkjet content (%) | A | 1.2 | 1.4 | 1.6 | 1.8 | 2.0 |
| Layer thickness (mm) | B | 0.25 | 0.30 | 0.35 | 0.40 | 0.45 |
| Curing agent content (%) | C | 0.20 | 0.25 | 0.30 | 0.35 | 0.40 |
The central composite design consisted of a total of 20 experimental runs, including factorial points, axial points, and center points. The response variables selected were tensile strength, gas evolution, and dimensional deviation. Ten experimental runs with varying parameter combinations were performed using the central composite design methodology.
3.2 Single-Factor Effects on Sand Mold Performance
Single-factor experiments were first conducted to establish the individual influence of each parameter. As the resin inkjet content increased from 1.2% to 2.0%, several trends were observed:
1. Tensile strength rose continuously from approximately 1.44 MPa to 3.27 MPa. This is because the resin binder forms adhesive bridges between the sand grains. A higher resin content leads to an increased number of binder bridges and a larger bonding area, thereby enhancing mechanical integrity.
2. Gas evolution increased substantially, growing from approximately 6.04 mL/g to 12.68 mL/g. Furan resin is an organic compound that decomposes upon heating, releasing gaseous by-products. Thus, higher resin content leads to greater gas evolution.
3. Dimensional deviation enlarged from ±0.21 mm to ±0.42 mm. When more resin is jetted onto the powder bed, the lateral spreading distance of the resin droplets increases. Excess binder may diffuse into non-patterned regions, bonding adjacent sand grains and causing dimensional inaccuracies.
The influence of layer thickness was investigated by varying it from 0.25 mm to 0.45 mm while keeping resin inkjet at 1.6% and curing agent at 0.30%. The following observations were made.
1. Tensile strength gradually decreased from 2.53 MPa to 2.27 MPa. This reduction arises because thicker layers extend the vertical distance through which the binder must penetrate. At larger thicknesses, the resin may not fully permeate the layer before the curing reaction begins, leading to incomplete bonding and lower strength.
2. Gas evolution decreased from approximately 10.78 mL/g to 9.82 mL/g. This is a secondary effect related to the distribution of the binder within the layered structure.
3. Dimensional deviation diminished from ±0.34 mm to ±0.22 mm. A thicker layer reduces the relative lateral diffusion of the binder since the resin tends to distribute over a greater vertical extent, thereby limiting the excess binding of adjacent sand grains.
The curing agent content was then varied from 0.20% to 0.40% at fixed resin content of 1.6% and layer thickness of 0.30 mm. The results are described below.
1. Tensile strength initially increased and then decreased. When the curing agent content is too low, the cross-linking reaction is sluggish because the acid catalyst is insufficient to accelerate the process. When the curing agent becomes excessive, the polymerization rate is too fast, causing small resin droplets to solidify before fully bridging neighboring sand grains. Consequently, the bond network becomes incomplete and brittle.
2. Gas evolution increased modestly with increasing curing agent content, reflecting a higher amount of organic constituents that can decompose upon heating.
3. Dimensional deviation remained essentially unchanged, indicating that the curing agent content has a negligible effect on the spread behavior of the resin droplets.
3.3 Regression Model Development
The central composite design results were analyzed using Design Expert software. ANOVA was employed to assess the statistical significance of the regression models for each response variable. Based on the experimental data, quadratic regression equations were established for tensile strength, gas evolution, and dimensional deviation. For tensile strength, the regression model is given by the following equation (where A represents resin inkjet, B represents layer thickness, and C represents curing agent content):
$$Y_1 = 2.44 + 0.4786A – 0.1128B + 0.0257C + 0.0075AB – 0.01AC + 0.0075BC + 0.0079A^2 + 0.0097B^2 – 0.0098C^2$$
For gas evolution, the model is expressed as:
$$Y_2 = 10.74 + 1.72A – 0.165B + 0.3358C – 0.0225AB – 0.06AC – 0.0175BC – 0.1793A^2 – 0.0326B^2 – 0.0891C^2$$
For dimensional deviation, the model is expressed as:
$$Y_3 = 0.3153 + 0.0632A – 0.0392B + 0.0005C – 0.0075AB + 0.005AC – 0.005BC – 0.0074A^2 – 0.0039B^2 – 0.0074C^2$$
The ANOVA results for tensile strength are summarized in the table below.
| Source | Sum of Squares | df | Mean Square | F-value | P-value | Significance |
|---|---|---|---|---|---|---|
| Model | 3.32 | 9 | 0.3685 | 65.84 | < 0.0001 | ** |
| A | 3.13 | 1 | 3.13 | 558.92 | < 0.0001 | ** |
| B | 0.1737 | 1 | 0.1737 | 31.03 | 0.0002 | ** |
| C | 0.009 | 1 | 0.009 | 1.61 | 0.2336 | – |
| Residual | 0.056 | 10 | – | – | – | – |
| Lack of Fit | 0.0392 | 5 | 0.0078 | 2.34 | 0.1861 | – |
| R² | 0.9834 | |||||
| Adj.R² | 0.9685 | |||||
The model P-value of less than 0.0001 indicates that the model is highly significant. The non-significant lack of fit (P = 0.1861) suggests that the model adequately fits the experimental data. The high R² value of 0.9834 implies that the regression model explains approximately 98.34% of the variation in tensile strength. The ANOVA analysis revealed that resin inkjet content has the strongest effect on tensile strength, followed by layer thickness, while the effect of curing agent content is negligible.
The ANOVA results for gas evolution are shown in the following table.
| Source | Sum of Squares | df | Mean Square | F-value | P-value | Significance |
|---|---|---|---|---|---|---|
| Model | 42.97 | 9 | 6.26 | 229.51 | < 0.0001 | ** |
| A | 40.49 | 1 | 40.49 | 1946.11 | < 0.0001 | ** |
| B | 0.3719 | 1 | 0.3719 | 17.87 | 0.0017 | ** |
| C | 1.54 | 1 | 1.54 | 74.03 | < 0.0001 | ** |
| Residual | 0.2080 | 10 | – | – | – | – |
| Lack of Fit | 0.1770 | 5 | 0.0354 | 5.69 | 0.3960 | – |
| R² | 0.9952 | |||||
| Adj.R² | 0.9908 | |||||
For gas evolution, both resin inkjet content (A) and curing agent content (C) exhibit significant effects, while the impact of layer thickness is comparatively weaker. The ANOVA results for dimensional deviation are listed in the table below.
| Source | Sum of Squares | df | Mean Square | F-value | P-value | Significance |
|---|---|---|---|---|---|---|
| Model | 0.078 | 9 | 0.0071 | 31.33 | < 0.0001 | ** |
| A | 0.0546 | 1 | 0.0546 | 197.40 | < 0.0001 | ** |
| B | 0.0210 | 1 | 0.0210 | 75.88 | < 0.0001 | ** |
| C | 2.966E-06 | 1 | 2.966E-06 | 0.0107 | 0.9196 | – |
| Residual | 0.0028 | 10 | – | – | – | – |
| Lack of Fit | 0.0022 | 5 | 0.0004 | 4.03 | 0.0761 | – |
| R² | 0.9657 | |||||
| Adj.R² | 0.9349 | |||||
3.4 Combined Effects of Process Parameters
Response surface plots and contour plots were generated to visually analyze the interaction effects of the process parameters on each performance criterion. For tensile strength, the interaction between resin inkjet content and layer thickness showed the most significant effect. The response curve rose steeply with increasing resin content and descended mildly with increasing layer thickness. The interaction between layer thickness and curing agent content had a negligible effect on tensile strength. This observation supports the conclusion that resin inkjet content is the dominant factor controlling the tensile strength of 3D-printed sand molds, while layer thickness has a secondary role.
For gas evolution, the interaction between resin inkjet content and curing agent content was the most significant. The response surface plot revealed a sharp increase in gas evolution when both parameters were at their high levels. In contrast, the interaction between layer thickness and curing agent content produced only minor changes in gas evolution. This behavior is consistent with the understanding that both the binder and the catalyst contribute directly to the total amount of organic material that can decompose and evolve gas at elevated temperatures.
For dimensional deviation, the influence of resin inkjet content and layer thickness was markedly stronger than that of curing agent content. The dimensional deviation contour plots showed clear gradients in both the A-B plane and the A-C plane, confirming that any parameter combination containing resin inkjet content tends to influence dimensional accuracy significantly. The combined effect of resin inkjet and curing agent was also noticeable but less pronounced.
3.5 Optimization and Experimental Validation
Using the Numerical optimization function of the Design Expert software, the desirability approach was applied to identify the optimal process conditions. The optimization aimed to maximize tensile strength while minimizing both gas evolution and dimensional deviation. The optimization results suggested a resin inkjet content of 1.462%, a layer thickness of 0.35 mm, and a curing agent content of 0.25%. Under these conditions, the predicted tensile strength was 2.073 MPa, the predicted gas evolution was 9.0 mL/g, and the predicted dimensional deviation was ±0.264 mm.
To verify the reliability of the proposed regression models, confirmatory experiments were conducted under the optimized conditions. The practical printing parameters were adjusted to the closest attainable values: resin inkjet content of 1.46%, layer thickness of 0.35 mm, and curing agent content of 0.25%. Three replicate batches of specimens were printed. The measured performance values are presented in the table below.
| Specimen | Resin inkjet (%) | Layer thickness (mm) | Curing agent (%) | Tensile strength (MPa) | Gas evolution (mL/g) | Dimensional deviation (±mm) |
|---|---|---|---|---|---|---|
| 1 | 1.46 | 0.35 | 0.25 | 2.17 | 10.03 | 0.26 |
| 2 | 1.46 | 0.35 | 0.25 | 2.12 | 8.82 | 0.21 |
| 3 | 1.46 | 0.35 | 0.25 | 2.09 | 9.10 | 0.24 |
| Average | – | – | – | 2.13 | 9.32 | 0.24 |
The experimental average values were in good agreement with the predicted values, confirming the validity of the established regression models. Compared to the single-factor experimental result at center point settings, the optimized parameters reduced resin consumption by approximately 8.75% and curing agent consumption by 16.67%, while maintaining excellent sand mold integrity. In addition, the increased layer thickness improved printing productivity by approximately 14.29% without compromising strength requirements.
4. Effects of Low-Pressure Casting Parameters on ZL101A Alloy
4.1 Influence of Pouring Temperature
The pouring temperature plays a decisive role in controlling the solidification behavior of the melt and, consequently, the resulting microstructure and mechanical performance of the casting. In this section, the effect of pouring temperature was investigated at 700 °C, 720 °C, 740 °C, and 760 °C while keeping the sand mold at ambient temperature. The microstructural characteristics of the ZL101A alloy after T6 heat treatment are described below.
At a pouring temperature of 700 °C, the α-Al matrix was dispersed and predominantly consisted of cellular grains. The eutectic silicon particles appeared as large plate-like structures, indicating incomplete modification and a short solidification time. When the pouring temperature increased to 720 °C and 740 °C, the aluminum matrix became more compact, and a considerable number of secondary dendrite arms developed. The eutectic silicon transformed from coarse plates to fine, uniformly distributed fibrous particles. At 760 °C, the dendritic structure coarsened significantly, and the distribution of the matrix became irregular. This deterioration is attributed to the extended solidification time at high pouring temperatures, which allows the dendrites to grow excessively and causing segregation.
Quantitative measurements of the grain structure were conducted using image analysis software. The average dimensions of the cellular grains and secondary dendrite arm spacing are summarized in the table below.
| Pouring temperature (°C) | Cell crystal size (μm) | Secondary dendrite arm spacing (μm) |
|---|---|---|
| 700 | 43 | 28 |
| 720 | 45 | 35 |
| 740 | 48 | 41 |
| 760 | 50 | 43 |
As shown, both the cell crystal size and the secondary dendrite arm spacing increased with rising pouring temperature. At lower pouring temperatures, the melt cools quickly, and the dendrite growth time is insufficient, resulting in a high density of small cells. At excessive pouring temperatures, the solidification interval lengthens, and the dendrite arms grow substantially. However, when the pouring temperature exceeds 740 °C, the coarsening tendency becomes more pronounced, negatively affecting the mechanical properties.
The influence of pouring temperature on the mechanical properties is illustrated in the table below.
| Pouring temperature (°C) | Tensile strength (MPa) | Elongation (%) |
|---|---|---|
| 700 | 302 | 2.1 |
| 720 | 326 | 2.8 |
| 740 | 318 | 2.5 |
| 760 | 305 | 2.2 |
The optimum combination of tensile strength and elongation was obtained at a pouring temperature of 720 °C. When the temperature was too low, incomplete grain growth led to unfavorable microstructures. When the temperature was too high, the alloy experienced severe oxidation and gas absorption, increasing the likelihood of porosity and oxide inclusions. Consequently, the suitable pouring temperature range for low-pressure casting was determined to be 720 °C to 740 °C.
Scanning electron microscopy of the tensile fracture surfaces revealed a predominantly brittle fracture mechanism. The fracture surfaces exhibited cleavage facets, tear ridges, and a limited number of shallow dimples. Small pores were observed in some fractures, which acted as crack initiation sites and reduced the mechanical strength. This behavior is consistent with the microstructural evolution described above.
4.2 Influence of Sand Mold Preheating Temperature
The preheating of the 3D-printed sand mold before pouring is an important step in low-pressure die casting, especially for thin-walled components with complex cavities. In this section, the effect of preheating temperature was evaluated at 60 °C, 80 °C, 100 °C, and 120 °C, while the pouring temperature was maintained at 740 °C. The microstructure of the alloy was examined, and the results are presented as follows.
At a preheating temperature of 60 °C, the cooling rate is relatively high, and the dendritic structure is fine but underdeveloped. With increasing preheating temperature, the cooling rate decreases, providing sufficient time for grain growth. The cell crystals develop into well-defined dendritic structures with clearly visible secondary arms. However, at preheating temperatures above 100 °C, the dendrites coarsen noticeably, and the mechanical properties begin to decline. The measured grain size data are shown in the table below.
| Preheating temperature (°C) | Cell crystal size (μm) | Secondary dendrite arm spacing (μm) |
|---|---|---|
| 60 | 32 | 43 |
| 80 | 38 | 47 |
| 100 | 46 | 51 |
| 120 | 44 | 49 |
It can be seen that the cellular grain size and dendrite arm spacing increase when the preheating temperature rises from 60 °C to 100 °C. A further increase to 120 °C resulted in only marginal changes. The tensile properties corresponding to different preheating temperatures are summarized below.
| Preheating temperature (°C) | Tensile strength (MPa) | Elongation (%) |
|---|---|---|
| 60 | 318 | 3.1 |
| 80 | 337 | 3.6 |
| 100 | 329 | 3.3 |
| 120 | 315 | 2.9 |
The highest tensile strength of 337 MPa and elongation of 3.6% were achieved at a preheating temperature of 80 °C. As the preheating temperature increased further, the coarser microstructures degraded the mechanical properties. Thus, for thin-walled complex castings, a preheating temperature range of 80 °C to 100 °C is recommended as a compromise between adequate filling capacity and desirable microstructural refinement.
Fracture surface inspection showed that at low preheating temperatures, a relatively higher proportion of fine dimples was present, suggesting better ductility. As the preheating temperature rose, the number of deep dimples decreased, while cleavage facets and tear ridges dominated the fracture surface. This transition from ductile to brittle fracture corresponded with the observed degradation in elongation.
4.3 Comparison of Conventional and 3D-Printed Sand Molds
A comparative study was conducted under identical low-pressure casting conditions to assess the differences between a conventionally prepared sand mold and a 3D-printed sand mold. The pouring temperature was set to 740 °C for both tests, and the sand molds were not preheated. The resulting microstructures and mechanical properties of ZL101A alloy specimens were compared. The grain structure of the alloy solidified in 3D-printed sand molds was noticeably finer than that of the alloy cast in conventional sand molds. Quantitative comparisons are presented in the table below.
| Mold type | Alloy condition | Cell crystal size (μm) | Secondary dendrite arm spacing (μm) | Tensile strength (MPa) | Elongation (%) |
|---|---|---|---|---|---|
| Conventional sand mold | ZL101A-T6 | 58 | 46 | 298 | 2.4 |
| 3D Printed sand mold | ZL101A-T6 | 47 | 36 | 315 | 2.7 |
The 3D-printed sand mold produced specimens with an approximately 18.9% finer cellular grain size and 21.7% finer dendrite arm spacing compared to the conventionally prepared mold. The tensile strength increased from 298 MPa to 315 MPa, while elongation improved from 2.4% to 2.7%. The advantages of 3D-printed sand molds arise from their more uniform structure and better-controlled thermal conductivity, which influences the heat transfer rate at the mold–metal interface. Additionally, the dimensional consistency of 3D-printed molds is superior to manually prepared molds, reducing variability in casting quality. These results indicate that 3D sand printing molds offer measurable advantages in producing ZL101A aluminum alloy castings with better mechanical performance and reliability.
5. Design and Validation of 3D-Printed Sand Mold Low-Pressure Casting for a Shell Casting
5.1 Analysis of Shell Casting Characteristics
The complex shell casting selected for this study is an aerospace structural component. Its overall dimensions are approximately 335 mm × 335 mm × 197 mm. The wall thickness analysis reveals that the maximum wall thickness is 24.7 mm, while the minimum wall thickness is only 2.8 mm, representing a significant thickness variation. The casting features a large curved shell with an extended outlet pipe, resulting in a complex and asymmetrical internal cavity. The weight of the casting blank is approximately 7.5 kg. The material is ZL101A aluminum alloy, and the casting must comply with Class Ⅱ acceptance requirements of HB 963. Dimensional tolerances must conform to HB 6103-86 CT9. The internal cavity must remain leak-proof under air pressure.
5.2 Gating System Design
To ensure complete filling of the thin-walled regions and proper feeding of the thicker sections, a bottom-fed gating system was designed. The system uses a central sprue connected to the pouring basin, with six radial runner arms extending outward. Each runner terminates in a vertical sprue of Φ45 mm diameter. The casting design incorporates three types of ingates: vertical slot gates, stepped gates, and vertical tubular gates. These gate designs were selected based on the local wall thickness variations of the casting. The design concept leverages the design freedom of 3D sand printing, allowing the gating channels to conform to the contour of the casting and thereby improve the flow behavior of the molten alloy and reduce turbulence and gas entrapment.
The cross-sectional area ratios of the gating system components were determined as follows:
$$\Sigma A_{\text{straight}} : \Sigma A_{\text{runner}} : \Sigma A_{\text{ingate}} = 1.0 : 1.5 : 1.8$$
The distance between the ingates and the casting body was maintained between 26.5 mm and 42.2 mm. This distance was chosen to provide controlled feeding while preventing premature solidification at the gate–casting junction. The vertical sprues were extended above the top of the casting to provide additional metallostatic head pressure for improved feeding and to serve as a reservoir for oxide removal.
5.3 Feeding and Cooling Systems
Preliminary simulations were performed using the ProCAST finite element software to evaluate the solidification behavior of the casting without any risers or chills. The simulation results indicated that the thick sections at the bottom of the casting and the internal cavity regions had considerably longer solidification times compared to the surrounding thinner sections. These regions were identified as high-risk areas for shrinkage porosity formation.
Based on this evaluation, two process schemes were developed. Scheme A proposed the use of eight top risers positioned on the thick sections of the casting, along with fifteen chills located at strategic positions. Scheme B proposed an alternative approach where six ingate connections from the gating system supplied metal to the thick top sections, while only two risers were used. The risers were connected directly to the runner system, allowing hot metal from the runner to supplement the risers and improve feeding efficiency. In Scheme B, additional chills were placed on the remaining thick sections to promote directional solidification and compensate for the reduced number of risers.
5.4 Simulation of Mold Filling and Solidification
The two casting process schemes were simulated using ProCAST finite element software. Mesh generation was conducted with tetrahedral elements. For Scheme A, the mesh consisted of 207,009 surface elements and 3,334,642 volume elements. The material properties were selected from the built-in database, with the casting material designated as AlSi7Mg0.3, the sand mold as furan resin sand, and the chills as gray iron. The initial temperature of the sand mold and chills was set to 90 °C, and the pouring temperature was 745 °C. The heat transfer coefficient at the casting–sand mold interface was set to 500 W/(m²·K), while that at the casting–chill interface was 2,000 W/(m²·K).
The filling process was simulated using a pressure curve with two stages. During the first stage, the filling pressure was set to 38 kPa with a filling time of 8 seconds. During the second stage, the pressure was increased to 43 kPa and maintained for 600 seconds to allow for complete solidification under pressure. The simulation results for both schemes showed a smooth and stable flow front with no evidence of spray or turbulent flow. The filling time distribution was uniform, indicating sound mold filling behavior.
The solidification simulation results, however, revealed important differences between the two schemes. In Scheme A, a localized liquid region formed at the bottom of the casting during the final stages of solidification. This isolated liquid pool was cut off from the feeding channels because the surrounding regions had already solidified. Consequently, the risk of shrinkage porosity formation in this area was high. In Scheme B, the combination of ingate feeding and the cooling effect of chills ensured that no isolated liquid region appeared. The casting under Scheme B solidified in a sequential manner from the bottom to the top, which is favorable for producing sound castings.
The predicted shrinkage porosity distributions for the two schemes are summarized in the table below.
| Parameter | Scheme A | Scheme B |
|---|---|---|
| Total volume (cc) | 6.779 | 6.063 |
| Average result (%) | 3.240 | 2.462 |
| Porosity volume (cc) | 0.219 | 0.149 |
| Weight of porosity (mg) | 0.263 | 0.179 |
Scheme B demonstrated significantly lower porosity volume compared to Scheme A. Therefore, Scheme B was selected as the final casting process for the validation study. This decision underscores the principle that feeding thick sections through gates connected to an open runner system is generally more effective than relying solely on top risers, especially in low-pressure casting where the applied pressure enhances feed metal delivery.
5.5 Mold and Core Design for 3D Printing
Traditional molding processes are constrained by pattern design, draft angles, and parting lines. In contrast, 3D sand printing eliminates these restrictions, enabling integrated and optimized mold/core design. For the shell casting, the mold package was designed to consist of seven sand mold blocks and two sand cores. The complex internal cavity-forming core was printed as a single piece, eliminating the need for multiple core boxes and reducing assembly errors. The core positioning was achieved using both vertical and horizontal core prints to prevent displacement or rotation during pouring.
The use of 3D printing allowed the integration of narrow, elongated vent channels within the core structure. These channels facilitated the evacuation of gases generated during pouring, reducing the risk of gas porosity. In conventional molding, such internal vents are very difficult to create. The assembly clearance between the 3D-printed mold blocks was controlled at 0.1 mm to 0.2 mm, significantly better than the 0.5 mm clearance typical of conventionally assembled molds. The sand-to-metal ratio exceeded 81.6 mm. After printing, the molds were cleaned, coated with a water-based zirconia coating, and stoved at 90 °C for 1 hour to remove residual moisture.
5.6 Casting Trials and Post-Processing
Following the process design and simulation, the shell casting was trial-produced using 3D-printed sand molds and low-pressure die casting. The mold package was preheated to 100 °C for 2 hours and then placed in the low-pressure casting machine. The pressure parameters for the casting operation were set as follows: an initial pressure of 28 kPa for 21 s to fill the sprue, a filling pressure of 40 kPa for 9 s to fill the mold cavity, a pressure increase to 50 kPa for 3 s to complete the solidification shell, and a holding pressure of 50 kPa for 500 s to feed the solidification shrinkage. The total metallurgical weight consumed for the casting was approximately 45 kg.
After solidification and cooling, the casting was shaken out, and the gating system was removed using plasma cutting. The casting was then subjected to T6 heat treatment under the same conditions as described earlier. The heat-treated casting was machined to its final dimensions. The entire cycle from process design to trial casting completion was accomplished in 4 days, which is approximately 70% shorter than the typical timeline required by conventional casting processes involving pattern manufacturing.
5.7 Inspection and Testing of Trial Castings
5.7.1 Dimensional Inspection
Dimensional inspection was carried out using a Handyscan Black I Elite handheld 3D laser scanner. The scanning results demonstrated that the dimensional deviation of the casting remained within ±0.9 mm, which satisfies the HB 6103-86 CT9 requirements. This level of accuracy was achieved due to the high dimensional fidelity of the 3D-printed sand molds and the careful assembly alignment.
5.7.2 Radiographic Testing
X-ray radiography was performed on the heat-treated casting to evaluate internal soundness. The inspection results showed no significant casting defects in the key structural areas. Specifically, the thin-walled tubular portions were free of shrinkage porosity, and the thick joints at the assembly faces displayed no detectable internal porosity or inclusions. The absence of major internal defects confirmed that both the 3D sand printing process and the low-pressure casting parameters were properly optimized.
5.7.3 Leak Testing
The machined casting was subjected to an air-tightness test. All openings were sealed with flanges except for a single air inlet. The casting was immersed in water and subjected to a test pressure of 0.18 MPa for 13–16 minutes. No bubbles were observed, indicating that the casting was pressure-tight and free from pinhole porosity that could lead to leakage in service. This result further confirms the high metallurgical quality of the casting.
5.7.4 Microstructural Evaluation
Metallographic samples were cut from specific locations of the shell casting. After standard grinding, polishing, and etching procedures, the microstructure was observed under an optical microscope. The α-Al matrix exhibited a fine, uniform, and equiaxed morphology. The eutectic silicon particles appeared as discrete short fibrous particles distributed uniformly in the aluminum matrix. The measured cellular grain size was approximately 37 μm, and the secondary dendrite arm spacing was approximately 30 μm. The application of a 50 kPa intensification pressure during low-pressure casting contributed to grain refinement and the reduction of microporosity.
5.7.5 Mechanical Properties
Tensile specimens were excised from the casting body and tested according to GB/T 228.1-2021. The measured tensile strength was 323 MPa, the elongation at break was 2.8%, and the Brinell hardness was 98 HB. The tensile fracture surfaces exhibited a mixed fracture mode consisting of cleavage facets and dimples, consistent with a predominantly brittle but acceptable fracture behavior for a precipitation-hardened aluminum alloy. The combination of strength and ductility confirms that the shell casting meets its service requirements.
6. Conclusions
This research systematically investigated the optimization of 3D sand printing process parameters and the development of a low-pressure die casting process for complex thin-walled ZL101A aluminum alloy shell castings. The following conclusions can be drawn from this study:
(1) The tensile strength of 3D-printed sand molds is primarily governed by the resin inkjet content, followed by the printing layer thickness. A higher resin content increases the number of binder bridges between the sand grains, thereby improving strength. However, it also increases gas evolution and dimensional deviation. The curing agent content has a relatively weak influence on tensile strength under the tested conditions. The response surface methodology successfully established reliable regression models for the tensile strength, gas evolution, and dimensional deviation of 3D-printed sand molds. The optimal process parameters were found to be a resin inkjet content of 1.46% by weight of sand, a layer thickness of 0.35 mm, and a curing agent content of 0.25% by weight of sand. Under these conditions, the tensile strength reached 2.13 MPa, the gas evolution was 9.32 mL/g, and the dimensional deviation was ±0.24 mm. This approach reduced binder and curing agent consumption while increasing printing efficiency, providing both economic and environmental benefits.
(2) In low-pressure die casting, the pouring temperature and preheating temperature of the 3D-printed sand mold significantly affect the microstructure and mechanical properties of ZL101A alloy. A pouring temperature range of 720 °C to 740 °C promotes the formation of fine dendritic grains with well-developed secondary arms. Alloy cast at 720 °C exhibited a tensile strength of 326 MPa and an elongation of 2.8%. A sand mold preheating temperature between 80 °C and 100 °C was identified as optimal for balancing filling capability and microstructural refinement. Under these conditions, the alloy achieved a tensile strength of 337 MPa and an elongation of 3.6%. Comparisons between conventionally prepared and 3D-printed sand molds demonstrated that the 3D-printed sand molds produce finer and more uniform microstructures, yielding superior mechanical properties and better process stability.
(3) The combination of 3D sand printing technology and low-pressure die casting was successfully applied to produce a thin-walled complex shell casting. The gating system was designed with a conformal structure, featuring a combination of vertical slot gates, stepped gates, and vertical tubular gates. The cross-sectional area ratio was established as ΣAstraight:ΣArunner:ΣAingate = 1.0:1.5:1.8, and the distance between the ingates and casting ranged from 26.5 mm to 42.2 mm. The casting simulation using ProCAST software demonstrated that gate-fed feeding of thick sections is superior to riser-fed feeding alone. Connecting the risers to the runner system increased the feeding distance and reduced the risk of shrinkage defects at the riser roots.
(4) The 3D-printed shell casting trial was completed within 4 days, representing a nearly 70% reduction in lead time compared to traditional tooling and casting approaches. Dimensional measurements confirmed that the casting conforms to HB 6103-86 CT9 specification, with all dimensional deviations within ±0.9 mm. X-ray inspection showed no significant internal defects, and leak testing at 0.18 MPa confirmed excellent air-tightness. The casting achieved a tensile strength of 323 MPa, an elongation of 2.8%, and a Brinell hardness of 98 HB. The microstructural analysis revealed a fine, uniform, and dense dendritic morphology, ensuring that the casting satisfied all operational performance requirements.
In summary, the integration of 3D sand printing technology with low-pressure die casting provides a powerful and reliable route for the rapid development and production of complex thin-walled aluminum alloy castings. This approach not only shortens the product development cycle but also improves dimensional accuracy, mechanical performance, and overall process sustainability. The findings of this study provide valuable theoretical guidance and practical experience for broader industrial applications of 3D sand printing in the aerospace and precision machinery sectors.