
Sand casting remains one of the most widely used manufacturing processes for producing metal components, yet its energy efficiency is often limited by the large amount of heat dissipated during the cooling stage. In modern sustainable manufacturing, recovering this waste heat can significantly reduce energy consumption and carbon emissions. The emergence of 3D sand printing technology has brought new possibilities for mold design, enabling more complex and optimized structures that were previously impossible with conventional methods. In this paper, I focus on the integration of thermoelectric generation with 3D sand printing to recover waste heat from the sand mold surface during the cooling phase. I first propose a recovery method based on thermoelectric devices, then develop a prediction model for the total recoverable energy, and finally propose an optimized sand mold structure that enhances the recovery performance. The study includes detailed thermal resistance analysis, numerical simulations, and experimental validation on two different castings. The results demonstrate that the proposed approach can effectively recover heat and improve energy utilization in sand casting.
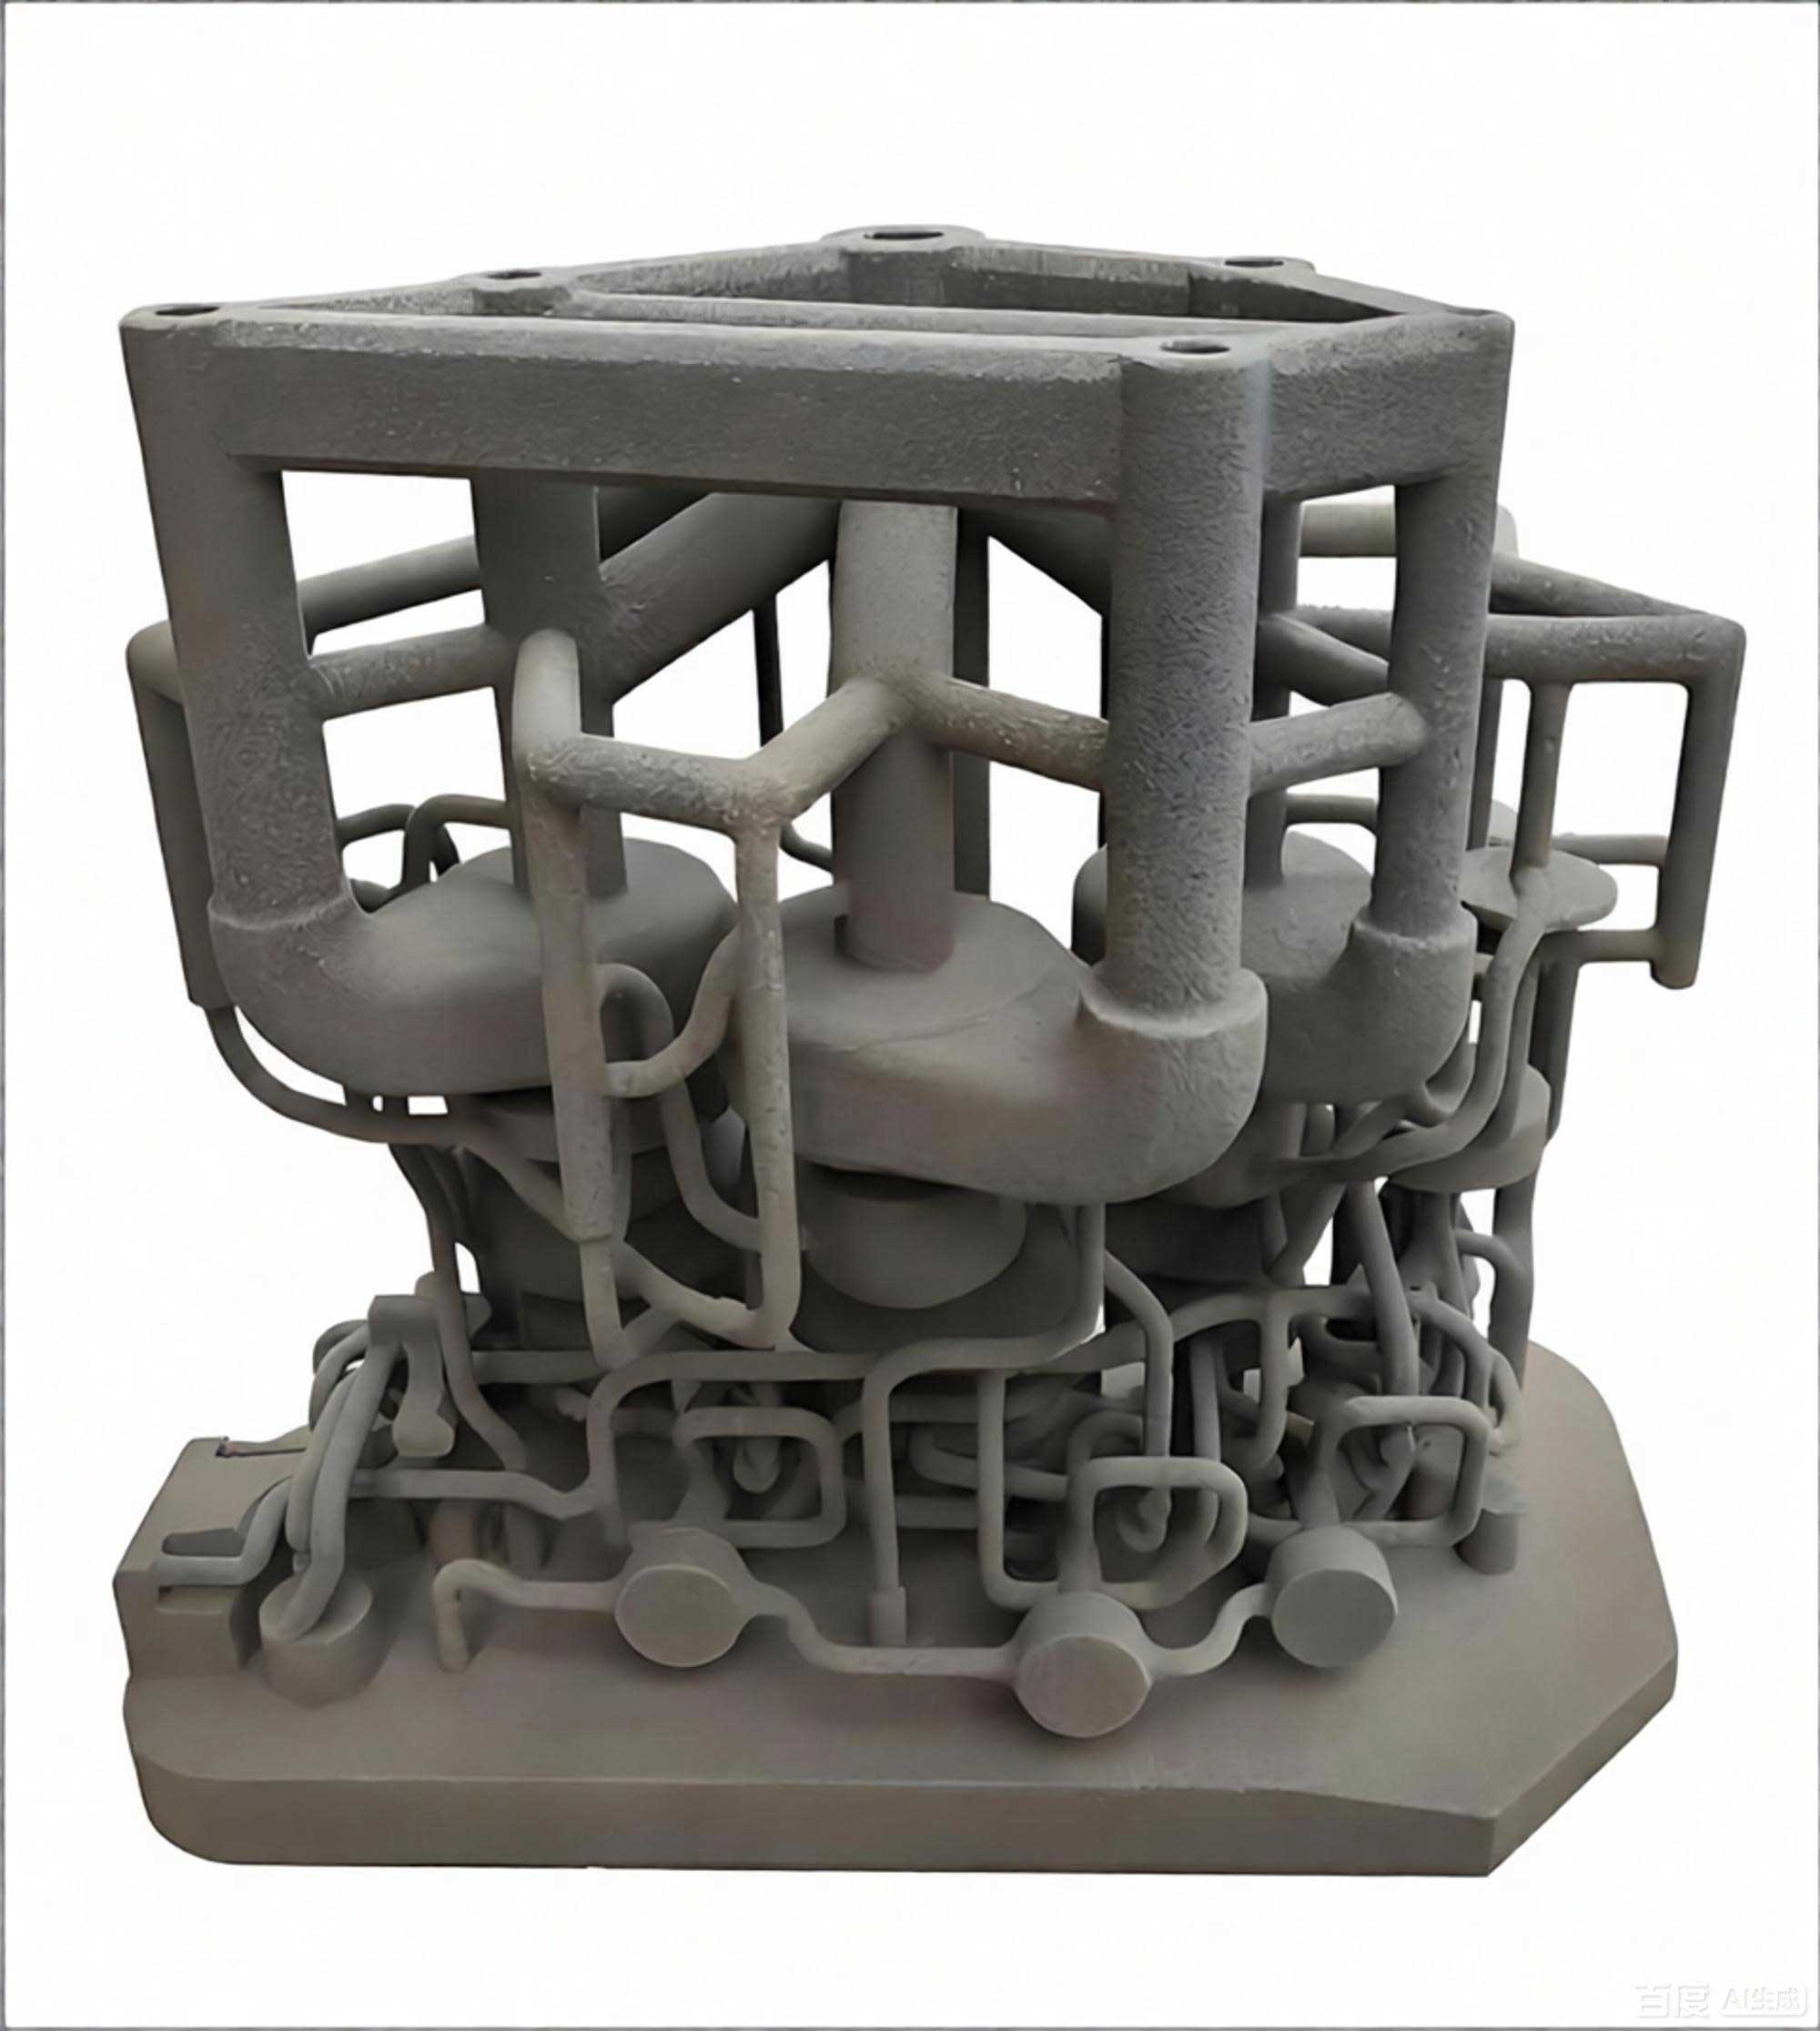
3D sand printing technology has attracted increasing attention in the casting industry due to its ability to produce complex molds without pattern equipment. The technology also supports lightweight mold structures, which can reduce material usage and improve casting quality. A typical 3D printed sand mold is shown in the following figure:
Introduction
The manufacturing sector consumes a significant share of global energy, and foundry processes are among the most energy-intensive industrial activities. It is reported that the average energy utilization rate in Chinese foundries is below 50%, and the energy consumption per ton of castings is almost double that of developed countries. Traditional sand casting involves melting metal, pouring it into a mold, and allowing it to cool. During cooling, the metal releases a large amount of heat, which is dissipated into the surrounding environment and lost. If this waste heat can be recovered, the overall energy efficiency of sand casting would be improved considerably.
Waste heat recovery techniques include organic Rankine cycles, Kalina cycles, heat exchangers, and thermoelectric generation. Among these, thermoelectric generation (TEG) offers distinct advantages for distributed and small-scale heat recovery: it has no moving parts, works over a wide temperature range, and can be attached directly to a hot surface. The use of TEG for recovering waste heat from casting processes has been explored in several studies, but most applications have been limited to fixed installations on furnaces or production lines. Direct recovery from sand mold surfaces has rarely been investigated. The reason is that traditional sand molds are usually confined in flasks, and their surfaces are rough and inaccessible. However, with the advent of 3D sand printing, molds can be produced without flasks, with smooth surfaces and high dimensional accuracy. This makes TEG more applicable because intimate thermal contact between the thermoelectric module and the heat source is essential for efficient conversion.
The aim of this research is to develop a comprehensive method for recovering the surface waste heat of 3D sand printed molds during the cooling stage using thermoelectric generation. Specific objectives are: (1) to design a thermoelectric recovery device suitable for sand mold surfaces; (2) to establish a prediction model for the total recovered electric energy; and (3) to propose a sand mold structural optimization scheme that increases the recovered energy. The method is validated through casting experiments on two industrial parts: a cover casting and an engine block casting.
Proposed Recovery Method
Thermoelectric Generation Principle
Thermoelectric generation is based on the Seebeck effect, which states that a voltage is generated when two dissimilar conductors are joined at two junctions maintained at different temperatures. The open-circuit voltage is proportional to the temperature difference:
$$U_s = \alpha_s (T_{s1} – T_{s2})$$
where \(U_s\) is the Seebeck voltage, \(\alpha_s\) is the Seebeck coefficient, and \(T_{s1}\), \(T_{s2}\) are the temperatures of the hot and cold junctions. A thermoelectric module consists of many p-n junctions connected electrically in series and thermally in parallel, sandwiched between ceramic substrates. When a temperature difference is maintained across the module, it produces electrical power in an external load.
Feasibility Analysis
During the cooling stage of a sand mold, the metal solidifies and cools, releasing heat that raises the mold surface temperature. Typical mold surface temperatures can range from tens to hundreds of degrees Celsius depending on the casting size and wall thickness. For the thermoelectric device to work, the hot side must be in contact with the mold surface while the cold side is kept at a lower temperature by a heat sink. The temperature difference drives the power generation. Because 3D printed sand molds have smooth surfaces and no flask, the thermoelectric modules can be placed directly on the mold surface with minimal thermal resistance. This creates favorable conditions for waste heat recovery.
Device Design
The recovery device consists of three main components: a hot-side heat spreader, thermoelectric modules, and a cold-side heat sink. In the proposed design, the heat spreader is a 1 mm thick copper plate that equalizes the temperature across the modules and protects the fragile ceramic surfaces of the modules. The thermoelectric modules are arranged in groups: several modules are connected in series to increase voltage, and groups are connected in parallel to improve reliability and current capacity. This combination balances output voltage and system robustness.
The cold-side heat sink is an aluminum finned radiator that cools the cold side by natural convection. Compared with water cooling or forced-air cooling, natural convection is simpler, lighter, and more reliable in the dusty environment of a foundry. The radiator is attached to the cold side with thermally conductive silicone adhesive, which also serves to reduce contact resistance. The device is placed on the mold surface with a supporting frame. No clamps are needed, making installation and removal faster.
Arrangement Method
It is impractical to cover the entire mold surface with thermoelectric modules. Therefore, a systematic arrangement method is proposed. First, based on the casting simulation results (e.g. from ProCAST), the temperature field on the mold surface is identified. High-temperature regions with sufficient area are selected as recovery zones. Within each zone, the highest temperature node is used as a benchmark, and the center of the recovery device is aligned with that benchmark. If the zone temperature exceeds the maximum operating temperature of the thermoelectric modules, installation is delayed until the temperature has dropped below the safe limit. This method ensures that the recovery device is placed at the most suitable location and operates within its safe range.
Prediction Model for Recovered Energy
Heat Transfer Path
Figure below illustrates the heat flow from the sand mold surface to the ambient air through the recovery device. The path includes the copper heat spreader, the thermal interface silicone, the thermoelectric module, another layer of silicone, and the finned heat sink. Under steady-state conditions, the heat flux \(\Phi\) can be expressed using the thermal resistance network:
$$\Phi = \frac{T_s – T_{air}}{R_{plate} + 2R_{si} + R_{TEG} + R_{sink} + R_{conv}} = \frac{\Delta T_{TEG}}{R_{TEG}}$$
where \(T_s\) is the sand mold surface temperature, \(T_{air}\) is the ambient temperature, \(R_{plate}\) is the heat spreader resistance, \(R_{si}\) is the silicone resistance, \(R_{TEG}\) is the thermoelectric module resistance, \(R_{sink}\) is the heat sink base resistance, and \(R_{conv}\) is the convective resistance. The temperature difference across the thermoelectric module is:
$$\Delta T_{TEG} = \frac{R_{TEG} (T_s – T_{air})}{R_{plate} + 2R_{si} + R_{TEG} + R_{sink} + R_{conv}}$$
Thermal Resistance Models
Each thermal resistance is calculated from the geometry and material properties. The heat spreader resistance is:
$$R_{plate} = \frac{\delta_{plate}}{A \lambda_{plate}}$$
where \(\delta_{plate}\) is the thickness, \(\lambda_{plate}\) is the thermal conductivity, and \(A\) is the area per thermoelectric module. Similarly, the silicone layer resistance is:
$$R_{si} = \frac{\delta_{si}}{A \lambda_{si}}$$
The thermoelectric module resistance is obtained by analyzing its internal structure. The module consists of ceramic substrates, copper conductors, and p-n elements. The total resistance is:
$$R_{TEG} = 2R_{ce} + \frac{1}{N_{PN}}\left(2R_{cu} + \frac{R_P R_N}{R_P + R_N}\right)$$
where \(R_{ce}\) is the ceramic substrate resistance, \(R_{cu}\) is the copper conductor resistance, \(R_P\) and \(R_N\) are the p-type and n-type element resistances, and \(N_{PN}\) is the number of p-n pairs. These resistances are individually calculated as:
$$R_{ce} = \frac{\delta_{ce}}{A \lambda_{ce}}, \quad R_{cu} = \frac{\delta_{cu}}{A_{cu} \lambda_{cu}}, \quad R_P = \frac{\delta_{PN}}{A_{PN} \lambda_P}, \quad R_N = \frac{\delta_{PN}}{A_{PN} \lambda_N}$$
For the finned heat sink, the total resistance is divided into the base resistance and the fin resistance. The base resistance is:
$$R_{base} = \frac{\delta_{base}}{A \lambda_{base}}$$
The fin resistance is derived from fin efficiency \(\eta_f\). For straight rectangular fins, the actual heat transfer from the fins is:
$$\Phi_f = \eta_f h A_f n \Delta T_f$$
where \(h\) is the convection coefficient, \(A_f\) is the fin surface area, and \(n\) is the number of fins. The equivalent resistance of the fin area and the unfinned area is combined as:
$$R_{f} = \frac{1}{\eta_f h n A_f + A_b h}$$
The fin efficiency for a rectangular fin with an adjusted length \(L’\) is:
$$\eta_f = \frac{\tanh(m L’)}{m L’}$$
where \(m = \sqrt{\frac{hP}{\lambda_l A_l}}\), \(P\) is the fin perimeter, \(\lambda_l\) is the fin thermal conductivity, and \(A_l\) is the fin cross-sectional area. The adjusted length \(L’ = L + b/2\), where \(L\) is the fin height and \(b\) is the fin thickness.
Sand Mold Surface Temperature
The temperature of the recovery zone on the sand mold surface changes with time. After pouring, the temperature rises rapidly and then falls gradually. For a given casting and mold geometry, the average zone temperature can be extracted from numerical simulation and fitted as a function of time:
$$T_s = f_s(t)$$
This function can be a rational polynomial obtained by regression of the simulation data.
Total Recovered Energy
According to the Seebeck effect, the open-circuit voltage of a single module is \(U = \alpha \Delta T_{TEG}\). When a load resistor \(R_{load}\) is connected, the output power of one module is:
$$P_1 = \frac{U^2}{R_{load}} = \frac{\alpha^2 \Delta T_{TEG}^2}{R_{load}}$$
If the recovery device has \(n_s\) modules in series in each group and \(n_p\) groups in parallel, the total power is:
$$P = \frac{n_p n_s^2 \alpha^2 \Delta T_{TEG}^2}{R_{load}}$$
Integrating this power over the recovery time \(t_1\) gives the total recovered electric energy:
$$E = \int_{t_0}^{t_1} P \, dt = \frac{n_p n_s^2 \alpha^2 R_{TEG}^2}{R_{load} \left( R_{plate} + 2R_{si} + R_{TEG} + R_{sink} + R_{conv} \right)^2} \int_{t_0}^{t_1} \left[ f_s(t) – T_{air} \right]^2 dt$$
This is the final prediction model for the recovered energy.
Model Validation
To validate the model, a small-scale experiment was first conducted using a single thermoelectric module with an area of 40 mm × 40 mm. The module was attached to a 3D printed sand mold for an impeller casting. The mold surface temperature was obtained from simulation, and the predicted voltage was compared with the measured voltage over the cooling time. The average voltage error was 12.59%, corresponding to a prediction accuracy of 91.33%. This confirmed that the thermal resistance model and temperature fitting approach are valid for estimating the recovered energy. Details of the validation parameters are listed in Table 1.
| Symbol | Description | Value |
|---|---|---|
| \(\alpha\) | Seebeck coefficient | 0.01748 V/K |
| \(T_{air}\) | Ambient temperature | 20 °C |
| \(\delta_{si}\) | Silicone layer thickness | 0.5 mm |
| \(\lambda_{si}\) | Silicone thermal conductivity | 15 W/mK |
| \(\delta_{base}\) | Heat sink base thickness | 5 mm |
| \(A\) | Module area | 1600 mm² |
| \(\lambda_{base}\) | Heat sink base conductivity | 237 W/mK |
| \(A_f\) | Fin surface area | 2088 mm² |
| \(h\) | Convection coefficient | 30 W/m²K |
| \(n\) | Number of fins per unit area | 10 |
| \(A_b\) | Unfinned area | 720 mm² |
| \(L\) | Fin height | 25 mm |
| \(b\) | Fin thickness | 3 mm |
| \(P\) | Fin perimeter | 52.2 mm |
| \(\lambda_l\) | Fin thermal conductivity | 237 W/mK |
| \(A_l\) | Fin cross-sectional area | 55 mm² |
| \(\delta_{ce}\) | Ceramic substrate thickness | 0.8 mm |
| \(\lambda_{ce}\) | Ceramic substrate conductivity | 22 W/mK |
| \(\delta_{cu}\) | Copper conductor thickness | 0.4 mm |
| \(A_{cu}\) | Copper conductor area | 826.56 mm² |
| \(\lambda_{cu}\) | Copper conductivity | 377 W/mK |
| \(\delta_{PN}\) | PN element thickness | 1.8 mm |
| \(A_{PN}\) | PN element area | 212.94 mm² |
| \(\lambda_P\) | P-type thermal conductivity | 1.5 W/mK |
| \(\lambda_N\) | N-type thermal conductivity | 2.5 W/mK |
| \(t_1\) | Recovery time | 21475 s |
Sand Mold Structural Optimization for Enhanced Recovery
Influence of Geometric Parameters
The total recovered energy depends strongly on the temperature history of the mold surface. The mold wall thickness is the most influential geometric parameter because it controls the heat transfer rate from the molten metal to the surface. Thinner walls allow the surface to reach higher temperatures, improving the thermoelectric conversion efficiency. However, reducing wall thickness may compromise mechanical strength. In traditional dense sand molds, the wall thickness is usually selected conservatively. In 3D sand printed molds, the structure can be designed with a thin shell reinforced by lattice or rib supports, thereby reducing the effective wall thickness without sacrificing strength. The mold structure also affects the mounting of the recovery device and the heat dissipation path.
Comparison of Different Sand Mold Structures
To evaluate the effect of different structures, a figure-eight test casting was designed. The casting had a rectangular cross-section and was oriented so that one side of the mold surface served as the recovery zone. The recovery device used two 40 mm × 40 mm modules connected in series. The thermoelectric parameters were the same as those in Table 1 except for the Seebeck coefficient, which was 0.01748, and the area was 1600 mm². Four types of 3D printed sand mold structures were analyzed: truss, rib, porous, and hollow. For each structure, the wall thickness and support dimensions were calculated according to strength requirements. Casting simulations were performed using ProCAST, and the predicted recovered energy was obtained using the prediction model.
| Structure | Cooling time (s) | Maximum surface temperature (°C) | Recovered energy (J) |
|---|---|---|---|
| Traditional dense | 3361 | 145.8 | 66.32 |
| Truss | 2858 | 303.96 | 100.56 |
| Rib (unoptimized) | 2586 | 150.14 | 40.34 |
| Rib (with flat recovery surface) | 2603 | 181.81 | 73.98 |
| Porous | 1491 | 54.58 | 1.88 |
| Hollow | 3452 | 154.70 | 74.14 |
As shown in Table 2, the truss structure yielded the highest recovered energy (100.56 J), which was 51.6% more than the traditional dense structure. The rib structure initially performed poorly because the rough surface reduced the effective contact area with the recovery device. After creating a flat recovery surface on the rib structure, the recovered energy increased significantly. The porous structure cooled too quickly and had very low surface temperatures, making it unsuitable for waste heat recovery. The hollow structure increased the recovery compared with the dense structure, but not as much as the truss structure. Therefore, the truss structure was selected as the basis for the optimized design.
Optimized Sand Mold Design with Truss Structure
The optimized design method follows these steps. First, the casting simulation of a traditional dense mold is used to identify the potential recovery zones. Then, the sand mold is redesigned as a truss structure with a thin shell. The shell thickness is calculated from the static pressure of molten metal and the strength of the sand at elevated temperature. The static pressure is:
$$F_1 = \int \rho g H \, dS_1$$
where \(\rho\) is the metal density, \(g\) is gravitational acceleration, \(H\) is the static head, and \(S_1\) is the contact area. The minimum cross-sectional area of the shell is:
$$S_2 = \frac{F_1}{\sigma(T)}$$
where \(\sigma(T)\) is the tensile strength of the sand. The minimum shell thickness is then:
$$d_{min} > \frac{S_2}{l_{min}}$$
where \(l_{min}\) is the minimum perimeter of the casting cross-section. The dynamic pressure during pouring is higher than the static pressure by 30–50%:
$$F_2 = (1.3 \sim 1.5) F_1$$
The additional force must be carried by the support structure, giving the required total cross-sectional area of the supports:
$$S_3 = \frac{F_2 – F_1}{\sigma(T)}$$
If the supports are square columns of side \(r\), then:
$$r > \sqrt{\frac{S_3}{n}}$$
where \(n\) is the number of columns. In the design, the positions of the truss supports are adjusted to avoid interfering with the recovery device. If the distance between the shell and the support is large, a support platform is added for the recovery device. The shell surface in the recovery zone is made flat so that the recovery device can make full contact.
Support and Fixing Scheme
In the optimized truss mold, the truss elements themselves act as a positioning frame for the recovery device. The recovery device is placed on a horizontal truss and laterally positioned by vertical trusses. When necessary, a small platform is extended from the truss to support the device. In addition, a U-shaped adjustable bracket was designed to press the recovery device against the mold surface. The bracket is made of aluminum profiles and screws, and it hooks onto the vertical trusses on both sides of the device. A long screw in the middle applies a controlled compression force. This scheme eliminates the need for separate support stands and speeds up the installation process.
Case Study and Experimental Results
Industrial Castings and Sand Mold Designs
Two industrial parts were selected for validation: a cover casting and an engine block casting. Both were made of A356 aluminum alloy. The cover casting had a volume of 377,407 mm³ and maximum dimensions of 180 mm × 180 mm × 30 mm. It was cast with two cavities in one mold. The engine block casting had a volume of 4,340,380 mm³ and dimensions of 392 mm × 257 mm × 202 mm. The casting process parameters are given in Table 3.
| Parameter | Cover casting | Engine block |
|---|---|---|
| Model shrinkage | 1% | 1% |
| Sprue cross-section | 406 mm² | 616 mm² |
| Runner cross-section | 223 mm² | 528 mm² |
| Ingate cross-section | 146 mm² | 74 mm² |
| Number of risers | 6 | 5 |
| Pouring temperature | 750 °C | 750 °C |
| Pouring time | 5 s | 12 s |
| Interfacial heat transfer coefficient | 500 W/m²K | 500 W/m²K |
Traditional dense sand molds were first designed according to conventional rules. The cover mold had external dimensions of 460 mm × 303 mm × 180 mm and a volume of 24,021,773 mm³. The engine block mold had dimensions of 530 mm × 442 mm × 342 mm and a volume of 74,988,395 mm³. Casting simulations were run in ProCAST with furan resin sand as the mold material and natural air cooling. The cooling was stopped when the casting temperature dropped below 100 °C. The simulation results showed acceptable casting quality with overall defects below 5%, verifying that the molds satisfied production requirements.
Recovery Device Layout
For the cover mold, the temperature field from the simulation revealed five distinct high-temperature zones on the side surfaces. The recovery device was configured with 14 thermoelectric modules in total: four zones each used a 120 mm × 40 mm arrangement (3 modules), and one zone used an 80 mm × 40 mm arrangement (2 modules). The modules were connected as two parallel groups, each with seven modules in series. The total covered area was 0.0224 m². The maximum zone temperature was 130.71 °C and the average maximum was 100.19 °C, both below the device limit of 200 °C. Therefore, the device could operate for the entire cooling time of 7,475 s.
For the engine block mold, three large high-temperature zones were selected on the front and two side surfaces. The front zone used a 120 mm × 80 mm arrangement (6 modules), and each side zone used a 120 mm × 120 mm arrangement (9 modules). The total device comprised 24 modules connected in four parallel groups, each with six modules in series. The total covered area was 0.0384 m². The maximum zone temperature was 124.5 °C and the average maximum was 106.23 °C, allowing full-time recovery over the cooling period of 20,994 s.
Optimized Truss Mold Design for the Two Parts
Using the optimization method described in the previous section, new truss sand molds were designed for both castings. For the cover casting, the shell thickness was calculated to be 10 mm, and ten vertical truss columns of 20 mm × 20 mm were used. The optimized mold had external dimensions of 450 mm × 281 mm × 175 mm and a volume of 7,678,348 mm³, which was 68.04% smaller than the traditional mold. The weight was reduced by 22.85 kg. The cooling time was 4,583 s, a reduction of 38.69% compared with the dense mold. The maximum recovery zone temperature reached 460.77 °C, exceeding the safe limit, so the recovery device could only be installed after 1,763 s when the average zone temperature fell below 200 °C. The device worked for 2,820 s in total.
For the engine block casting, the shell thickness was 15 mm, and nine vertical truss columns of 30 mm × 30 mm were used. The optimized mold volume was 36,102,612 mm³, which was 51.9% smaller than the traditional mold, with a weight reduction of 54.36 kg. The cooling time was 9,904 s, a reduction of 52.8%. The recovery zones had a maximum temperature of 353.84 °C and an average maximum of 308.53 °C. The device was installed after 4,274 s and operated for 5,630 s.
Experimental Recovery Results
Actual casting experiments were conducted for both the traditional dense molds and the optimized truss molds. The ambient temperature was approximately 30–32 °C, and the load resistance was 100 Ω. The measured recovered energy values are summarized in Table 4.
| Casting | Mold structure | Recovery time (s) | Recovered energy (J) | Average power (W) |
|---|---|---|---|---|
| Cover | Traditional dense | 7475 | 1728 | 0.23 |
| Cover | Optimized truss | 2820 | 2936 | 1.04 |
| Engine block | Traditional dense | 20994 | 6703 | 0.32 |
| Engine block | Optimized truss | 5630 | 9752 | 1.73 |
The total recovered energy from all experiments was 21,119 J, demonstrating that the proposed method is practically feasible. The optimized truss molds significantly outperformed the traditional dense molds in terms of recovered energy and average power, even though the recovery time was much shorter.
Prediction Model Validation on Industrial Cases
The prediction model was further validated by comparing the predicted recovered energy with the measured values. The temperature histories of the recovery zones were extracted from the simulation results and fitted to rational functions. The model parameters were the same as those used in the small-scale validation (Table 1), except for the Seebeck coefficient which was 0.01506 for the industrial modules. The predicted and measured energy values are listed in Table 5.
| Casting | Mold structure | Measured (J) | Predicted (J) | Accuracy |
|---|---|---|---|---|
| Cover | Traditional dense | 1728 | 1621 | 93.8% |
| Cover | Optimized truss | 2936 | 2774 | 94.5% |
| Engine block | Traditional dense | 6703 | 6071 | 90.5% |
| Engine block | Optimized truss | 9752 | 8789 | 90.1% |
The average prediction accuracy was 92.2%. The predicted values were consistently slightly lower than the measured values, likely because the actual thermal conductivities of the sand and interface materials were lower than the theoretical values, leading to higher actual temperatures at the recovery surface and hence more power generation. Overall, the prediction model proved to be reliable for engineering design.
Optimization Effect
Comparing the traditional dense mold with the optimized truss mold, the recovered energy increased by 45% for the cover casting and by 70% for the engine block casting. The recovery time decreased by about 60–70%, while the average power increased by 3 to 4 times. Furthermore, the optimized truss molds reduced the casting cooling time by 40–50%, which enhances production efficiency. The lightweight structure also reduced material consumption and mold weight. These benefits directly contribute to the sustainable manufacturing goals of lower energy consumption and lower carbon emissions.
Conclusion
In this paper, I have presented a comprehensive study on the recovery of waste heat from the surface of 3D printed sand molds during the cooling stage using thermoelectric generation. The main contributions are summarized as follows:
- A waste heat recovery method based on thermoelectric generation was proposed, including the design of the recovery device and a systematic arrangement method. The device consists of a copper heat spreader, thermoelectric modules, and an aluminum fin heat sink, and is installed without clamps, making it suitable for foundry environments.
- A prediction model for the total recovered electric energy was established. The model uses a thermal resistance network and the Seebeck effect, combined with a fitted temperature history of the mold surface. The model was validated by experiments with an average accuracy of 92.2%.
- A sand mold structural optimization method was developed to enhance the recovered energy. Among the evaluated structures, the truss structure gave the highest recovery. The optimized truss molds increased the recovered energy by 45–70% compared with traditional dense molds, while reducing cooling time by about 40–50% and significantly reducing material usage.
The proposed method provides a new pathway for improving energy efficiency in sand casting. Future work could focus on integrating the recovered electricity into the foundry’s auxiliary systems, developing modular recovery devices for various mold sizes, and exploring active cooling strategies that combine waste heat recovery with forced cooling to further reduce cycle times.