
In the present work, I report a systematic optimization of the sand mold 3D printing forming process and its application to the production of a thin-walled impeller by low-pressure die casting. The central objective is to obtain a 3D printed sand mold that combines sufficient tensile strength with low gas evolution, while also reducing material consumption and improving printing efficiency. Throughout this investigation, the complete route is referred to as 3D printing sand casting, which includes binder jetting, layer-by-layer sand accumulation, mold assembly, metal pouring, and final quality inspection. I adopted the Box-Behnken response surface method because it provides a rational compromise between experimental effort and the ability to capture interaction effects among process variables. Instead of changing one parameter at a time, I varied the resin inkjet content, activator content, and printed layer thickness simultaneously within a designed experimental matrix. The measured responses were the tensile strength and gas evolution of the printed sand mold. The optimized process parameters were then used to build the sand core and mold for a complex aluminum impeller with thin sections. The casting was produced by low-pressure die casting and evaluated by visual inspection, dimensional measurement, and X-ray inspection. The results demonstrate that 3D printing sand casting is capable of delivering high-quality, complex thin-walled castings with less material waste and shorter lead times when the process is optimized in a statistically meaningful way.
Introduction and Background
The foundry industry has increasingly adopted additive manufacturing because 3D printing sand casting eliminates the need for expensive pattern tooling and allows the production of internal geometries that cannot be easily produced by conventional core blowing or hand molding. In a typical binder jetting process, pre-mixed sand is spread as a thin layer on a build platform. A print-head selectively deposits resin binder onto the sand bed, and the binder wets the sand grains and forms adhesive bridges. After the liquid resin cures, the sand grains are bonded together. The process is repeated layer by layer until the complete sand mold or core is formed. One of the major challenges in 3D printing sand casting is balancing the mechanical performance of the printed sand mold with its gas evolution behavior. The binder that provides strength is also the main source of gas when the mold is exposed to liquid metal. Therefore, a high resin content increases the tensile strength but also increases the risk of gas porosity in the casting. The activator content controls the curing kinetics of the resin, but excessive activator can also contribute to gas generation and may affect the final bond strength. The printed layer thickness determines the number of layers and therefore influences the printing time, the surface quality, and the uniformity of binder penetration. Because these factors interact with one another, a single-variable optimization approach is insufficient. I therefore used a multivariate statistical technique based on response surface methodology to identify the best combination of parameters for 3D printing sand casting.
The use of response surface methodology in foundry process optimization is attractive because it generates a mathematical model that relates the responses to the input variables. The quadratic model can describe curvature in the response and can be used to predict the optimum inside the experimental region. In this work, I applied a three-factor, three-level Box-Behnken design. This design is more efficient than a central composite design when the experimental region is approximately spherical. It requires fewer runs and still provides good estimates of the quadratic effects and two-factor interactions. The experimental data were analyzed using analysis of variance, and the statistical significance of each factor was evaluated through the F-test and P-value. The regression equations were then used to generate response surfaces and contour maps, from which I interpreted the effects of resin inkjet content, activator content, and layer thickness on tensile strength and gas evolution. Finally, a numerical optimization routine was used to find the parameter set that simultaneously satisfies the requirements for high strength and low gas evolution. The optimized parameters were applied to a real thin-walled impeller casting, thereby validating the entire 3D printing sand casting process chain.
Materials and Experimental Methods
Materials
The first step of my experimental program was to select suitable materials for 3D printing sand casting. The base sand was silica sand with a relatively high silicon dioxide content and a controlled particle size distribution. The binder was a furan resin specifically designed for 3D printing, and the activator was an acid curing agent that promotes polymerization of the furan resin. The properties of these materials are summarized in the following tables.
| Property | Value |
|---|---|
| Silicon dioxide content, w(SiO₂) | 90% – 92% |
| Average fineness | 64 – 72 μm |
| Loss on ignition (LOI) | ≤ 0.2% |
| Angularity coefficient | < 1.25 |
| Bulk density | 1.35 – 1.45 g/cm³ |
| Property of furan resin | Value |
|---|---|
| Viscosity | 6 – 8 mPa·s |
| Density | 1.12 – 1.18 g/cm³ |
| Electrical conductivity | ≤ 20 μS/cm |
| Surface tension | 35 – 40 mN/m |
| Free formaldehyde | ≤ 0.1% |
| Property of curing agent | Value |
|---|---|
| Viscosity | 20 – 40 mPa·s |
| Density | 1.30 – 1.35 g/cm³ |
| Total acidity | 25.5% – 26.5% |
| Free sulfuric acid | < 2.5% |
These materials were selected because they are widely used in industrial 3D printing sand casting and because their low viscosity is suitable for inkjet delivery. The low free formaldehyde content of the resin is also beneficial from an environmental and workplace safety perspective. The activator provides a controlled acid environment that accelerates the resin curing reaction after the binder is deposited on the sand bed. In 3D printing sand casting, the activator is often pre-mixed with the sand before printing, while the resin is selectively jetted by the print-head. This means that the activator content can be controlled during sand preparation, whereas the resin content is controlled by the printing strategy. Understanding how these two routes of addition affect the final sand mold performance is essential for robust process design.
Box-Behnken Experimental Design
To optimize the 3D printing sand casting process, I defined three independent variables: resin inkjet content (A), activator content (B), and printed layer thickness (C). The resin inkjet content is defined as the mass fraction of resin relative to the mass of sand in the printed layer region. The activator content is defined as the mass fraction of activator relative to the pre-mixed sand. The printed layer thickness is the vertical increment of each sand layer during printing. The ranges of these variables were selected based on preliminary experience with the printer and on the recommended operating window of the materials. The design used three levels for each factor, coded as −1, 0, and +1. The factor levels are shown in the table below.
| Level | Resin inkjet content A / % | Activator content B / % | Layer thickness C / mm |
|---|---|---|---|
| 1 | 1.35 | 0.20 | 0.25 |
| 2 | 1.50 | 0.30 | 0.35 |
| 3 | 1.65 | 0.40 | 0.45 |
For the coded variables, I used the standard transformation
$$x_i = \frac{X_i – X_{i,\text{center}}}{\Delta X_i}$$
where \(X_i\) is the natural value of the factor, \(X_{i,\text{center}}\) is the center level, and \(\Delta X_i\) is the step change between the center and high level. This transformation simplifies the regression analysis and reduces numerical problems associated with different units. The general second-order model used for the response surface analysis is
$$Y = \beta_0 + \sum_{i=1}^{3}\beta_i x_i + \sum_{i<j}\beta_{ij}x_i +=""
where \(Y\) is the response, \(\beta_0\) is the intercept, \(\beta_i\) are linear coefficients, \(\beta_{ij}\) are interaction coefficients, and \(\beta_{ii}\) are quadratic coefficients. The model was fitted using least squares regression. Analysis of variance was used to assess the significance of each term. The lack-of-fit test was also performed to verify that the quadratic model adequately represents the experimental data.
Casting Design for the Thin-Walled Impeller
The practical objective of this research was to manufacture a thin-walled impeller with complex internal channels. The overall envelope of the impeller is approximately 318 mm × 318 mm × 124 mm. The maximum wall thickness is about 44.5 mm, while the minimum wall thickness is only 1.2 mm. The impeller has sixteen blades arranged around the center, forming a complex internal cavity. The casting material is ZL101A aluminum alloy. Because the blade sections are thin and the wall thickness distribution is uneven, the casting is prone to incomplete filling and shrinkage porosity. I therefore selected low-pressure die casting as the filling and solidification method. A low-pressure casting system can gently feed liquid metal into the mold cavity under controlled pressure, which is beneficial for thin-walled sections. The gating system was designed as an open system with a ratio of cross-sectional areas
$$\sum A_{\text{sprue}} : \sum A_{\text{runner}} : \sum A_{\text{gate}} = 1.0 : 2.1 : 2.3$$
The sprue diameter was 40 mm. To improve feeding, the top of the sprue was enlarged and connected to stepped internal gates. The feeding distance between adjacent sprues was about 167 mm. This arrangement enhances both feeding and venting of the flange region. Chills were placed on the side walls at the upper and lower parts of the impeller. The chills accelerate solidification of the thicker regions and promote directional solidification, reducing the risk of localized shrinkage defects. A filter was placed at the bottom of the sprue to stabilize the melt flow and remove harmful oxide inclusions. The entire sand mold and core system was manufactured by 3D printing sand casting. The following illustration shows a representative mold layout used in such a workflow.
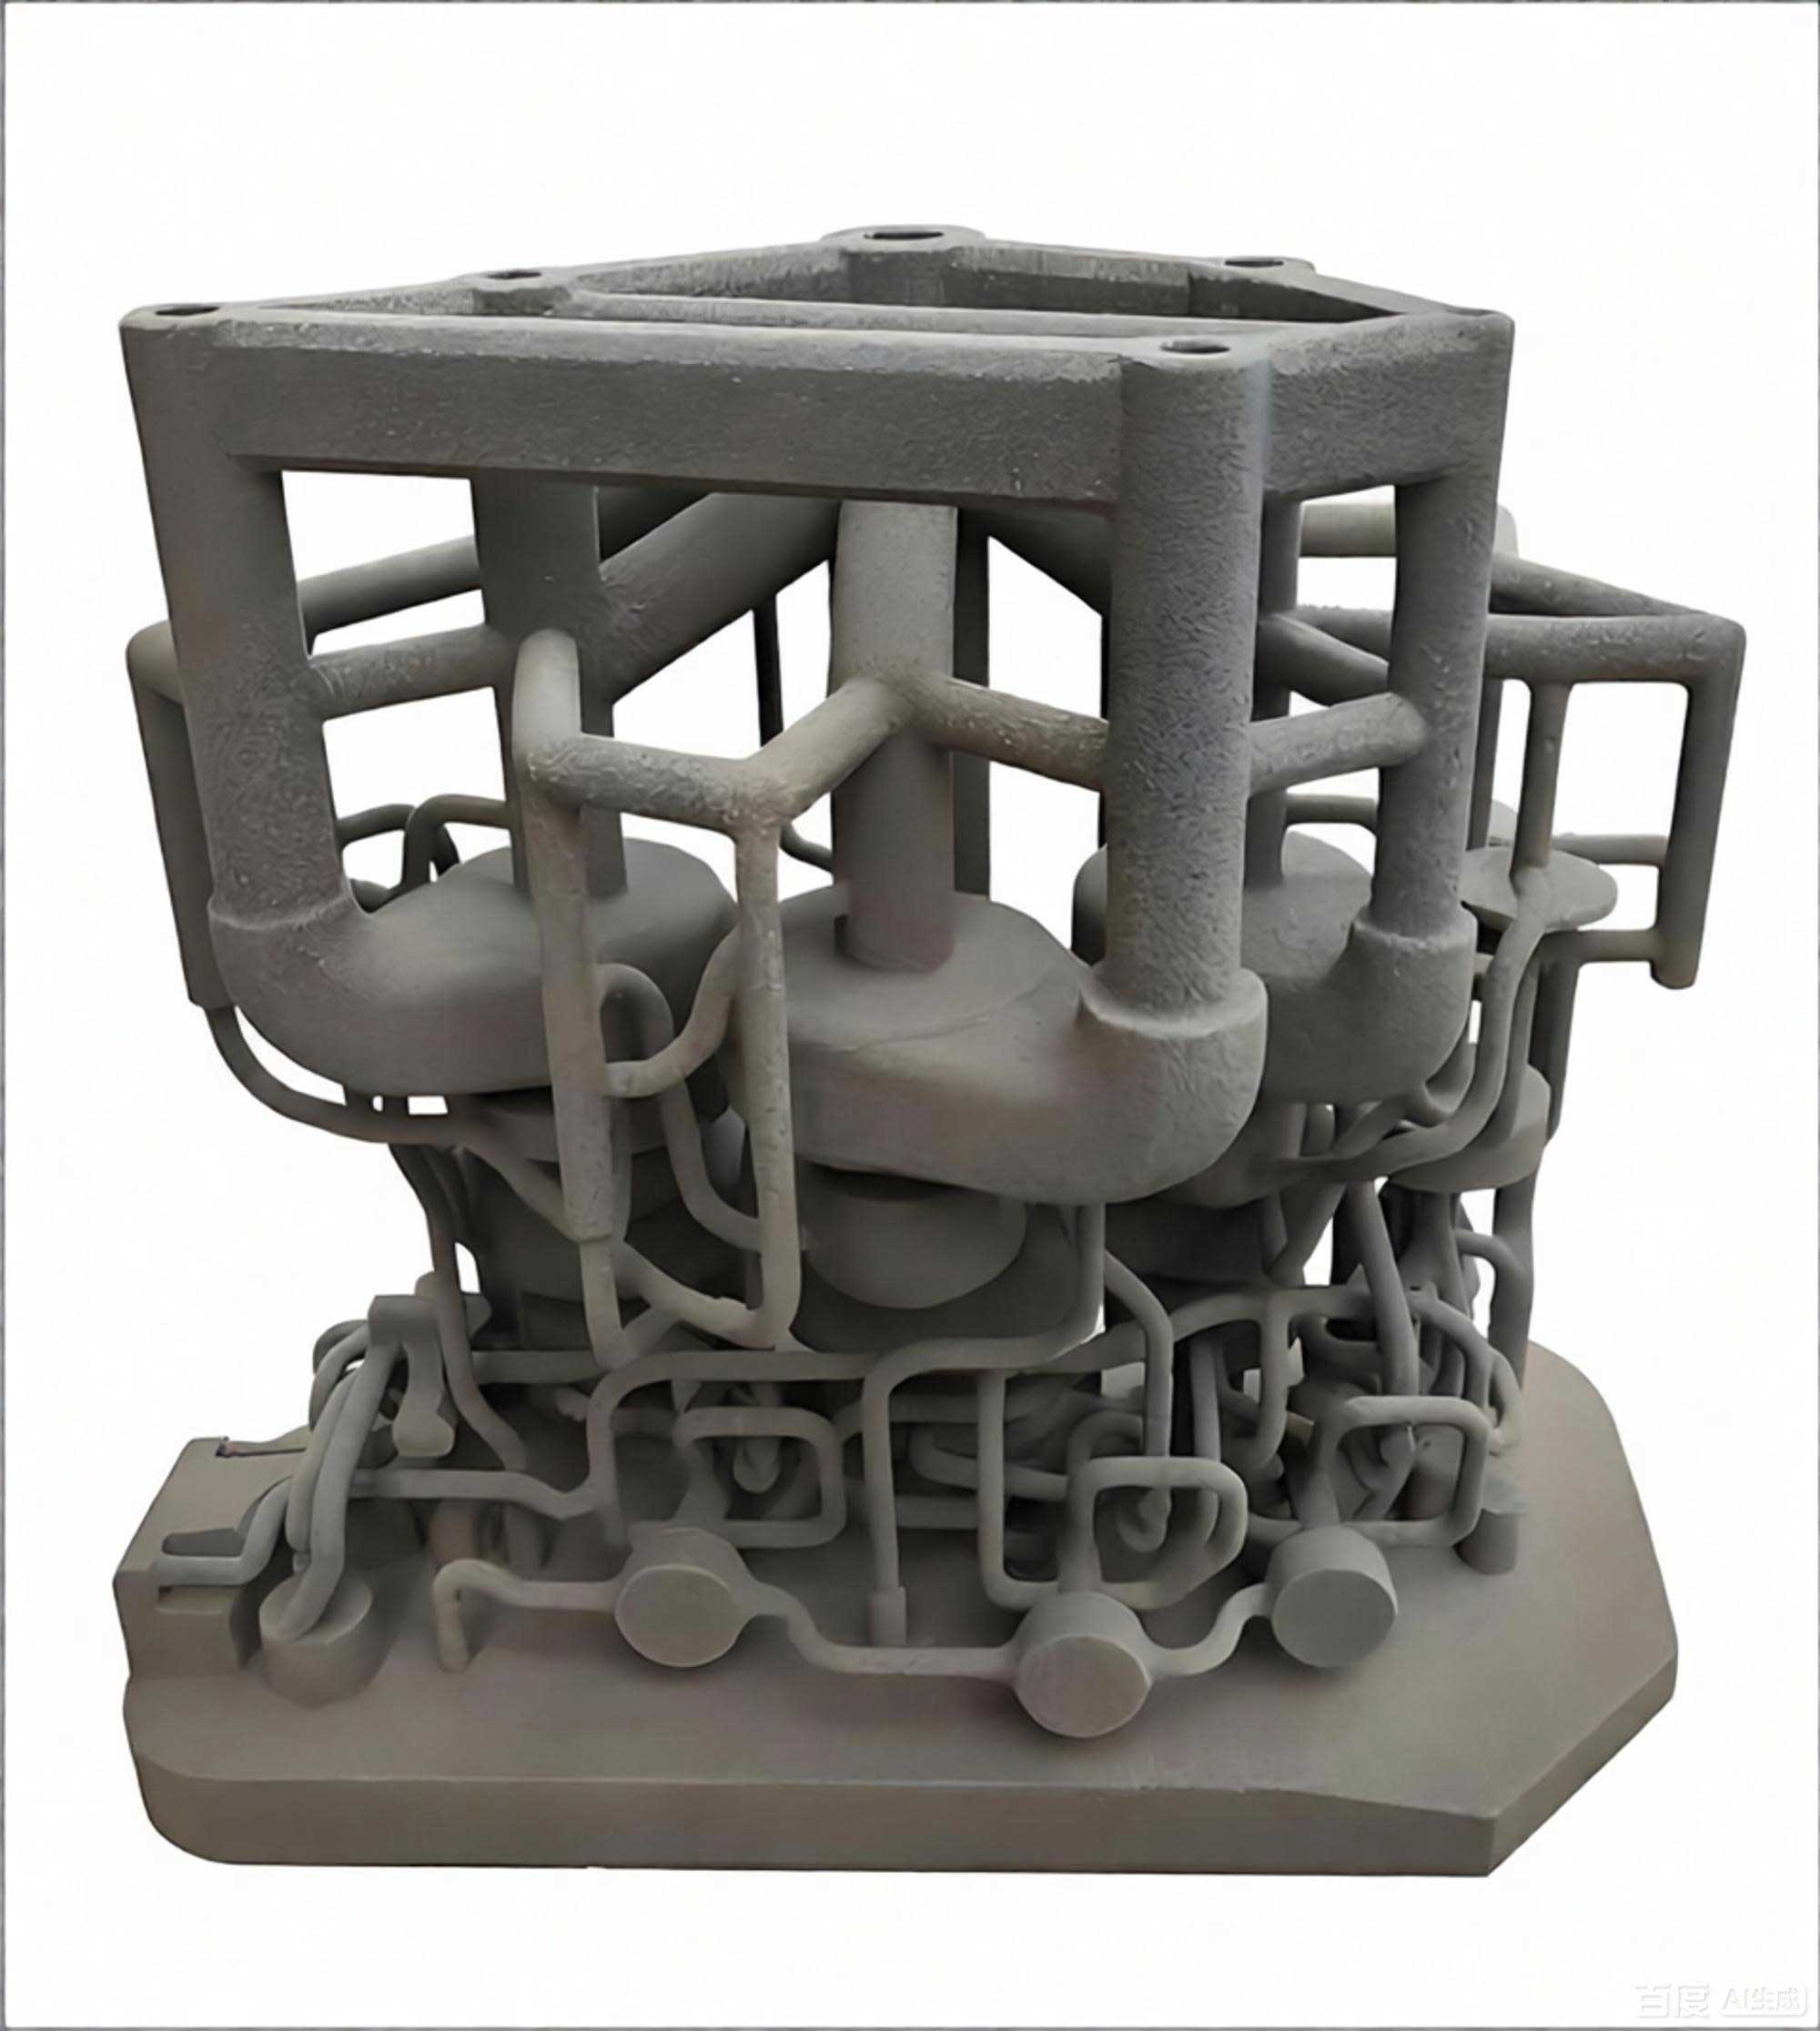
In this layout, the sand core is printed as an integral structure, which reduces the number of separate cores and eliminates the need for core assembly fixtures. The dimensional accuracy of the printed core was controlled to approximately ±0.015%. This precision is important for the thin blades, because even a small core shift would lead to unacceptable wall thickness variations. During handling and assembly, the printed core did not show any cracks or breakage. The one-piece core design is one of the key advantages of 3D printing sand casting, because it allows the foundry engineer to realize geometries that would otherwise require multiple cores and complex core prints.
Results and Discussion
Box-Behnken Experimental Results
The Box-Behnken design matrix and the measured responses are shown below. The experiments were run in random order to reduce the influence of uncontrolled noise. The tensile strength was measured using figure-eight test specimens according to the relevant test standard. The gas evolution was measured with an intelligent gas evolution tester. All printed specimens were baked and stored for 24 hours before testing, allowing the resin to reach a stable degree of cure.
| Run | A | B | C | Tensile strength / MPa | Gas evolution / (mL/g) |
|---|---|---|---|---|---|
| 1 | 3 | 2 | 3 | 2.17 | 11.50 |
| 2 | 2 | 2 | 2 | 2.14 | 10.33 |
| 3 | 3 | 2 | 1 | 2.31 | 11.06 |
| 4 | 2 | 1 | 3 | 2.59 | 11.63 |
| 5 | 2 | 2 | 2 | 2.22 | 10.18 |
| 6 | 2 | 3 | 1 | 2.31 | 10.69 |
| 7 | 2 | 1 | 1 | 2.38 | 9.80 |
| 8 | 1 | 2 | 3 | 1.46 | 7.39 |
| 9 | 2 | 2 | 2 | 1.93 | 9.62 |
| 10 | 2 | 2 | 2 | 2.13 | 10.30 |
| 11 | 1 | 1 | 2 | 1.64 | 7.04 |
| 12 | 2 | 2 | 2 | 2.18 | 10.21 |
| 13 | 3 | 3 | 2 | 2.37 | 12.05 |
| 14 | 2 | 3 | 3 | 1.88 | 10.44 |
| 15 | 1 | 2 | 1 | 1.82 | 7.61 |
| 16 | 2 | 2 | 2 | 2.26 | 10.16 |
| 17 | 1 | 3 | 2 | 1.67 | 8.16 |
From this table, it is already possible to observe some trends. The highest tensile strength values appear when the resin inkjet content is at its middle or high level and the layer thickness is relatively small. The gas evolution increases with resin content. However, because the factors are not varied independently, a more rigorous statistical analysis is needed to separate the main effects from the interaction effects. The response surface methodology provides exactly this kind of decomposition. In the following subsections, I present the ANOVA results for the two responses and the corresponding regression equations.
ANOVA for Tensile Strength
The analysis of variance for tensile strength is summarized in the table below. The model F-value of 56.68 and the corresponding P-value smaller than 0.0001 indicate that the quadratic model is highly significant. The lack-of-fit F-value is 0.9256 with a P-value of 0.5055, which is not significant. This is desirable because it means that the residual variation is dominated by pure experimental error rather than by model inadequacy. Therefore, the model can be used for prediction within the experimental range.
| Source | Sum of squares | df | Mean square | F-value | P-value |
|---|---|---|---|---|---|
| Model | 1.47 | 9 | 0.1635 | 56.68 | < 0.0001 |
| A | 1.02 | 1 | 1.02 | 351.93 | < 0.0001 |
| B | 0.0001 | 1 | 0.0001 | 0.0390 | 0.8491 |
| C | 0.3444 | 1 | 0.3444 | 119.39 | < 0.0001 |
| AB | 0.0002 | 1 | 0.0002 | 0.078 | 0.7881 |
| AC | 0.0009 | 1 | 0.0009 | 0.312 | 0.5939 |
| BC | 0.0001 | 1 | 0.0001 | 0.0347 | 0.8576 |
| A² | 0.0970 | 1 | 0.0970 | 33.61 | 0.0007 |
| B² | 0.0057 | 1 | 0.0057 | 1.97 | 0.2031 |
| C² | 0.0025 | 1 | 0.0025 | 0.8583 | 0.3851 |
| Residual | 0.0202 | 7 | 0.0029 | — | — |
| Lack of fit | 0.0083 | 3 | 0.0028 | 0.9256 | 0.5055 |
| Pure error | 0.0119 | 4 | 0.0030 | — | — |
| Total | 1.49 | 16 | — | — | — |
The coefficient of determination \(R^2\) for the tensile strength model is 0.9865, meaning that 98.65% of the variation in tensile strength is explained by the model. The adjusted \(R^2\) is 0.9691, which indicates that the model does not contain excessive non-significant terms. The coefficient of variation is 2.58%, which is low enough to confirm good precision and reliability. The small difference between \(R^2\) and adjusted \(R^2\) also suggests that the model is parsimonious and physically meaningful.
Based on the coded factors, the regression equation for tensile strength is
$$Y_1 = 2.19 + 0.3563A – 0.0037B – 0.2075C + 0.0075AB – 0.015AC + 0.005BC – 0.1518A^2 – 0.0368B^2 – 0.0242C^2$$
In this equation, \(Y_1\) is the tensile strength in MPa. The linear coefficient of A is large and positive, indicating that resin inkjet content is the dominant factor controlling the tensile strength of the printed sand mold. The linear coefficient of C is negative, meaning that an increase in layer thickness reduces the tensile strength. The coefficient of B is very small and not significant, which suggests that within the tested range, the activator content has little direct influence on tensile strength after the specimens are baked and stored. The quadratic term \(A^2\) is negative and highly significant, which means that the beneficial effect of increasing the resin content diminishes at higher resin levels. This curvature is important because it prevents the optimizer from selecting an excessively high resin content that would increase gas evolution without providing a proportional gain in strength.
Response Surface Analysis of Tensile Strength
The response surface plot for tensile strength shows that when the layer thickness is held at its center level, the tensile strength rises steeply as the resin inkjet content increases from the low level to the high level. The effect of activator content is almost flat, which is consistent with the ANOVA result. When the activator content is fixed at its center level, the tensile strength increases with increasing resin content and decreases with increasing layer thickness. The slope associated with resin content is greater than the slope associated with layer thickness. This indicates that, for the tensile strength of the 3D printed sand mold, the resin inkjet content is the most important process parameter.
The interaction between resin inkjet content and layer thickness is visible in the contour plot, which shows an elliptical pattern. This means that the effect of layer thickness is not completely independent of the resin content. At a high resin content, the negative effect of layer thickness is slightly less pronounced because the larger amount of resin can still form enough binder bridges across the thickness direction. At a low resin content, the layer thickness effect becomes more critical because the binder is already insufficient to bond the sand grains completely. This interaction, although relatively weak in the statistical test, is physically reasonable for 3D printing sand casting.
The activator content, by comparison, affects mainly the curing chemistry of the furan resin rather than the total amount of binder available. The curing reaction generates water, which dilutes the acidic activator and slows the reaction if the activator concentration is too high. However, after the printed sand mold is baked and conditioned, the influence of the activator becomes less significant. This explains why the B term and its interactions are not statistically significant in the tensile strength model. In practical terms, this means that I have some flexibility in selecting the activator content without compromising the strength of the mold, provided that the resin content and layer thickness are properly set.
ANOVA for Gas Evolution
The gas evolution behavior is equally important for 3D printing sand casting because gas released from the mold during pouring can become trapped in the solidifying metal and cause porosity. The gas evolution of the printed sand mold was therefore analyzed using the same Box-Behnken design. The ANOVA results are shown below.
| Source | Sum of squares | df | Mean square | F-value | P-value |
|---|---|---|---|---|---|
| Model | 35.81 | 9 | 3.98 | 564.2 | < 0.0001 |
| A | 32.16 | 1 | 32.16 | 4559.88 | < 0.0001 |
| B | 1.82 | 1 | 1.82 | 258.63 | < 0.0001 |
| C | 0.0760 | 1 | 0.0760 | 10.78 | 0.0134 |
| AB | 0.0042 | 1 | 0.0042 | 0.599 | 0.4643 |
| AC | 0.0020 | 1 | 0.0020 | 0.2871 | 0.6087 |
| BC | 0.0012 | 1 | 0.0012 | 0.1737 | 0.6893 |
| A² | 1.68 | 1 | 1.68 | 238.27 | < 0.0001 |
| B² | 0.0030 | 1 | 0.0030 | 0.4272 | 0.5342 |
| C² | 0.0217 | 1 | 0.0217 | 3.07 | 0.1230 |
| Residual | 0.0494 | 7 | 0.0071 | — | — |
| Lack of fit | 0.0269 | 3 | 0.0090 | 1.59 | 0.3245 |
| Pure error | 0.0225 | 4 | 0.0056 | — | — |
| Total | 35.86 | 16 | — | — | — |
The model is highly significant, with an F-value of 564.2 and a P-value smaller than 0.0001. The lack-of-fit P-value is 0.3245, which is not significant, so the model is adequate. The coefficient of determination \(R^2\) is 0.9986, and the adjusted \(R^2\) is 0.9969. The coefficient of variation is 0.849%, which is very low and indicates excellent reproducibility. The fitted regression equation for gas evolution is
$$Y_2 = 10.24 + 2.0A + 0.4775B – 0.0975C – 0.0325AB + 0.0225AC – 0.0175BC – 0.6317A^2 – 0.0268B^2 – 0.0718C^2$$
In this equation, \(Y_2\) is the gas evolution in mL/g. The linear coefficient of A is large and positive, confirming that the resin inkjet content is the most important factor affecting gas evolution. The coefficient of B is also positive and statistically significant, meaning that the activator content contributes to gas generation. The coefficient of C is negative but relatively small. The quadratic term \(A^2\) is negative, which again indicates curvature in the relationship at high resin contents. The interaction terms are not significant, which simplifies the interpretation.
Response Surface Analysis of Gas Evolution
The gas evolution response surface indicates that gas generation increases rapidly with resin inkjet content. The effect of the activator is positive but much weaker. The layer thickness has only a minor effect on gas evolution when the resin content and activator content are held constant. This is because the gas evolution is measured per gram of sand. Changing the layer thickness influences the spatial distribution of binder in the sand bed, but it does not necessarily change the resin-to-sand mass ratio if the resin inkjet content is defined as a mass fraction. Therefore, the layer thickness is more important for strength and surface quality than for gas evolution.
The interaction between resin inkjet content and activator content is the most noticeable interaction in the gas evolution response surface. Although the interaction term AB is not statistically significant, the contour plot shows a slight curvature. This is related to the fact that the activator accelerates the curing reaction and therefore influences the state of polymerization of the resin. When the resin is fully cured, the decomposition behavior under heating may be different from that of partially cured resin. However, because the printed specimens were baked before testing, the effect of the activator on gas evolution is more direct than its effect on tensile strength.
From the perspective of 3D printing sand casting, the gas evolution result emphasizes the need to keep the resin content as low as possible while still achieving the required mold strength. It also suggests that the activator content should be selected carefully because it has a small but statistically significant effect on gas generation. The layer thickness can be increased to improve the printing speed without greatly increasing the gas evolution, provided that the resulting tensile strength remains acceptable. This insight is particularly useful for large molds, where printing time is a major cost factor.
Multi-Objective Optimization of Process Parameters
In industrial practice, the optimal 3D printing sand casting process must satisfy multiple criteria simultaneously. The sand mold should be strong enough to withstand mold handling, core assembly, and the hydrostatic pressure of liquid metal. At the same time, the gas evolution should be low enough to prevent gas defects in the casting. The production cost should be minimized by reducing the consumption of resin and activator. The production time should also be minimized by increasing the layer thickness as much as possible without compromising quality. These objectives are partly conflicting, so a compromise is needed.
I used a numerical optimization routine in the same statistical software package to find the parameter combination that gives the highest tensile strength and the lowest gas evolution within the experimental range. The optimization criteria were to maximize tensile strength and minimize gas evolution. The numerical optimizer produced the following results: resin inkjet content of 1.445%, activator content of 0.214%, and layer thickness of 0.306 mm. The predicted tensile strength was 2.10 MPa, and the predicted gas evolution was 9.00 mL/g. For practical operation, I adjusted these values to 1.44% resin, 0.21% activator, and 0.30 mm layer thickness. Figure-eight test specimens were printed at these adjusted conditions. The measured tensile strength was 2.14 MPa, and the measured gas evolution was 8.92 mL/g. The measured values are close to the predicted values, confirming that the response surface model has good predictive ability.
| Condition | Resin inkjet content / % | Activator content / % | Layer thickness / mm | Tensile strength / MPa | Gas evolution / (mL/g) |
|---|---|---|---|---|---|
| Before optimization | 1.530 | 0.300 | 0.250 | 2.28 | 10.10 |
| Numerical optimum | 1.445 | 0.214 | 0.306 | 2.10 | 9.00 |
| Adjusted and measured | 1.440 | 0.210 | 0.300 | 2.14 | 8.92 |
Compared with the original process conditions, the optimized parameters reduced the resin consumption by
$$\Delta C_{\text{resin}} = \frac{1.530 – 1.440}{1.530} \times 100\% = 5.88\%$$
The activator consumption was reduced by
$$\Delta C_{\text{activator}} = \frac{0.300 – 0.210}{0.300} \times 100\% = 30\%$$
The layer thickness was increased from 0.25 mm to 0.30 mm, which reduces the number of printed layers for a given mold height. If the total height is \(H\), the number of layers is \(N = H/h\). For a layer thickness of 0.25 mm, there are 400 layers per 100 mm of build height. For 0.30 mm, there are approximately 333 layers per 100 mm. The printing time is roughly proportional to the number of layers, so the efficiency gain is
$$\eta = \left(1 – \frac{0.25}{0.30}\right) \times 100\% = 16.7\%$$
This improvement is significant in a production environment. The slight reduction in tensile strength from 2.28 MPa to 2.14 MPa is acceptable because the optimized mold still meets the strength requirement for low-pressure die casting. At the same time, the reduction in gas evolution from 10.10 mL/g to 8.92 mL/g reduces the risk of gas porosity. This demonstrates that the response surface methodology can find a balanced operating point that is better than the original conditions from an overall manufacturing perspective.
Validation of 3D Printing Sand Casting with a Thin-Walled Impeller
To validate the optimized process, I manufactured the full sand mold and core system for the thin-walled impeller using the optimized parameters. The sand core was printed in one piece, eliminating assembly errors and improving dimensional consistency. The core was designed with sufficient strength to support the thin blade sections and to resist the buoyancy force of the molten aluminum during filling. Before pouring, the core was baked with a torch to remove any residual moisture and to further reduce gas evolution. The baking step is particularly important in 3D printing sand casting because the binder system may retain small amounts of volatile compounds that can generate gas when exposed to high temperature.
The low-pressure die casting process was carried out with a pouring temperature of approximately 745 °C and a holding pressure of about 38 kPa. The holding pressure helps to feed the thin sections and to compensate for solidification shrinkage. The gating system and vents were designed so that the metal front advances smoothly through the cavity without turbulent flow. The chills placed at the thick sections promoted directional solidification and reduced the risk of shrinkage porosity. After solidification and cooling, the mold was broken out, and the casting was cleaned and cut off from the gating system.
The resulting impeller casting had a clean surface and complete blade profiles. The thin edges of the blades were fully filled, which indicates that the optimized sand mold provided the necessary permeability and venting. There was no visible surface defect such as cold shut, misrun, or gas blow. The dimensional accuracy of the non-machined surfaces was within ±0.9 mm, which satisfies the DCTG6 dimensional tolerance requirement. X-ray inspection of the critical regions showed no porosity or shrinkage cavities. This result confirms that the optimized 3D printing sand casting process produces a sound thin-walled aluminum impeller.
The success of this validation can be attributed to the balanced combination of mold strength, gas evolution, and dimensional accuracy. If the resin content had been too high, the gas evolution would have increased the risk of porosity. If the resin content had been too low, the sand core might have cracked during handling or insufficiently resisted the molten metal pressure. The optimized layer thickness provided a good compromise between surface quality and printing speed. This demonstrates the practical value of the response surface approach for 3D printing sand casting.
Model Adequacy and Statistical Diagnostics
In addition to the ANOVA results, I examined several diagnostic measures to ensure that the regression models are reliable. The normal probability plots of the residuals showed that the residuals follow an approximately straight-line distribution, which is consistent with the assumption of normally distributed errors. The residuals versus predicted values showed no obvious pattern, indicating that the variance is approximately constant across the range of predicted values. The residuals versus run order did not exhibit any systematic trend, which supports the validity of the randomized experimental design. These checks are important because a statistically significant model is not necessarily useful if the underlying assumptions are violated.
The coefficient of determination is an important measure of model fit. For tensile strength,
$$R^2 = 1 – \frac{SS_{\text{res}}}{SS_{\text{total}}} = 0.9865$$
The adjusted coefficient of determination is
$$R^2_{\text{adj}} = 1 – \frac{SS_{\text{res}}/df_{\text{res}}}{SS_{\text{total}}/df_{\text{total}}} = 0.9691$$
The small difference between these two values indicates that the model does not include too many unnecessary terms. For gas evolution, the values are \(R^2 = 0.9986\) and \(R^2_{\text{adj}} = 0.9969\). The extremely high \(R^2\) value for gas evolution reflects the strong influence of the resin content and the well-controlled experimental conditions.
The coefficient of variation is defined as
$$C_v = \frac{s}{\bar{y}} \times 100\%$$
where \(s\) is the residual standard deviation and \(\bar{y}\) is the mean response. The low values of \(C_v\) for both tensile strength and gas evolution indicate that the experiments were performed with high precision. The lack-of-fit tests further confirm that the quadratic model is appropriate. If the lack-of-fit were significant, a higher-order model or a transformation of the response would be necessary. Since the P-values for lack-of-fit are well above 0.1, I concluded that the second-order models are sufficient for the purposes of optimization and prediction.
Discussion of Process-Structure-Property Relationships
The results of this investigation can be understood from the perspective of the physical structure of the printed sand mold. The strength of a binder-bonded sand is controlled by the number and size of binder bridges at the contact points between sand grains. In 3D printing sand casting, the resin is selectively deposited onto the sand bed. When the resin inkjet content increases, more binder is available at the particle contacts, and the binder bridges become thicker and more numerous. This directly increases the tensile strength. However, the resin also coats the sand grains and fills some of the intergranular voids. During pouring, the organic resin decomposes into gaseous products. The gas generation rate depends on the total amount of resin in the mold. Therefore, the resin content has opposing effects on the two responses.
The activator content affects the polymerization kinetics. A higher activator concentration accelerates the cure and may initially improve the green strength of the mold. However, the curing reaction also produces water, which can dilute the acid catalyst and slow the reaction if the local concentration becomes too high. After baking, the residual water is removed, and the final bond strength is less sensitive to the activator content. This explains the weak effect of activator content on tensile strength in the measured data. In contrast, the activator content has a clear positive effect on gas evolution because acids and their decomposition products contribute to the measured gas volume at high temperature. This is why the activator content should not be arbitrarily increased even if it does not harm the tensile strength.
The layer thickness affects the vertical resolution of the 3D printing process. A smaller layer thickness produces more layers for a given mold height, which increases the printing time. It also creates more interfaces between adjacent layers. These interfaces are potential weak planes because the binder may not penetrate completely through the layer boundary. A larger layer thickness reduces the number of interfaces and may improve the interlayer bonding if the resin content is sufficient. However, a larger layer thickness also requires the binder to penetrate deeper into the sand bed. If the penetration is incomplete, the bottom part of each layer may contain fewer binder bridges, leading to a lower tensile strength. The results of this study show that a layer thickness of 0.30 mm is a good compromise between printing speed and mold strength for this material system.
The interaction between resin content and layer thickness is particularly important. When the layer thickness is large, the binder needs to migrate through a thicker sand layer. If the resin content is too low, the binder may not reach all the particle contacts near the bottom of the layer. This creates a defect known as weak interlayer bonding, which reduces the tensile strength. Increasing the resin content improves the penetration and therefore mitigates the negative effect of the larger layer thickness. This interaction is visible in the contour plot for tensile strength. In practical terms, it means that a foundry can increase the printing speed by using a larger layer thickness but must also increase the resin content to maintain the same strength. The optimum condition identified in this work accounts for this trade-off.
Implications for Foundry Practice
The use of 3D printing sand casting has several advantages over conventional molding. First, it eliminates the need for patterns, which shortens the product development cycle and reduces the cost of small-batch production. Second, it enables the production of complex internal geometries that cannot be made by traditional core assembly. Third, it allows the mold designer to optimize the gating system and feeding system without being constrained by pattern-draft angles or core print clearances. However, these advantages can only be fully realized if the sand mold properties are properly controlled. This is why process optimization is essential.
The results of this study show that response surface methodology is a powerful tool for optimizing 3D printing sand casting. The statistical model quantifies the effects of process parameters and identifies the interactions that would be missed by a one-factor-at-a-time approach. The optimized parameters reduce material consumption and printing time while maintaining the required mold quality. This is particularly important for large mold packages, where every fraction of a percent of resin saved translates into significant cost savings. The reduction in activator content also improves the working environment by reducing the emission of acidic gases during pouring.
The validation with a thin-walled impeller demonstrates that the optimized 3D printing sand casting process can produce complex castings with high dimensional accuracy and internal soundness. The one-piece core design eliminated the need for core assembly fixtures and reduced the risk of core shift. The thin blade sections were filled completely, and X-ray inspection showed no porosity or shrinkage defects. This suggests that the optimized process can be transferred to other thin-walled aluminum castings with similar requirements.
Conclusion
In this work, I have systematically optimized the sand mold 3D printing forming process for application to a thin-walled impeller casting. The conclusions of the investigation can be summarized as follows.
First, the response surface models developed from the Box-Behnken design are statistically significant and have high predictive ability. The tensile strength model has an \(R^2\) of 0.9865, and the gas evolution model has an \(R^2\) of 0.9986. The lack-of-fit tests are not significant, confirming that the quadratic models adequately describe the data. The resin inkjet content is the most important parameter affecting both tensile strength and gas evolution. The layer thickness is the second most important parameter affecting tensile strength, while the activator content has a smaller but significant influence on gas evolution.
Second, the optimal process parameters for 3D printing sand casting in this material system are a resin inkjet content of 1.44%, an activator content of 0.21%, and a printed layer thickness of 0.30 mm. At these parameters, the measured tensile strength is 2.14 MPa, and the measured gas evolution is 8.92 mL/g. Compared with the original process, the resin consumption is reduced by 5.88%, the activator consumption is reduced by 30%, and the printing efficiency is improved by 16.7%.
Third, the thin-walled impeller produced by low-pressure die casting with the optimized sand mold has complete blade profiles, clean surfaces, and no internal defects. The dimensional accuracy is within the required tolerance, and X-ray inspection confirms the absence of porosity and shrinkage cavities. This demonstrates that the optimized 3D printing sand casting process is suitable for producing complex thin-walled aluminum castings.
The combination of 3D printing sand casting, Box-Behnken response surface optimization, and low-pressure die casting provides a robust route for the rapid fabrication of high-quality impellers and similar components. Future work could extend this approach to other binder systems, other casting alloys, and larger mold sizes. The statistical methodology presented here can be adapted to optimize additional responses such as surface roughness, dimensional accuracy, permeability, and bench life. Overall, this investigation confirms that a data-driven approach to 3D printing sand casting process design leads to better quality, lower cost, and greater productivity.