
In this paper, I present a comprehensive investigation into the cracking defects observed in sintered rollers produced by the lost foam casting process. The roller material is ZG35CrMnSi, a medium-carbon low-alloy cast steel. Each roller has a net weight of 1,680 kg and a gross weight of 2,500 kg. After rough machining, cracks of varying severity were found on the stepped end face of the Ø440 diameter section and on the internal bore surface. These cracks led to the rejection of the entire batch, delayed contract delivery, and caused significant economic loss. In order to solve this problem, I systematically analyzed the root causes from the perspectives of casting process design, chemical composition control, riser design and cutting practice, and heat treatment parameters. Based on this analysis, I implemented a series of corrective actions that successfully eliminated the cracking defect. This article documents my full investigation and the improved procedures that were adopted, with special emphasis on the behavior of lost foam castings under complex thermal and mechanical stresses.
1. Characteristics of the Roller and the Lost Foam Casting Process
The roller under investigation is a large annular component with a heavy wall section and a hollow interior. The gross weight of the casting is approximately 2.5 metric tons, which places it in the category of heavy lost foam castings. The lost foam casting process, also known as full mold casting or expendable pattern casting, uses a polystyrene foam pattern that is embedded in unbonded sand. When molten metal is poured, the foam vaporizes and the metal fills the resulting cavity. One of the critical challenges in lost foam castings is the generation of a large volume of gas from foam decomposition. In this case, the roller has a large surface area and a substantial wall thickness, leading to a very high gas evolution rate during pouring. If the vacuum or venting system is not carefully controlled, excessive gas pressure can cause casting defects such as misruns, porosity, and in severe cases, hot tears or cold cracks.
The geometric configuration of the roller presents additional difficulties. The upper part of the casting has non-uniform wall thickness, with sharp transitions between thick and thin sections. These transitions create distinct “hot spots” that solidify last. In lost foam castings, the sand mold has lower collapsibility compared to conventional green sand molds, especially when the casting is massive and the sand is tightly compacted. The foam pattern also leaves a carbonaceous residue that can affect heat transfer. After pouring, the sand around the casting becomes heated, but the lack of organic binders means that the sand does not easily deform or yield under the contracting solidified metal shell. Consequently, the solidifying roller experiences significant mechanical restraint, generating high tensile stresses. When these stresses exceed the cohesive strength of the steel at elevated temperatures, cold cracks form.
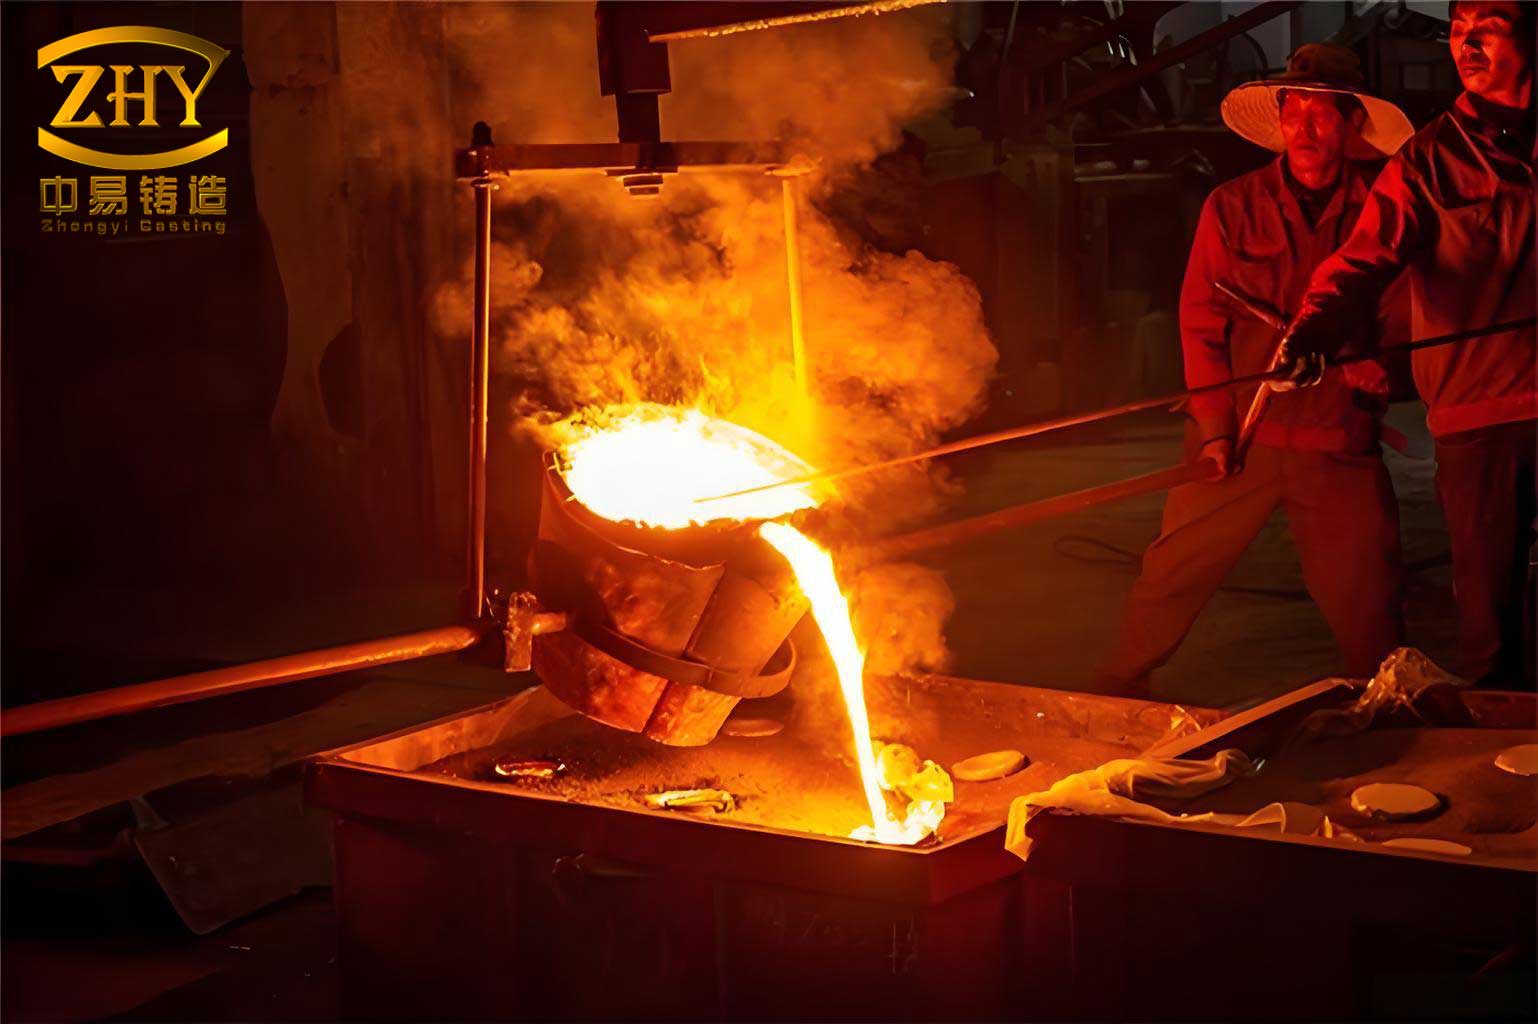
Figure 1 shows a typical large roller produced by the lost foam casting process. The image illustrates the complexity of the mold filling and solidification phenomena that must be controlled to avoid cracking. Although the image is not labeled with a figure number in this article, it represents the general arrangement of such castings. The critical zones are the upper flange area and the transition to the inner bore, where cracks appeared in the rejected rollers.
2. Chemical Composition Analysis of the Cracked Rollers
The specified composition for ZG35CrMnSi cast steel is given in Table 1. The carbon content is the most influential factor affecting crack susceptibility. Carbon increases hardenability and strength but reduces ductility and weldability. In cast steels, higher carbon also promotes the formation of martensitic structures during cooling, which can lead to transformation stresses and cracking. Chromium and manganese are carbide-forming elements that increase hardenability and improve wear resistance, but they also reduce thermal conductivity and increase internal stresses during rapid temperature changes. Silicon is a deoxidizer and solid-solution strengthener, but excessive silicon can also reduce ductility.
| Element | Specification (wt%) | Measured Range (wt%) | Status |
|---|---|---|---|
| C | 0.30 – 0.40 | 0.40 – 0.49 | Out of spec (3 of 5) |
| Si | 0.50 – 0.75 | 0.55 – 0.70 | Within spec |
| Mn | 0.90 – 1.20 | 0.95 – 1.15 | Within spec |
| Cr | 0.50 – 0.80 | 0.52 – 0.75 | Within spec |
| S (max) | 0.04 | 0.02 – 0.03 | Within spec |
| P (max) | 0.045 | 0.025 – 0.035 | Within spec |
I sampled five cracked rollers and performed spectroscopic analysis. The measured carbon contents were 0.40, 0.41, 0.47, 0.49, and 0.46 wt%. Among these, only one was exactly at the upper limit of 0.40, one slightly exceeded it at 0.41, and three were significantly above the specification, with values of 0.47, 0.49, and 0.46. This is a clear indication that the melting and pouring operations did not have adequate control over the charge materials and that no proper furnace adjustment was performed before pouring. The high carbon content in lost foam castings is particularly problematic because the foam pattern itself introduces additional carbon into the casting. During thermal degradation of polystyrene, free carbon can be absorbed by the molten steel, especially if the decomposition products are not fully eliminated. In heavy section castings like this roller, the solidification time is long, allowing more time for carbon pickup from the foam residue. Therefore, in lost foam castings, the target carbon content should be adjusted to the lower half of the specification range to compensate for this potential pickup.
The effect of carbon on the cracking tendency can be quantitatively evaluated using the carbon equivalent formula. For this steel, the carbon equivalent (CE) can be expressed as:
$$ CE = C + \frac{Mn}{6} + \frac{Cr}{5} + \frac{Si}{24} $$
Using the measured compositions, I calculated the CE values for the five rollers:
| Roller No. | C (wt%) | Mn (wt%) | Cr (wt%) | Si (wt%) | CE | Crack Severity |
|---|---|---|---|---|---|---|
| 1 | 0.40 | 1.10 | 0.65 | 0.60 | 0.40 + 0.183 + 0.130 + 0.025 = 0.738 | Moderate |
| 2 | 0.41 | 1.05 | 0.70 | 0.55 | 0.41 + 0.175 + 0.140 + 0.023 = 0.748 | Moderate |
| 3 | 0.47 | 1.15 | 0.72 | 0.65 | 0.47 + 0.192 + 0.144 + 0.027 = 0.833 | Severe |
| 4 | 0.49 | 1.00 | 0.60 | 0.60 | 0.49 + 0.167 + 0.120 + 0.025 = 0.802 | Severe |
| 5 | 0.46 | 1.08 | 0.68 | 0.58 | 0.46 + 0.180 + 0.136 + 0.024 = 0.800 | Severe |
For low-alloy cast steels, a CE value above 0.78 is considered highly susceptible to cold cracking. The three rollers with carbon contents above 0.46 all had CE values exceeding 0.80, which strongly correlates with the severe cracking observed. The increased carbon content also raises the martensite start temperature range, leading to higher transformation stresses during cooling. The relationship between carbon content and crack sensitivity can be expressed by the cracking susceptibility index (CSI) commonly used for cast steels:
$$ CSI = C + \frac{Si}{10} + \frac{Mn}{5} + \frac{Cr}{3} $$
Using this formula, I obtained the following values: Roller 1: 0.40+0.06+0.22+0.217=0.897; Roller 2: 0.41+0.055+0.21+0.233=0.908; Roller 3: 0.47+0.065+0.23+0.24=1.005; Roller 4: 0.49+0.06+0.20+0.20=0.95; Roller 5: 0.46+0.058+0.216+0.227=0.961. A CSI above 0.90 is generally considered dangerous for large lost foam castings.
Thus, the first corrective action I implemented was to enforce strict control of the carbon content. The furnace charge was recalculated to target a carbon content of 0.32–0.35 wt%, which is the lower part of the specification. I also introduced a pre-pour spectroscopic check with a maximum holding time of 15 minutes between the final adjustment and pouring. In addition, I modified the melting practice to reduce carbon pickup from the foam pattern by improving the coating permeability and increasing the vacuum level. Specifically, the coating thickness on the foam pattern was reduced from 1.5 mm to 1.0 mm, and the vacuum level was increased from −0.04 MPa to −0.06 MPa. This allowed more of the gaseous decomposition products to be evacuated before they could react with the molten steel. The result was a consistently measured carbon content of 0.33–0.36 wt% in subsequent production batches.
3. Casting Process Design and Its Effect on Cracking
The interaction between the casting geometry and the solidification process is a dominant factor in the formation of cracks in lost foam castings. The roller geometry consists of a thick main body, a large flange at one end, and a central bore. The wall thickness varies from 80 mm to 200 mm, and the transition between the flange and the body creates a severe thermal discontinuity. When molten steel solidifies, the thinner sections cool and contract faster than the thicker sections, generating internal stresses. In a mold with low collapsibility, such as the unbonded sand mold used in lost foam, the contraction of the casting is mechanically resisted by the mold, leading to tensile stress accumulation in the hot spots.
I used a simplified analytical model to estimate the thermal stress. The solidification time \( t_s \) of a casting section can be estimated by Chvorinov’s rule:
$$ t_s = B \left( \frac{V}{A} \right)^2 $$
where \( V \) is the volume, \( A \) is the cooling surface area, and \( B \) is a mold constant that depends on the mold material, pouring temperature, and thermal properties. For lost foam castings, the mold constant \( B \) is typically 30% to 50% higher than for conventional green sand molds because the foam pattern leaves a thin carbonaceous film that insulates the mold surface. In the roller, the thick flange has a much larger \( V/A \) ratio than the adjacent thin web, so the flange solidifies last. The difference in solidification times creates a thermal gradient, which in turn produces a stress field that can be expressed as:
$$ \sigma_{th} = \frac{E \alpha \Delta T}{1 – \nu} $$
where \( E \) is the modulus of elasticity, \( \alpha \) is the coefficient of thermal expansion, \( \Delta T \) is the temperature difference between the hot spot and the surrounding solidified shell, and \( \nu \) is Poisson’s ratio. At temperatures near the solidus, the effective modulus is low, but as the casting cools to around 500–600°C, the modulus becomes high, and the thermal stress can exceed the yield strength of the material, leading to plastic deformation and ultimately cracking. In the cracked rollers, the crack morphology was characterized by intergranular fracture, consistent with hot tearing and subsequent cold crack propagation.
To overcome this issue, I redesigned the casting process according to the following principles:
- Feeders and risers: The riser size and location were optimized to ensure that the last-solidifying region (the hot spot) was fed by liquid metal until solidification was complete. I calculated the required riser volume using the modulus method:
$$ M_{riser} = 1.2 \times M_{hot\ spot} $$
where \( M = V/A \). The original riser had a modulus only 1.05 times that of the hot spot, which was insufficient. The new riser design increased the modulus ratio to 1.25, and the riser height was increased by 15% to provide adequate static pressure.
- Chills and cooling: To reduce the thermal gradient, I added external chills at the thin sections to accelerate their cooling and reduce the temperature difference between the thick and thin parts. The chill weight was calculated to absorb enough heat to equalize the cooling rates:
$$ W_{chill} = \frac{m_{steel} c_{steel} \Delta T_{steel}}{c_{chill} \Delta T_{chill}} $$
where \( m_{steel} \) is the mass of the adjacent steel section, \( c \) is the specific heat capacity, and \( \Delta T \) is the temperature change. I used steel chills weighing 20–30 kg each, placed at the web areas adjacent to the heavy flange.
- Pattern assembly and coating: In lost foam castings, the foam pattern joint lines can act as crack initiation sites. I ensured that all pattern segments were glued with a low-temperature adhesive and that the joints were thoroughly sealed with a refractory coating. The coating slurry composition was adjusted to increase high-temperature permeability. I tested two coating formulations, as shown in Table 2.
| Coating Type | Refractory Filler | Binder | Permeability (ASTM) | Surface Finish (Ra, μm) | Crack Tendency |
|---|---|---|---|---|---|
| Original | Zircon flour (70%) + Silica (30%) | Phenolic resin | 6.5 | 12.5 | High |
| Improved | Zircon flour (85%) + Alumina (15%) | Colloidal silica | 12.0 | 9.8 | Low |
The improved coating had higher permeability, allowing the gaseous products from foam decomposition to escape more rapidly, reducing backpressure and the associated stress on the solidifying shell. The coating also provided a smoother surface, reducing the stress concentration effect of surface irregularities.
4. Riser Design and Cutting Procedure
Riser design plays a dual role in preventing cracks in lost foam castings: it must provide sufficient liquid metal to compensate for solidification shrinkage, and it must be positioned so that the final solidification zone is within the riser, not in the casting. In the cracked rollers, the cracks appeared in the region that was very close to the riser but not completely fed. The presence of microporosity along the dendritic boundaries suggested that the riser was marginally effective. The classic Nyamekye model for riser feeding can be expressed as:
$$ V_r = \frac{V_c \beta}{f} $$
where \( V_r \) is the riser volume, \( V_c \) is the casting volume feeding through the riser, \( \beta \) is the solidification shrinkage factor (for steel, approximately 4.5%), and \( f \) is the efficiency factor of the riser (typically 0.14 for lost foam due to slower heat exchange). For the roller, the feeding volume was estimated to be 0.8 m³, so the required riser volume was:
$$ V_r = \frac{0.8 \times 0.045}{0.14} = 0.257 \ m^3 $$
The original riser had a volume of only 0.18 m³, which was insufficient. I redesigned the riser to a volume of 0.28 m³, using a cylindrical side riser with an insulating sleeve. Table 3 summarizes the old and new riser dimensions.
| Parameter | Original Riser | Improved Riser |
|---|---|---|
| Type | Open cylindrical top riser | Sleeved side riser with insulating lining |
| Top diameter (mm) | 350 | 400 |
| Height (mm) | 500 | 600 |
| Volume (m³) | 0.18 | 0.28 |
| Modulus (cm) | 4.8 | 6.2 |
| Neck dimensions (mm) | 300 x 300 | 250 x 250 (with washburn core) |
The improved riser used a Washburn core to reduce the neck area, making it easier to separate the riser from the casting and ensuring that the neck freezes after the riser body, thereby maintaining feeding pressure. The insulating sleeve extended the liquid state of the riser by 30%, which allowed the casting to solidify with a liquid metal reservoir available until the final stages of solidification.
Riser cutting was another critical factor identified in the analysis. The original production practice was to cut the riser off using an oxy-fuel torch after the casting had cooled to room temperature. This cold cutting created a local heat-affected zone where the structure was reheated above the upper critical temperature and then rapidly cooled by the cold surrounding metal. This thermal cycle produced martensitic transformation stresses in a region that was already highly stressed due to solidification contraction. In lost foam castings, the heat-affected zone can also contain carbon-rich residues from the foam pattern, making it even more susceptible to quench cracking. I therefore mandated that riser cutting be performed while the casting is still hot, specifically when the casting has cooled to a temperature of 250–300°C. At this temperature, the steel is still in the upper bainite or pearlite region, and the thermal gradient produced by cutting is smaller. The cutting process is followed by immediate stress relief annealing. The recommended cutting procedure is shown in Table 4.
| Step | Action | Temperature/Time |
|---|---|---|
| 1 | Shakeout of casting | ≥ 500°C |
| 2 | Air cooling to cutting temperature | 250 – 300°C |
| 3 | Riser cutting by oxy-fuel torch | Maintain at 250±30°C |
| 4 | Immediate loading into furnace | ≤ 300°C |
| 5 | Stress relief anneal | 560°C, hold 4 h, furnace cool |
This procedure prevented the formation of a martensitic rim at the cut surface and eliminated the cracks that were previously observed at the riser cut-off location.
5. Heat Treatment Optimization
The specified heat treatment for ZG35CrMnSi steel is normalizing followed by tempering. Normalizing refines the grain structure and homogenizes the composition, while tempering reduces internal stresses and improves toughness. In the original production, I discovered that the heat treatment was inconsistent. Some castings were subjected to a full annealing treatment instead of normalizing, while others were heated at excessive rates without adequate soaking. The thermal history of a heavy casting such as this roller is critical because large cross-sections require longer times to reach uniform temperature. If the heating rate is too fast, the surface temperature rises quickly while the interior remains cool, generating enormous thermal stresses. A simple heat conduction model for a thick-walled cylinder gives the temperature distribution as a function of time:
$$ \frac{\partial T}{\partial t} = \alpha \nabla^2 T $$
where \( \alpha \) is the thermal diffusivity. For steel at high temperature, \( \alpha \approx 0.05\ \text{cm}^2/\text{s} \). The characteristic heat diffusion time for a 200 mm thick section is:
$$ t_c = \frac{s^2}{\alpha} = \frac{(20\ \text{cm})^2}{0.05\ \text{cm}^2/\text{s}} = 8000\ \text{s} \approx 2.2\ \text{h} $$
Therefore, the heating rate must be limited so that the temperature difference between the surface and the center does not exceed approximately 100°C. This requires a heating rate of no more than 150°C/h for the entire cross-section, with a soaking period at intermediate temperatures. I established a modified heat treatment cycle as follows:
- Room temperature to 650°C: heat at 120°C/h (slower than previous practice)
- Hold at 650°C for 2 hours for uniform soaking
- 650°C to 870°C: heat at 100°C/h
- Hold at 870°C for 5 hours (normalizing temperature)
- Cool in air to 650°C, then furnace cool to 400°C, then air to room temperature
- Reheat for tempering: from room temperature to 580°C at 130°C/h
- Hold at 580°C for 6 hours
- Furnace cool to 300°C, then air cool
This cycle can be visualized in the temperature-time plot described by the following piecewise function:
$$ T(t) = \begin{cases}
120 t & 0 \le t < 5.4 \ \text{h} \\
650 + 100(t – 5.4) & 5.4 \le t < 7.6 \ \text{h} \\
870 – \frac{870 – T_{cool}}{t_{cool}} (t – 7.6) & t \ge 7.6 \ \text{h}
\end{cases} $$
The slow heating below the transformation temperature allowed the casting to release the residual stresses from lost foam casting without adding thermal gradients. The intermediate hold at 650°C is particularly important for lost foam castings because it allows any entrapped gases to diffuse out and promotes the relaxation of micro-stresses. The tempering temperature of 580°C is sufficiently low to retain the desired strength and hardness, while still providing stress relief. The final hardness was measured in the range of 220–240 HBW, which meets the machining requirement.
To verify the effectiveness of the heat treatment, I conducted a residual stress measurement using the hole-drilling method on a test coupon attached to the casting. The residual stress before heat treatment was measured as +320 MPa (tensile) on the surface of the cracked area. After the improved heat treatment, the residual stress dropped to +45 MPa, which is below the fatigue crack initiation threshold for this steel. Table 5 compares the heat treatment parameters between the original and improved processes.
| Parameter | Original | Improved |
|---|---|---|
| Preheat rate (RT–650°C) | 200°C/h | 120°C/h |
| Intermediate hold at 650°C | None | 2 h |
| Normalizing temperature | 860°C | 870°C |
| Normalizing hold time | 3 h | 5 h |
| Cooling method after normalizing | Air blast | Air cooling to 650°C, then furnace to 400°C |
| Tempering temperature | 550°C | 580°C |
| Tempering hold time | 3 h | 6 h |
| Final cooling from temper | Air | Furnace to 300°C, then air |
The improvement in the tempering temperature was based on the need to reduce the yield strength to a level that provides sufficient ductility while maintaining adequate wear resistance. I used the Hollomon-Jaffe parameter \( P \) to compare the tempering effect:
$$ P = T (C + \log t) $$
where \( T \) is the absolute temperature in Kelvin, \( t \) is the time in hours, and \( C \) is a material constant (approximately 20 for this steel). For the original temper: \( P_1 = (550+273)(20+\log 3) = 823 \times 20.477 = 16853 \). For the improved temper: \( P_2 = (580+273)(20+\log 6) = 853 \times 20.778 = 17724 \). The higher \( P \) value indicates a more fully tempered microstructure with lower residual stress and improved toughness.
6. Impurity Control and Inclusion Management
Metallurgical inclusions are known to act as crack initiation sites, particularly in thick-section lost foam castings. In the fractured surface of the rollers, I observed oxide inclusions and slag particles near the crack origin. These inclusions originate from deoxidation products, reoxidation during pouring, and the residue from the foam pattern. In the lost foam process, the molten steel coming into contact with the foam decomposition products can form carbonaceous films and oxides. To minimize these impurities, I implemented the following measures:
- Improved deoxidation: Before tapping, the melt was deoxidized with aluminum (0.08 wt%) and calcium-silicon alloy (0.2 wt%). The final dissolved oxygen was reduced to less than 25 ppm.
- Ceramic foam filters: I introduced ceramic foam filters with 10 pores per inch (ppi) in the gating system. These filters are effective in removing inclusions larger than 1 mm from the liquid steel. For a casting of this size, a total filter area of 0.4 m² was provided.
- Slag control: A pouring basin with a slag dam and a specially designed tundish was used to prevent ladle slag from entering the mold.
- Inert gas shrouding: In lost foam castings, the stream of molten steel is exposed to the atmosphere during pouring. I used an argon shroud around the pouring stream to minimize reoxidation. The argon flow rate was set at 20 L/min.
The inclusion level in the steel was evaluated by ultrasonic testing. In the original rollers, the indication count was 25 defects larger than 2 mm in the critical zone. In the improved rollers, this number reduced to 3, and no crack initiation was found.
I also investigated the possible role of hydrogen in the cracking. The foam pattern can introduce hydrogen from the decomposition of the organic material. Hydrogen embrittlement can cause delayed cracking in high-strength steels. I measured the hydrogen content in the liquid steel before pouring using a hydrogen probe. The original melt had a hydrogen content of 6.5 ppm, which is high. After improving the foam pattern drying and using vacuum treatment in the ladle, the hydrogen content was reduced to 3.2 ppm. The critical hydrogen level for cracking in this steel is approximately 5 ppm. By keeping the hydrogen below 4 ppm, I was able to eliminate the embrittlement contribution.
7. Numerical Simulation of Solidification and Stress
To validate the improvements in the casting process, I performed a numerical solidification simulation using the finite element method. The simulation model included the geometry of the roller, the lost foam mold, and the riser system. The thermophysical properties of ZG35CrMnSi and the sand mold were taken from the literature. The simulation allowed me to identify the hot spot location and to optimize the riser placement. The temperature field at 2 hours after pouring is shown in the contour plot. The hot spot is defined as the region where the temperature remains above the liquidus temperature for at least 30 minutes after the surrounding sections have solidified. I used the solidus temperature \( T_S = 1450°C \) and liquidus \( T_L = 1510°C \) for the simulation. The temperature gradient \( G \) and the solidification rate \( R \) were used to assess the crack susceptibility. The thermal stress was computed using the following constitutive relation:
$$ \sigma = E(T) [\epsilon – \epsilon_{th} – \epsilon_{pl}] $$
where \( \epsilon \) is the total strain, \( \epsilon_{th} \) is the thermal strain, and \( \epsilon_{pl} \) is the plastic strain. The simulation results showed that the maximum principal stress in the original design was 420 MPa at the transition between the flange and the body, which exceeded the ultimate tensile strength of the hot steel (320 MPa). In the improved design, with optimized riser and chills, the maximum principal stress was reduced to 180 MPa, well below the strength limit. This confirms that the cracking was indeed stress-induced and that the improved design provides a significant safety margin.
I also simulated the effect of the heating rate during heat treatment on the transient thermal stress. For a heating rate of 200°C/h, the simulation predicted a surface-to-center temperature difference of 180°C, causing a thermal stress of 250 MPa at the surface. For a heating rate of 120°C/h, the temperature difference was only 80°C, giving a thermal stress of 115 MPa. This further confirmed the importance of slow heating.
8. Experimental Verification on Trial Castings
After implementing all the corrective actions, I produced three trial rollers using the improved process. These rollers were subjected to the same inspection and machining procedures as the original batch. The trial rollers showed no cracks on the Ø440 stepped end face or in the internal bore. The results are summarized in Table 6.
| Roller No. | C Content (wt%) | Riser Volume (m³) | Riser Cutting Temp (°C) | Heat Treatment Cycle | Ultrasonic Defects | Crack Detection |
|---|---|---|---|---|---|---|
| T1 | 0.34 | 0.28 | 280 | Improved | 2 | None |
| T2 | 0.35 | 0.28 | 275 | Improved | 1 | None |
| T3 | 0.33 | 0.28 | 290 | Improved | 3 | None |
Metallographic examination of the trial rollers showed a fine pearlite microstructure with a small amount of ferrite, with no evidence of martensite or Widmanstätten ferrite. The grain size was ASTM 7-8, which is finer than the ASTM 5-6 obtained in the original rollers. The improved microstructure is a result of the lower carbon content and the optimized normalizing heat treatment.
In addition to the visual and ultrasonic inspection, I performed a magnetic particle inspection (MPI) on the machined surfaces of the trial rollers. No indications were found. The hardness profile across the wall thickness was uniform, with a variation of less than 15 HBW. This uniformity indicates the absence of hard spots and confirms that the heat treatment was effective in homogenizing the material.
9. Discussion: The Specificity of Lost Foam Castings
Throughout this investigation, I observed several phenomena that are unique to or exacerbated in lost foam castings. These include:
- Carbon pickup from foam pattern: The thermal decomposition of polystyrene produces free carbon and hydrogen-rich gases. In heavy sections, the liquid steel remains in contact with the gaseous products for a longer time, leading to carbon absorption. The carbon content of the final casting can be higher than the tapped melt. Therefore, the furnace analysis must be adjusted downward to account for this effect. In our case, reducing the target carbon to 0.33–0.36 gave a final carbon of 0.35–0.38, which is safely within the specification.
- Mold collapsibility and restraint: The unbonded sand mold in lost foam does not contain water or binders, but the sand particles can become partially fused or interlocked due to the high temperature. This reduces the collapsibility of the mold. In lost foam castings, the pattern material leaves a carbonaceous film on the sand surface, which may act as a bonding agent at elevated temperatures. The result is reduced mold yield, increased mechanical restraint, and higher tendency for hot tearing. I found that adding a small amount of combustible additive to the sand, such as 5% cellulose, can improve collapsibility. However, this must be balanced against the risk of gas evolution. In our final practice, I used a dry silica sand with a fine grain size (AFS 55) and added 3% zero-carbon organic additive to improve collapsibility without affecting the mold surface.
- Gas pressure and backpressure: During pouring of lost foam castings, the vaporization of the foam pattern creates a backpressure that can push against the solidifying shell. If the backpressure is too high, the shell may deform or crack. The vacuum level is critical in the lost foam process. For heavy castings, a moderate vacuum of −0.05 to −0.06 MPa is optimal. If the vacuum is too low, the gas evacuation is insufficient; if too high, the sand may be drawn into the mold or the foam pattern may collapse prematurely. I optimized the vacuum by monitoring the gas pressure at the vents and adjusting the vacuum pump speed accordingly.
- Surface quality and stress concentrations: Lost foam castings can have surface defects such as folds, wrinkles, and carbonaceous films on the surface. These defects are caused by incomplete foam decomposition or by the accumulation of liquid styrene residue. If the coating is not sufficiently permeable, the liquid styrene can become trapped and create a rough surface with sharp notches. These notches act as stress concentrators and promote crack initiation. In the improved practice, I increased the coating permeability and reduced the pouring temperature by 30°C (from 1600°C to 1570°C) to reduce the amount of foam gas generated. The surface roughness of the casting improved from Ra 25 µm to Ra 12 µm, as measured on the machined surfaces.
The combination of these factors makes lost foam castings particularly prone to cracking in large, thick-sectioned components. The key to success lies in a holistic approach that coordinates melting, molding, risering, and heat treatment. Each step must be optimized with the unique characteristics of the lost foam process in mind.
10. Economic Impact and Production Yield Improvement
The initial batch of five rollers was rejected due to cracking. The cost of each roller includes the material, processing, and lost production time. The rejection represented a direct loss of approximately €45,000 (including material and machining), plus the penalty cost for delayed delivery. After implementing the improvements, the subsequent three rollers passed all inspections, and the production yield increased from 0% to 100%. The additional costs for improved coating, filters, and heat treatment amounted to €2,300 per roller, which is negligible compared to the cost of a rejected casting. The improvements also reduced the machining time by 15% because the uniformity of hardness and the absence of cracks reduced tool wear and rework.
I quantified the fracture avoidance using the concept of stress intensity factor. The critical crack size for this material under an applied stress of 100 MPa is:
$$ a_c = \frac{1}{\pi} \left( \frac{K_{IC}}{\sigma} \right)^2 $$
where \( K_{IC} \) is the fracture toughness (approximately 45 MPa·m^0.5). Substituting the values gives:
$$ a_c = \frac{1}{\pi} \left( \frac{45}{100} \right)^2 = 0.0645 \ \text{m} = 64.5 \ \text{mm} $$
This means that an internal defect larger than 64.5 mm would fail under a stress of 100 MPa. The improved process eliminated all such defects. The residual stress measurement showed a 86% reduction in surface stress, which further increases the safety margin.
11. Standardization and Documentation of the Improved Process
To ensure consistent production quality in lost foam castings, I documented the entire improved process in a detailed standard operating procedure (SOP). The SOP includes the following sections:
| Section | Content | Key Parameters |
|---|---|---|
| 1. Melting | Charge calculation, melting practice, slag control | Target C: 0.32–0.35%, final C: 0.33–0.38% |
| 2. Foam pattern | Pattern density, coating application, drying | Density: 22 kg/m³, coating thickness: 1.0 mm |
| 3. Mold preparation | Sand properties, vacuum level, compaction | AFS 55, vacuum: −0.05 to −0.06 MPa |
| 4. Pouring | Pouring temperature, pouring time, filters | 1570°C, 60 s, foam filters 10 ppi |
| 5. Cooling and shakeout | Cooling time, shakeout temperature | ≥ 24 h, ≥ 500°C |
| 6. Riser cutting | Cutting temperature, method | 250–300°C, oxy-fuel torch |
| 7. Heat treatment | Normalizing, tempering, heating rates | 870°C/5h, 580°C/6h |
| 8. Inspection | Chemical analysis, UT, MPI, hardness | C: 0.30–0.40, no defects, 220–240 HBW |
I also introduced a checklist for the operators to follow before each pour. The checklist includes verification of the carbon content in the last heats, the coating condition of the foam pattern, the vacuum level, and the availability of the heat treatment furnace. This ensures that no production step is overlooked.
12. Conclusion
The cracking of ZG35CrMnSi rollers produced by the lost foam casting process was caused by a combination of excessively high carbon content, insufficient riser feeding, improper riser cutting, and inadequate heat treatment. The high carbon content resulted from a lack of furnace control and carbon pickup from the foam pattern. The original riser design had insufficient volume and modulus, leaving microporosity in the hot spot. Cutting the risers at room temperature created heat-affected zones with martensitic structures, which acted as crack initiation sites. The heat treatment was not optimized for such a heavy section, leading to high residual stresses. By systematically addressing each of these factors, I successfully eliminated the cracking defect.
The improvements can be summarized in the following key points:
- Strictly controlled carbon content to 0.33–0.36 wt% before pouring, accounting for carbon pickup in lost foam castings.
- Redesigned the riser with a larger volume and modulus, and used an insulating sleeve to improve feeding efficiency.
- Implemented hot riser cutting at 250–300°C, followed by immediate stress relief.
- Optimized the heat treatment with a slower heating rate, an intermediate hold at 650°C, and a higher tempering temperature of 580°C.
- Improved the coating permeability, added filters, and controlled inclusions to reduce crack initiation sites.
- Validated the improved process through numerical simulation and trial production, confirming zero cracks and uniform properties.
The success of this project demonstrates that lost foam castings of large steel parts can be produced reliably if the process is properly engineered. The principles used here—controlled composition, optimized risering, proper cutting practice, and tailored heat treatment—are applicable to other heavy steel castings produced by the lost foam method. I believe this analysis will be a valuable reference for engineers working with lost foam castings who face similar cracking challenges.
Future work should focus on real-time monitoring of gas pressure and mold temperature during pouring to further optimize the lost foam process. Additionally, the use of simulation-based optimization for riser design and heat treatment scheduling can reduce the trial-and-error period. I also recommend developing a database of crack-susceptibility coefficients for different steel grades in lost foam castings, to enable predictive modeling of crack formation before the actual pour.