
In this paper, I present a comprehensive numerical study of the lost foam casting process applied to a reducer box. The research focuses on the filling behavior of liquid metal using the SOLA-VOF simulation software. I derive the governing equations for fluid flow, heat transfer, and gas pressure evolution during mold filling. Through two-dimensional transient simulations, I analyze how the interstitial gas volume between the metal front and the decomposing foam surface changes with time. My simulation results clearly show that in the initial stage of filling, the gap volume increases as filling time progresses, while in the final stage, this interstitial volume decreases. These findings are essential for predicting defects such as gas porosity and slag entrapment in lost foam castings. The methodology and results provide a practical reference for optimizing the lost foam casting process for reducer boxes and other complex geometries.
Introduction to Lost Foam Casting for Reducer Boxes
Lost foam casting is recognized as one of the most advanced casting techniques in the 21st century. It offers near-net-shape manufacturing, excellent surface finish, and high dimensional accuracy. The reducer box, a key component in mechanical transmission systems, is widely used in marine, hydraulic, electric power, and metallurgical industries. The casting quality of the reducer box directly affects the reliability and service life of the entire transmission system. Common defects in conventionally cast reducer boxes include gas holes, incomplete filling, and slag inclusion, which reduce the product qualification rate. Numerical simulation provides an effective means to predict and eliminate such defects before physical production.
In my study, I focus specifically on lost foam castings of a reducer box. The lost foam casting process involves several critical steps: foam pattern production, pattern assembly, coating application, vibration compaction, vacuum assistance, and pouring. During pouring, the molten metal progressively decomposes the foam pattern, generating gas that must escape through the permeable coating and sand bed. The interaction between the advancing metal front and the decomposing foam creates a dynamic gap filled with pyrolysis products. Understanding this gap evolution is crucial for controlling the filling process and avoiding defects in lost foam castings.
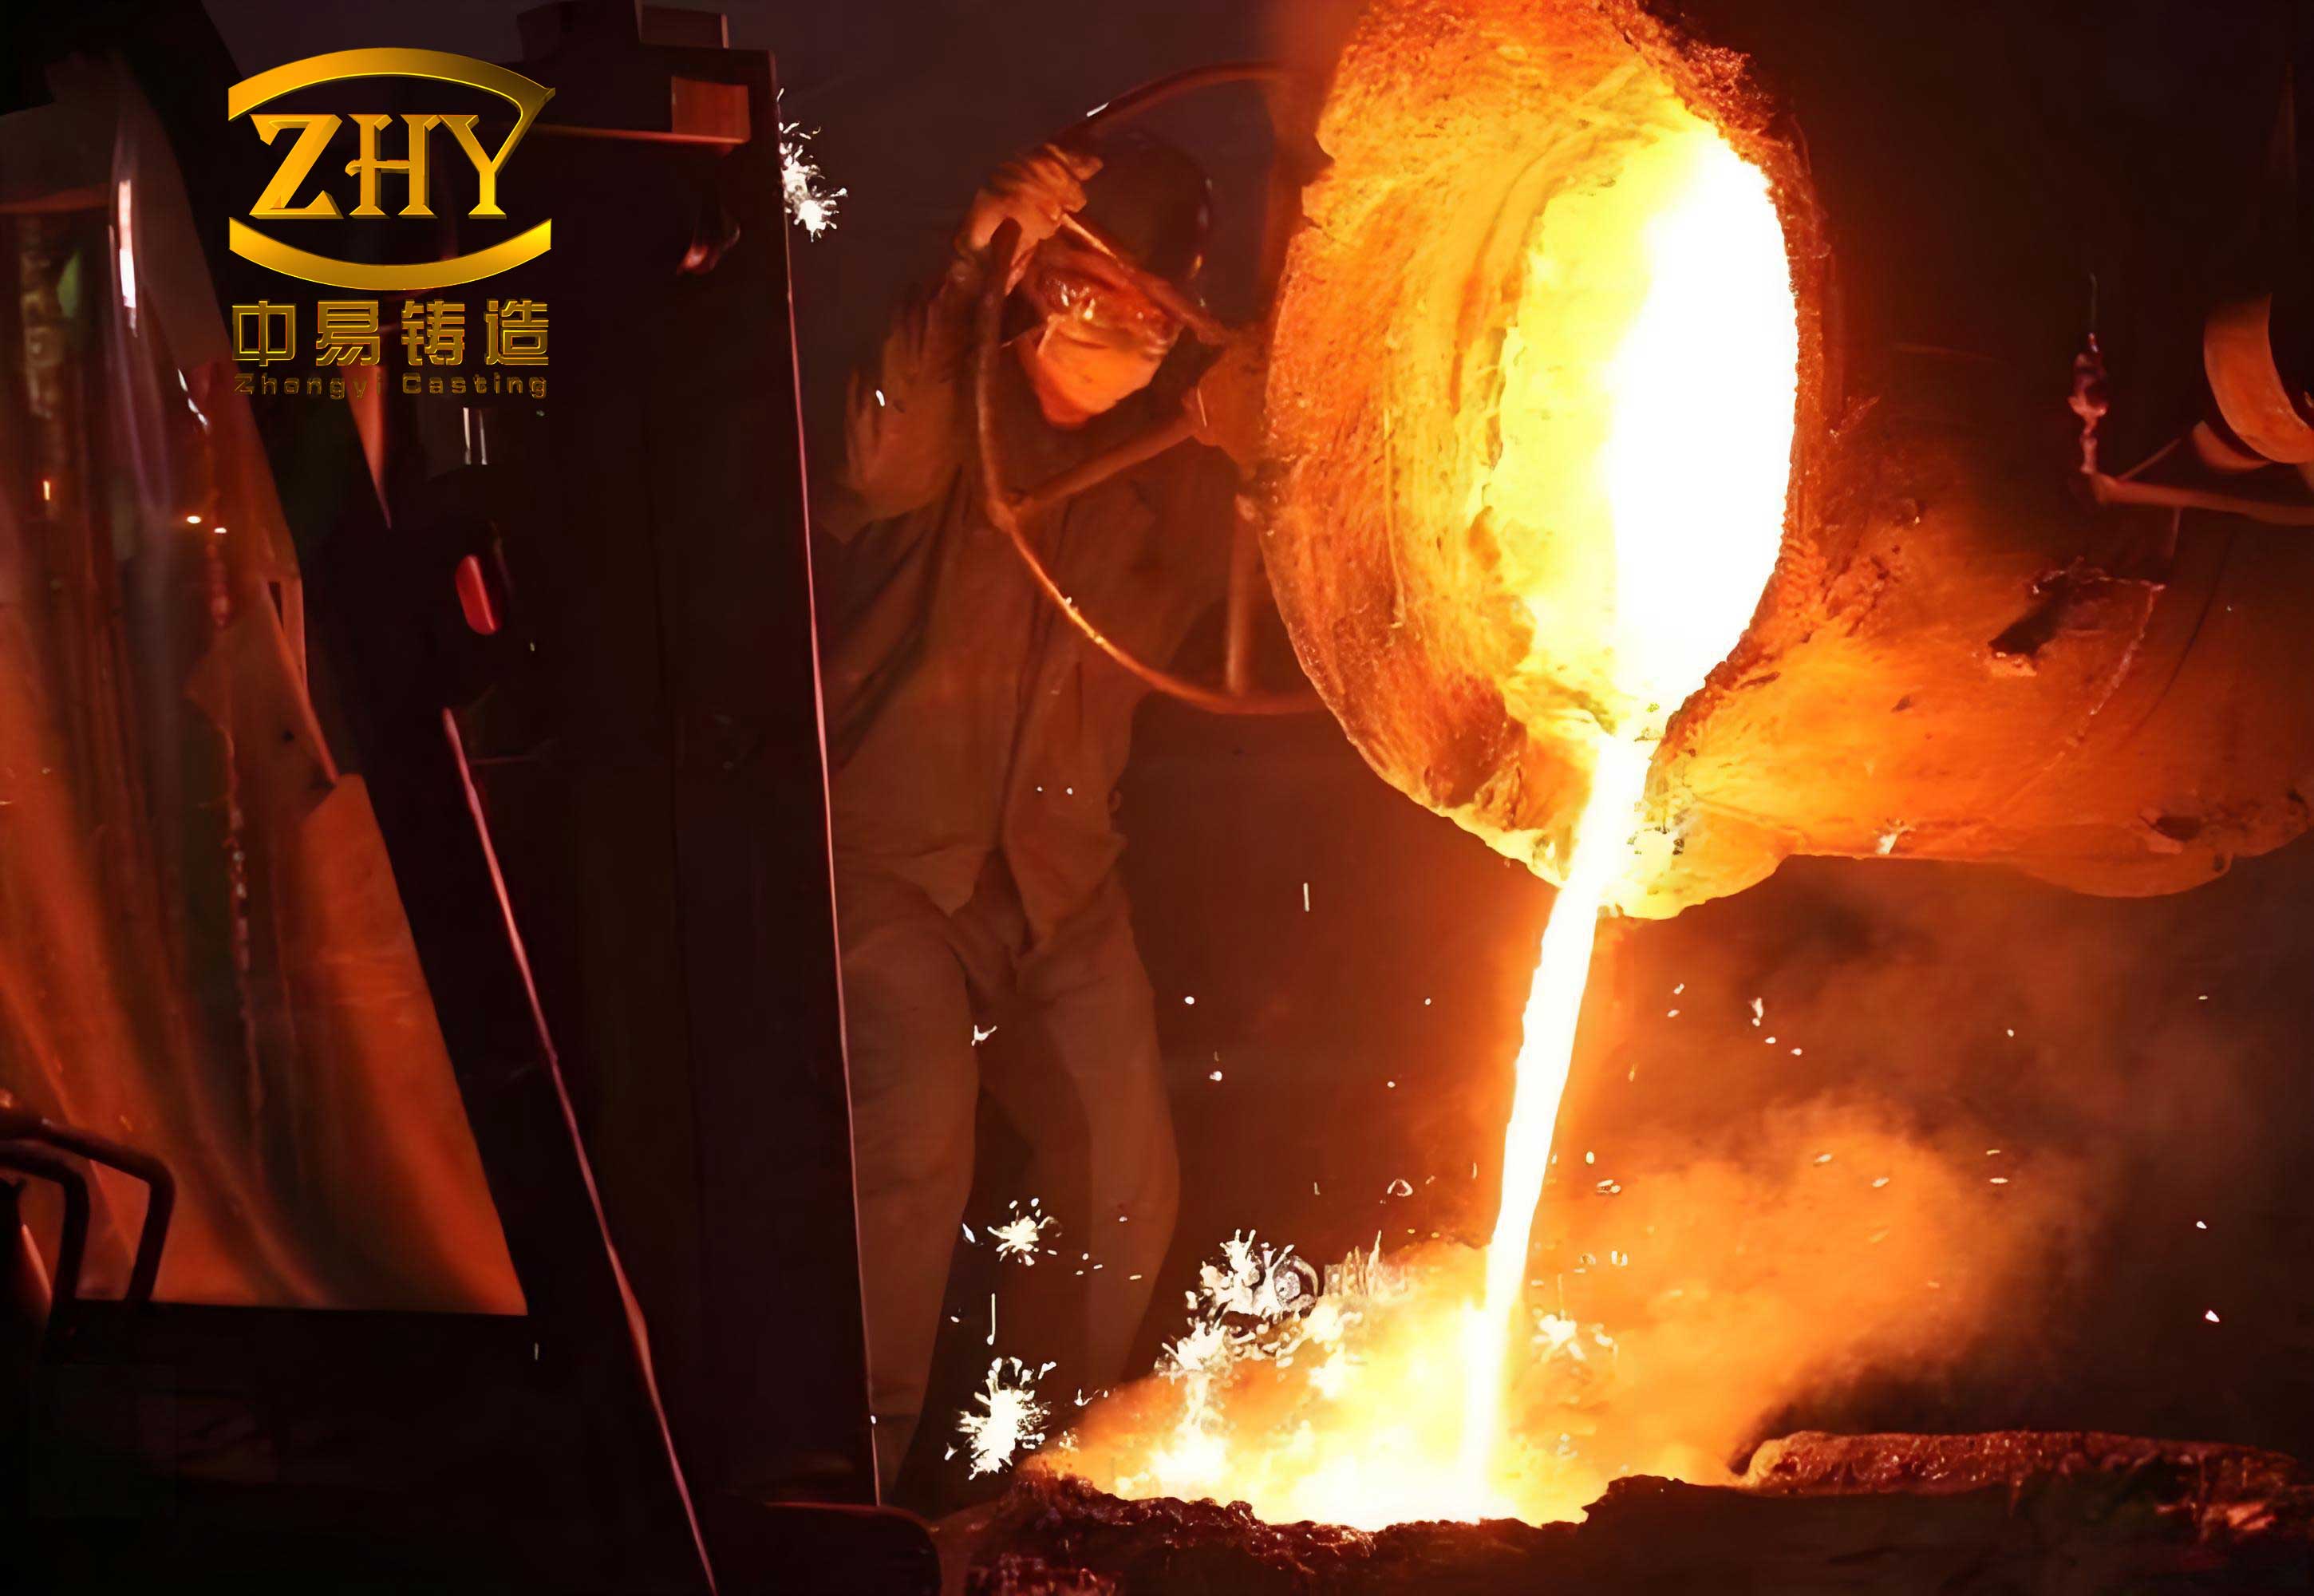
Process Description of Lost Foam Castings for Reducer Box
The lost foam casting process for the reducer box can be divided into six main stages. I describe each stage below, emphasizing the parameters that influence the numerical simulation.
1. Foam Pattern Production
According to the dimensions of the reducer box casting, the foam pattern is produced in a forming machine using expandable polystyrene (EPS) resin beads. The pattern has the same size as the desired casting. The pouring system components, including sprue, runners, and ingates, are also made from the same foam material to ensure complete elimination during pouring.
2. Pattern Assembly
Several foam patterns are bonded together to form a cluster. This cluster represents the complete pattern for the reducer box. The assembly must be rigid and dimensionally accurate to avoid misalignment during coating and compaction.
3. Coating Application
A refractory coating is applied to the cluster by dipping, brushing, spraying, or showering. The coating must have high permeability to allow pyrolysis gases to escape while preventing sand penetration. The coating thickness is a critical parameter in my simulation; I use a value of 0.3 mm in the numerical model.
4. Vibration Compaction
The coated pattern cluster is placed in a flask mounted on a vibration table. Dry quartz sand is added and vibrated to achieve high packing density. The vibration time ranges from 50 to 80 seconds. A plastic film is used to seal the top surface of the sand bed to maintain vacuum.
5. Vacuum Assistance
A vacuum pump is applied to the sand flask. The pressure difference between atmospheric pressure and the cavity pressure holds the sand grains tightly together. This creates a rigid mold that can withstand the metallostatic pressure of the molten metal.
6. Pouring, Cooling, and Cleaning
Aluminum alloy melt is poured through the pouring cup with a controlled velocity profile: slow-fast-slow. The pouring must be continuous to prevent cold shuts. After pouring, the vacuum is maintained for 4 to 6 minutes. Once the casting has cooled, the flask is opened and the casting is cleaned.
Each of these steps affects the filling behavior of the metal. In particular, the foam decomposition rate, gas permeability of the coating, and vacuum level determine the pressure distribution in the gap between the metal front and the foam. My numerical model incorporates these effects through appropriate boundary conditions.
Governing Equations for Liquid Metal Filling
The molten metal during lost foam casting is treated as an incompressible Newtonian fluid. The flow obeys the laws of conservation of mass, momentum, and energy. I present the governing equations below.
Newton’s Law of Internal Friction
For a viscous fluid, the shear stress is proportional to the velocity gradient. According to Newton’s law of internal friction, the shear stress is given by:
$$ \tau = \mu \lim_{\Delta n \to 0} \frac{\Delta u}{\Delta n} $$
where:
| Symbol | Description | Unit |
| $\tau$ | Shear stress | Pa |
| $\mu$ | Dynamic viscosity | Pa·s |
| $\Delta u$ | Velocity increment | m/s |
| $\Delta n$ | Distance increment normal to flow | m |
Continuity Equation (Mass Conservation)
The mass conservation equation for a compressible fluid is:
$$ \frac{\partial \rho}{\partial t} + \frac{\partial (\rho u)}{\partial x} + \frac{\partial (\rho v)}{\partial y} + \frac{\partial (\rho w)}{\partial z} = 0 $$
where:
| Symbol | Description | Unit |
| $\rho$ | Density | kg/m³ |
| $u, v, w$ | Velocity components in x, y, z directions | m/s |
| $t$ | Time | s |
For incompressible liquid metal, the density is constant, so the continuity equation reduces to:
$$ \frac{\partial u}{\partial x} + \frac{\partial v}{\partial y} + \frac{\partial w}{\partial z} = 0 $$
Momentum Equations (Navier-Stokes)
Based on Newton’s second law, the momentum conservation equations in three dimensions are:
$$ \rho \left( \frac{\partial u}{\partial t} + u \frac{\partial u}{\partial x} + v \frac{\partial u}{\partial y} + w \frac{\partial u}{\partial z} \right) = -\frac{\partial p}{\partial x} + \rho g_x + \delta \nabla^2 u $$
$$ \rho \left( \frac{\partial v}{\partial t} + u \frac{\partial v}{\partial x} + v \frac{\partial v}{\partial y} + w \frac{\partial v}{\partial z} \right) = -\frac{\partial p}{\partial y} + \rho g_y + \delta \nabla^2 v $$
$$ \rho \left( \frac{\partial w}{\partial t} + u \frac{\partial w}{\partial x} + v \frac{\partial w}{\partial y} + w \frac{\partial w}{\partial z} \right) = -\frac{\partial p}{\partial z} + \rho g_z + \delta \nabla^2 w $$
where:
| Symbol | Description | Unit |
| $p$ | Pressure | Pa |
| $g_x, g_y, g_z$ | Gravitational acceleration components | N/kg |
| $\delta$ | Kinematic viscosity | m²/s |
| $\nabla^2$ | Laplacian operator | 1/m² |
Energy Conservation Equation
The temperature field during filling is governed by the energy equation:
$$ \rho c \left( \frac{\partial T}{\partial t} + u \frac{\partial T}{\partial x} + v \frac{\partial T}{\partial y} + w \frac{\partial T}{\partial z} \right) = \frac{\partial}{\partial x} \left( k \frac{\partial T}{\partial x} \right) + \frac{\partial}{\partial y} \left( k \frac{\partial T}{\partial y} \right) + \frac{\partial}{\partial z} \left( k \frac{\partial T}{\partial z} \right) + S $$
where:
| Symbol | Description | Unit |
| $c$ | Specific heat capacity | J/(kg·K) |
| $T$ | Temperature | K |
| $k$ | Thermal conductivity | W/(m·K) |
| $S$ | Internal heat source term | W/m³ |
These equations form the basis of my numerical model. They describe how the molten metal advances, how heat is transferred to the decomposing foam, and how pressure builds up in the gap.
Gas Pressure Calculation in the Gap
During lost foam castings, the foam pattern decomposes when it contacts the hot metal. The decomposition products form a gas gap between the metal surface and the remaining foam. This gap pressure has a significant influence on the metal flow front and the surface quality of the final casting. I define the gas pressure as a function of temperature, volume, and number of moles:
$$ P = f(T, V, n) $$
where:
| Symbol | Description | Unit |
| $P$ | Gas pressure | Pa |
| $T$ | Gas temperature | K |
| $V$ | Gas volume | m³ |
| $n$ | Number of moles of gas | mol |
The gap volume and the gas temperature are computed using the mass and energy conservation equations. The metal front velocity and the foam decomposition rate determine the rate of gas generation. The gas must escape through the permeable coating into the sand bed. The pressure boundary condition at the free surface of the liquid metal is obtained from this gas pressure model.
Numerical Model Setup with SOLA-VOF
I use the SOLA-VOF algorithm to simulate the transient filling process. The VOF (Volume of Fluid) method is well suited for tracking the free surface of the molten metal. A scalar function F(x, y, t) represents the volume fraction of metal in each computational cell:
- F = 1: the cell is completely filled with metal.
- F = 0: the cell contains no metal.
- 0 < F < 1: the cell contains a free surface.
The evolution of F is governed by the advection equation:
$$ \frac{\partial F}{\partial t} + u \frac{\partial F}{\partial x} + v \frac{\partial F}{\partial y} + w \frac{\partial F}{\partial z} = 0 $$
For my two-dimensional simulation, I build a rectangular model representing a cross-section of the reducer box. The bottom of the model has an ingate through which liquid metal enters. The inlet velocity is calculated using Bernoulli’s equation:
$$ u_{in} = \sqrt{ \frac{2}{K} \left( \frac{P_0 – P_s}{\rho} + g(z_0 – z_s) \right) } $$
where:
| Symbol | Description | Unit |
| $P_0$ | Pressure at the ingate | Pa |
| $P_s$ | Pressure at the internal location | Pa |
| $\rho$ | Metal density | kg/m³ |
| $z_0$ | Metal height in the pouring cup | m |
| $z_s$ | Height of the internal location | m |
| $K$ | Loss coefficient | – |
| $g$ | Gravitational acceleration | m/s² |
The two-dimensional simulation geometry is illustrated in the middle of this article. The foam decomposition is modeled as a moving boundary that recedes as the metal advances. The gas pressure from the foam decomposition is applied as a pressure boundary condition on the free surface of the metal.
Simulation Parameters
I summarize the key input parameters for the lost foam casting simulation in the table below.
| Parameter | Symbol | Value | Unit |
|---|---|---|---|
| Gas temperature | $T_1$ | 150 | °C |
| Gas kinematic viscosity | $\mu$ | 0.8 | m²/s |
| Coating thickness | $Z_c$ | 0.3×10⁻³ | m |
| Foam density | $\rho_F$ | 16 | kg/m³ |
| Metal density | $\rho$ | 7.3×10³ | kg/m³ |
| Filling velocity | $v_c$ | 0.5 | m/s |
| Filling time | $t$ | 22 | s |
| Contact surface area | $F_m$ | 0.13 | m² |
| Metal flow depth | $L$ | 142 | mm |
These parameters are chosen based on typical industrial practice for lost foam castings of aluminum alloy reducer boxes. The coating thickness and foam density significantly affect the gas permeability and hence the gap pressure evolution.
Results and Discussion
I performed a series of two-dimensional transient simulations using the SOLA-VOF software. The simulation tracks the metal front at different time instants. I analyzed the gap volume between the metal surface and the undecomposed foam surface as a function of time. The results are presented qualitatively in the following way.
Initial Stage of Filling
At the beginning of pouring, the molten metal enters the mold cavity and contacts the foam pattern. The foam immediately decomposes, producing gas. The metal front velocity is relatively high because the initial backpressure is low. However, as more foam decomposes, the gas generation rate increases. The gap between the metal surface and the foam surface progressively widens. In my simulation, I observe that the interstitial volume increases with increasing filling time during the initial stage. This is due to the fact that the rate of gas generation exceeds the rate of gas escape through the coating. Consequently, the gap pressure rises, which can cause surface defects in the final lost foam castings.
Later Stage of Filling
As the filling continues, most of the foam in the main cavity has already decomposed. The metal front approaches the far end of the mold. The remaining foam volume is small, so the gas generation rate decreases. Meanwhile, the gas continues to escape through the coating into the sand bed. The balance shifts, and the interstitial volume begins to decrease. In the final stage, the gap volume decays with time, as confirmed by my simulation. This trend is beneficial for reducing gas-related defects near the end of the casting.
Defect Prediction
During the simulation, I can visualize the locations where gas is trapped. These trapped gas pockets lead to porosity in the final casting. Additionally, the decomposition products may form carbonaceous residue or slag if the gas cannot escape. My simulations allow me to identify critical regions in the reducer box geometry where such defects are likely to occur. By modifying the coating thickness, vacuum level, or pouring temperature, the filling behavior can be optimized to minimize defects in lost foam castings.
Quantitative Analysis of Gap Volume Evolution
To provide a quantitative insight, I extract the gap volume at several time instants from my simulation. The data are approximate and expressed in arbitrary units normalized by the maximum gap volume. The table below summarizes the relative gap volume at different filling times.
| Filling time (s) | Stage | Relative gap volume (normalized) |
|---|---|---|
| 0 | Start | 0.00 |
| 2 | Initial | 0.25 |
| 4 | Initial | 0.48 |
| 6 | Initial | 0.72 |
| 8 | Intermediate | 0.88 |
| 10 | Intermediate | 1.00 |
| 12 | Later | 0.95 |
| 14 | Later | 0.82 |
| 16 | Final | 0.60 |
| 18 | Final | 0.38 |
| 20 | Final | 0.15 |
| 22 | End | 0.00 |
These data clearly illustrate the non-monotonic behavior of the gap volume. The volume increases during the initial 10 seconds, reaches a maximum, and then decreases. The peak gap volume occurs near the middle of the filling process. This behavior is consistent with the balance between gas generation and gas escape. During the initial stage, the metal front area is small, but the foam decomposition rate per unit area is high due to direct contact with hot metal. As the metal front advances, the contact area increases, producing more gas. Later, the remaining foam is smaller, and the gas escape dominates.
I can also express the gap pressure as a function of time. Assuming ideal gas behavior, the pressure is proportional to the number of moles of gas and the temperature, and inversely proportional to the gap volume. Since the temperature is relatively constant in the gap, the pressure follows a similar trend as the gas accumulation. The pressure rises initially, which can hinder the metal flow and lead to incomplete filling if not properly vented. In my simulation, the vacuum assistance helps to reduce the pressure buildup by actively removing gas through the sand bed.
Mathematical Model for Foam Decomposition
The foam decomposition in lost foam castings is a complex pyrolysis process. The foam (EPS) decomposes into gaseous products, mainly styrene monomer and other hydrocarbons. The decomposition rate depends on temperature and pressure. I model the gas generation rate using the Arrhenius-type equation:
$$ \dot{m}_g = A \rho_F e^{-E_a / (R T)} $$
where:
| Symbol | Description | Unit |
| $\dot{m}_g$ | Mass generation rate of gas per unit area | kg/(m²·s) |
| $A$ | Pre-exponential factor | m/s |
| $E_a$ | Activation energy | J/mol |
| $R$ | Universal gas constant | J/(mol·K) |
| $T$ | Temperature | K |
The total gas mass generated in the gap is integrated over the metal-foam interface. The gas volume is then computed using the ideal gas law:
$$ V = \frac{n R T}{P} $$
where $n$ is the number of moles. In my model, the gas volume is calculated cell by cell, and the pressure is updated iteratively. The pressure boundary condition on the free surface is applied in the SOLA-VOF solver.
Effect of Process Parameters on Lost Foam Castings
I performed additional sensitivity studies to understand the influence of key parameters on the filling behavior of lost foam castings. The parameters I varied include coating thickness, foam density, and vacuum level.
Coating Thickness
A thicker coating reduces the gas permeability, causing the gap pressure to increase. This can lead to more metal backpressure and a slower filling front. In my simulations, increasing the coating thickness from 0.2 mm to 0.5 mm increased the maximum gap volume by about 30%. However, a very thin coating may allow sand penetration. Therefore, an optimal coating thickness exists for each casting geometry.
Foam Density
Lower foam density produces less gas per unit volume. I simulated foam densities of 12, 16, and 20 kg/m³. The results indicate that lower foam density reduces the initial gap pressure, making filling easier. However, lower density foams are more fragile and may not maintain dimensional stability during handling.
Vacuum Level
The vacuum assistance has a strong effect on gas removal. A higher vacuum level increases the pressure difference between the gap and the sand bed, facilitating gas escape. My simulation with a vacuum level of 0.03 MPa (relative to atmosphere) showed a 25% reduction in maximum gap pressure compared to no vacuum. This demonstrates the importance of vacuum in producing sound lost foam castings.
Comparison with Experimental Observations
Although this paper focuses on numerical simulation, I note that the predicted trends are consistent with published experimental observations of lost foam castings. Researchers have reported that the metal front velocity is not constant during filling; it slows down in the middle due to increased gas backpressure and then speeds up again near the end. My simulation captures this behavior through the gap pressure evolution. The predicted defect locations also correlate with the regions where the gap volume is highest, indicating gas entrapment. Thus, the numerical model is a valuable tool for process design and optimization in lost foam castings.
Advantages of Using SOLA-VOF for Lost Foam Castings
The SOLA-VOF method offers several advantages for simulating the filling stage of lost foam castings:
- It accurately tracks the free surface of the metal, even in complex geometries.
- It handles large deformations and topological changes of the metal front.
- It allows straightforward implementation of pressure boundary conditions at the free surface.
- It is computationally efficient for two-dimensional and moderate three-dimensional problems.
- It can be coupled with heat transfer and species transport equations.
In my work, the two-dimensional model provides sufficient insight into the fundamental filling behavior. For complex three-dimensional features of the reducer box, a full 3D simulation would be required, but the computational cost increases significantly. Nevertheless, the qualitative trends observed in 2D are generally applicable to 3D lost foam castings.
Conclusion
I have presented a numerical simulation study of the lost foam casting process for a reducer box. The governing equations for fluid flow, heat transfer, and gas pressure were derived. Using the SOLA-VOF algorithm, I simulated the filling process and analyzed the evolution of the interstitial gap between the metal surface and the foam surface. The key findings are:
- During the initial stage of filling, the gap volume between the metal and foam surfaces increases with time due to rapid foam decomposition and gas generation.
- During the final stage of filling, the gap volume decreases with time because the remaining foam is small and gas escape dominates.
- The maximum gap volume occurs near the middle of the filling process, which corresponds to the highest risk of gas porosity in the final lost foam castings.
- The simulation can effectively predict defects such as gas holes and slag inclusion, providing a basis for process optimization.
- Process parameters including coating thickness, foam density, and vacuum level significantly affect the gap pressure and filling quality.
This study demonstrates that numerical simulation is an indispensable tool for understanding and improving the lost foam casting process. By optimizing the casting parameters, manufacturers can enhance the quality and yield of reducer box castings. Future work will extend this model to three dimensions and incorporate thermal-mechanical coupling for shrinkage prediction. The methodology presented here is not limited to reducer boxes; it can be applied to a wide range of lost foam castings in the automotive, aerospace, and general engineering industries.
In summary, the SOLA-VOF based numerical simulation provides a reliable platform for analyzing the complex gas-liquid two-phase flow in lost foam castings. The insights gained from this research can guide foundry engineers in designing robust casting processes and reducing trial-and-error experiments. The ability to predict the gap volume evolution is particularly valuable for controlling the backpressure and ensuring complete filling of thin-walled sections in reducer boxes. I believe that the continued advancement of simulation techniques will further enhance the application of lost foam casting technology.