
Ductile iron, also known as spheroidal graphite cast iron, is a cost-effective and high-performance material that has been widely used in automotive manufacturing, wind power generation, rail transportation, and many other industrial sectors. The mechanical properties of ductile iron are highly dependent on its microstructural features, especially the graphite nodule morphology, ferrite grain size, and pearlite characteristics. In recent years, the increasing demand for lightweight and high-strength components has motivated foundry engineers to explore advanced casting techniques. Among these techniques, lost foam casting has become one of the most attractive near-net-shape manufacturing processes. However, in lost foam castings, the use of dry sand as the mold medium leads to a relatively slow cooling rate compared with conventional green sand or metal molds. This slow cooling often results in coarse dendrites and large graphite nodules, which degrade the final mechanical properties. To overcome this issue, I introduced mechanical vibration during the solidification stage of lost foam casting. The main purpose of this work is to evaluate the effect of mechanical vibration on the microstructures and mechanical properties of QT400-18 ductile iron produced by lost foam castings.
Experimental Materials and Methods
I prepared QT400-18 ductile iron using pig iron, scrap steel, and ferrosilicon as the main raw materials. The chemical compositions of the raw materials are summarized in Table 1. The nodulizing treatment was carried out with 1.6 wt.% FeSiCaMgRE alloy, and inoculation was performed with 0.5 wt.% CaBa-FeSi alloy. Table 2 lists the chemical compositions of the nodulizer and inoculant used in the experiments.
| Material | C | Si | Mn | S | P | Fe |
|---|---|---|---|---|---|---|
| Pig iron | 4.07 | 0.72 | 0.06 | 0.012 | 0.026 | Balance |
| Scrap steel | 0.05 | 0.01 | 0.26 | 0.005 | 0.014 | Balance |
| Ferrosilicon | 0.035 | 72.15 | — | 0.003 | 0.008 | Balance |
| Alloy | Si | Al | Mg | Ca | RE | Ba | Fe |
|---|---|---|---|---|---|---|---|
| Nodulizer | 45.96 | 0.72 | 5.69 | 1.09 | 0.89 | — | Balance |
| Inoculant | 72.99 | 1.15 | — | 1.73 | — | 2.25 | Balance |
I used a double-motor one-dimensional vertical vibration table to produce mechanical vibration during casting. Vertical vibration was chosen because it has the most significant effect on mold compaction and on the solidification behavior of metallic alloys. The vibration table is shown schematically in the following figure. The vibration frequency was controlled by a frequency converter, while the amplitude was adjusted by changing the phase angle of eccentric blocks driven by two motors. The frequency range used in this study was 0–50 Hz, and the amplitude range was 0–2 mm.
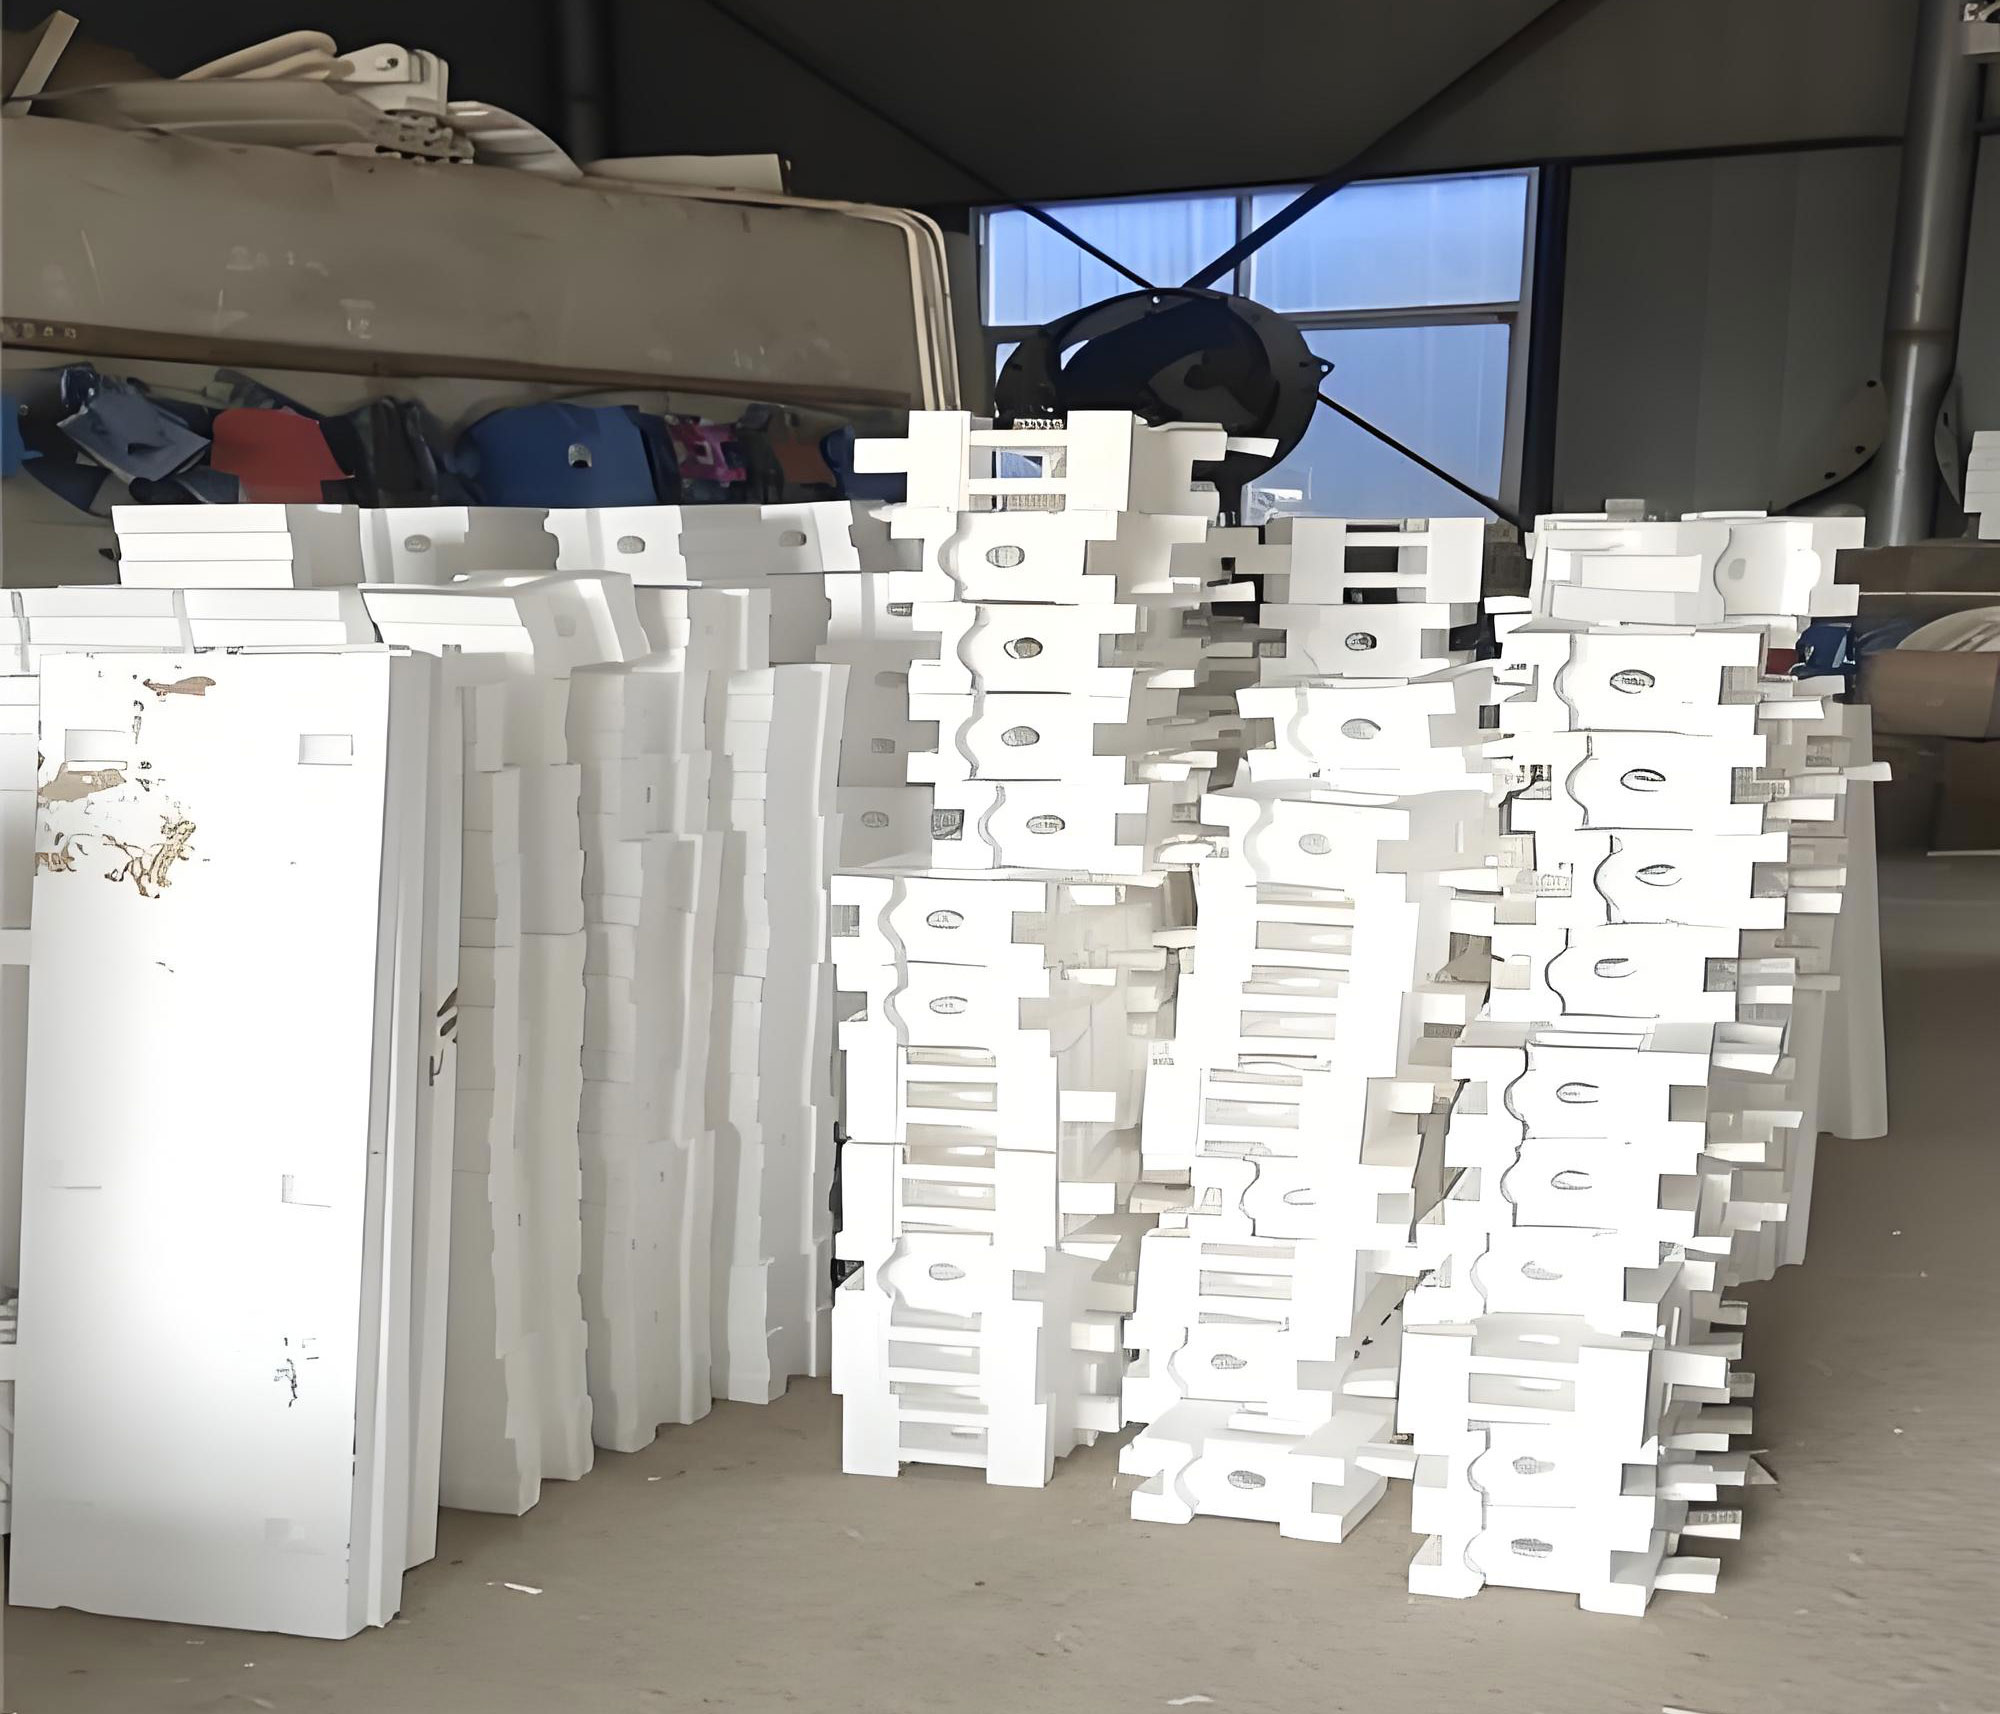
I prepared polylactic acid foam patterns by cutting and bonding. The foam model was coated with refractory slurry and dried three times. Dry silica sand with a grain size of 20–40 mesh was used to fill the flask. The flask was firmly fixed on the vibration platform, and the vibration was started to compact the sand. A negative pressure of 0.06 MPa was maintained throughout the casting process. The metal was melted in a medium-frequency induction furnace. When the metal temperature reached 1450°C, ferrosilicon was added to adjust the silicon content. The molten metal was tapped at 1500°C. Before tapping, a carbon-silicon analyzer was used to verify the carbon and silicon contents. The nodulizer and inoculant were placed at the bottom of the pouring ladle and covered with steel chips. The molten metal was then poured into the ladle for nodulizing and inoculation. Once the vibration table reached the preset frequency and amplitude, the molten metal was poured into the sprue. Vibration was maintained during pouring and solidification, and the negative pressure was held for 10 minutes after pouring.
For metallographic observation, I cut samples from the same location of each casting. The samples were ground, polished, and etched with a 4% nitric acid alcohol solution. I used an Olympus optical microscope to observe the graphite morphology and matrix microstructure. The graphite nodule count, spheroidization rate, graphite diameter, and graphite volume fraction were measured using image-pro plus 6.0 software according to ASTM A247 and GB/T 9441-2009 standards. The ferrite grain size was evaluated by the mean intercept method according to GB/T 6394-2002. Tensile tests were performed using an E45-305 universal testing machine at a cross-head speed of 1 mm/min. The tensile specimen geometry is shown in Figure 2 of the original specification; the gauge length was measured before and after fracture to calculate elongation. Low-temperature impact tests were carried out using a MTS impact testing machine with Charpy V-notch specimens of the standard geometry. Hardness was measured with a UH250 universal hardness tester. Friction and wear tests were conducted on an IPC-7010 tribometer with a tungsten carbide ball of 6 mm diameter, under a load of 50 N, frequency of 2 Hz, sliding distance of 10 mm, and wear time of 30 minutes. Fracture surfaces and worn surfaces were observed by scanning electron microscopy and three-dimensional laser confocal microscopy.
Influence of Vibration Frequency on Microstructure
Graphite Morphology
I fixed the vibration amplitude at 1.5 mm and varied the vibration frequency from 0 Hz to 30 Hz, 40 Hz, and 50 Hz. The graphite microstructures of the resulting lost foam castings are shown in the metallographs observed during the experiments. Without vibration, the graphite nodules were relatively coarse and the graphite fraction was low, with many irregular graphite particles. When the vibration frequency was 30 Hz, the graphite nodule count increased and the average graphite size decreased. At 40 Hz, the graphite nodules became smaller and more uniformly distributed, and the spheroidization rate reached a maximum. At 50 Hz, the graphite size continued to decrease slightly, but the nodularity decreased because the intense vibration disturbed the spherical growth environment of the graphite.
| Frequency (Hz) | Spheroidization rate (%) | Spheroidization grade | Average graphite diameter (μm) | Graphite content (%) |
|---|---|---|---|---|
| 0 | 78.8 | 4 | 33.86 | 13.58 |
| 30 | 83.1 | 3 | 29.61 | 15.21 |
| 40 | 85.9 | 3 | 27.09 | 16.26 |
| 50 | 82.3 | 3 | 26.44 | 16.41 |
From Table 3, I observed that the graphite content increased from 13.58% to 16.41% as the vibration frequency increased from 0 Hz to 50 Hz. The average graphite diameter decreased from 33.86 μm to 26.44 μm. The spheroidization rate increased from 78.8% to 85.9% when the frequency was raised from 0 Hz to 40 Hz, but then decreased to 82.3% at 50 Hz. This indicates that a moderate mechanical vibration can promote the nucleation and spheroidization of graphite in lost foam castings, while excessive vibration may be detrimental to the graphite morphology.
Ferrite Grain Refinement
The matrix of the studied ductile iron consisted of ferrite, pearlite, and graphite. I used the three-circle intercept method to quantify the ferrite grain size. The volume fraction of ferrite in the matrix was estimated from the area fraction of ferrite in the un-etched and etched conditions. The volume fraction of ferrite was calculated as:
$$V_{V\alpha}=(1 – V_{\text{graphite}}) \times f_\alpha$$
where \(V_{\text{graphite}}\) is the graphite volume fraction and \(f_\alpha\) is the area fraction of ferrite in the etched matrix. The mean intercept length of ferrite was then calculated using the formula:
$$\bar{l}_\alpha = \frac{V_{V\alpha} L}{M N_\alpha}$$
where \(L\) is the total length of the test grid (500 mm), \(M\) is the magnification, and \(N_\alpha\) is the number of intersections between the grid and ferrite grain boundaries. The ASTM grain size number \(G\) was obtained from:
$$G = -6.643856 \lg \bar{l}_\alpha – 3.288$$
Table 4 lists the measured ferrite grain sizes and grain size numbers for different vibration frequencies. The ferrite grain size decreased gradually with increasing vibration frequency. At 50 Hz, the average ferrite grain size was about 28.62 μm, which was considerably smaller than the 33.76 μm observed without vibration.
| Frequency (Hz) | Average ferrite grain size (μm) | ASTM grain size number G |
|---|---|---|
| 0 | 33.76 | 6.87 |
| 30 | 31.85 | 7.14 |
| 40 | 29.93 | 7.37 |
| 50 | 28.62 | 7.41 |
I also used Nano Measurer software to measure the ferrite grain size distribution. The grain size distribution histograms showed that the fraction of small grains in the range 10–30 μm increased remarkably after vibration. The vibration-induced breaking of dendrites and the increased number of heterogeneous nuclei contributed to the refinement of ferrite grains in lost foam castings.
Pearlite Morphology and Lamellar Spacing
The pearlite morphology also changed with vibration frequency. Without vibration, the pearlite was mainly lamellar. When the vibration frequency was increased to 30 Hz and 40 Hz, the lamellar pearlite gradually transformed into short-rod and granular pearlite. The pearlite lamellar spacing was measured with Nano Measure software and the results are plotted in Figure 6. The lamellar spacing decreased from 0.34 μm at 0 Hz to 0.22 μm at 40 Hz, and then increased slightly to 0.29 μm at 50 Hz. The refinement of pearlite lamellae is mainly attributed to the enhanced cooling and the fragmentation of cementite during vibration-assisted solidification.
Influence of Vibration Frequency on Tensile Properties
I performed tensile tests at room temperature for each condition. The tensile stress-strain curves are shown in Figure 7. The ultimate tensile strength and elongation both increased with increasing vibration frequency up to 40 Hz, and then decreased slightly at 50 Hz. Without vibration, the tensile strength was 419.5 MPa and the elongation was 18.3%. At 30 Hz, the strength increased to 446.5 MPa and the elongation to 21.1%. At 40 Hz, the maximum values of 457.1 MPa and 22.2% were obtained. At 50 Hz, the tensile strength remained relatively high at 452.3 MPa, but the elongation decreased to 20.6%.
| Frequency (Hz) | Tensile strength (MPa) | Elongation (%) |
|---|---|---|
| 0 | 419.5 | 18.3 |
| 30 | 446.5 | 21.1 |
| 40 | 457.1 | 22.2 |
| 50 | 452.3 | 20.6 |
I also examined the tensile fracture surfaces using scanning electron microscopy and three-dimensional reconstruction. The fracture surfaces of vibrated samples showed more and deeper dimples surrounding the graphite nodules, indicating a more ductile fracture mode. The ruptured graphite nodules were smaller and more spherical in the vibrated lost foam castings. In the non-vibrated sample, the fracture surface exhibited larger graphite cavities and some cleavage planes. The three-dimensional roughness parameter \(S_a\) was calculated as:
$$S_a = \frac{1}{A} \iint_A |z(x,y)| \, dx\,dy$$
where \(A\) is the measured surface area and \(z(x,y)\) is the height function. The roughness values increased with vibration frequency up to 40 Hz and then decreased at 50 Hz, which matched well with the elongation trend.
Influence of Vibration Amplitude on Microstructure and Tensile Properties
I fixed the vibration frequency at 40 Hz and varied the amplitude from 0 mm to 1 mm, 1.5 mm, and 2 mm. The effects of amplitude on graphite characteristics are summarized in Table 6. With increasing amplitude, the graphite content increased, the spheroidization rate improved, and the average graphite diameter decreased. At an amplitude of 2 mm, the spheroidization rate reached 86.2% and the average graphite diameter was 26.87 μm.
| Amplitude (mm) | Spheroidization rate (%) | Spheroidization grade | Average graphite diameter (μm) | Graphite content (%) |
|---|---|---|---|---|
| 0 | 78.8 | 4 | 33.86 | 13.58 |
| 1 | 81.3 | 3 | 30.79 | 14.66 |
| 1.5 | 85.9 | 3 | 27.09 | 16.26 |
| 2 | 86.2 | 3 | 26.87 | 16.32 |
The ferrite grain size decreased with increasing amplitude. The average ferrite grain sizes were 33.76 μm, 32.24 μm, 29.93 μm, and 29.14 μm for amplitudes of 0 mm, 1 mm, 1.5 mm, and 2 mm, respectively. The corresponding ASTM grain size numbers were 6.87, 7.09, 7.37, and 7.47. This confirms that an increase in amplitude promotes grain refinement. The pearlite lamellar spacing also decreased with increasing amplitude, and the fraction of granular pearlite increased.
| Amplitude (mm) | Tensile strength (MPa) | Elongation (%) |
|---|---|---|
| 0 | 419.5 | 18.3 |
| 1 | 440.3 | 20.8 |
| 1.5 | 457.1 | 22.2 |
| 2 | 462.8 | 22.8 |
The greatest tensile properties were achieved at 40 Hz and 2 mm, with a tensile strength of 462.8 MPa and an elongation of 22.8%. Compared with the non-vibrated condition, the tensile strength was improved by 43.3 MPa and the elongation by 4.5 percentage points. This confirms that mechanical vibration is an effective method to enhance the mechanical performance of lost foam castings.
Low-Temperature Impact Behavior
To evaluate the effect of mechanical vibration on toughness, I selected the samples prepared at 40 Hz and 2 mm and compared them with the non-vibrated samples. Impact tests were performed at temperatures of 20°C, 0°C, -20°C, -40°C, -50°C, and -60°C. The measured impact energies are listed in Table 8.
| Temperature (°C) | Non-vibrated impact energy (J) | Vibrated impact energy (J) |
|---|---|---|
| 20 | 18.23 | 19.86 |
| 0 | 16.17 | 17.18 |
| -20 | 14.16 | 15.46 |
| -40 | 12.19 | 13.17 |
| -50 | 8.14 | 11.74 |
| -60 | 4.48 | 7.67 |
At 20°C, the impact energy of the vibrated sample was 19.86 J, while the non-vibrated sample absorbed 18.23 J. The improvement of 1.13 J can be attributed to the refined ferrite grains and the higher nodularity of graphite. More importantly, the ductile-to-brittle transition temperature was shifted from approximately -40°C in the non-vibrated sample to about -50°C in the vibrated sample. This means that mechanical vibration can effectively improve the low-temperature toughness of lost foam castings.
I observed the impact fracture surfaces at different temperatures. At 20°C, the fracture surface was dominated by fine dimples around graphite nodules. As the temperature decreased, cleavage facets gradually appeared. At -40°C, the non-vibrated sample showed large cleavage facets, while the vibrated sample still displayed a mixture of dimples and small cleavage planes. At -60°C, both samples were fully brittle, but the vibrated sample still exhibited a more tortuous crack path. The three-dimensional reconstruction of the fracture surfaces confirmed that the vibrated samples had a higher surface roughness at all test temperatures, indicating more plastic deformation.
Friction and Wear Behavior
I also compared the wear resistance of the vibrated and non-vibrated lost foam castings. The hardness before and after wear is listed in Table 9. The non-vibrated sample had a hardness of 149.1 HB, while the vibrated sample had a slightly lower hardness of 144.4 HB due to its lower pearlite content. After the wear test, the hardness of both samples increased, but the vibrated sample showed a larger increase to 158.5 HB, indicating more pronounced work hardening.
| Condition | Hardness before wear (HB) | Hardness after wear (HB) |
|---|---|---|
| Non-vibrated | 149.1 | 155.4 |
| Vibrated | 144.4 | 158.5 |
Table 10 shows the weight loss results. The non-vibrated sample lost 0.04369 g, while the vibrated sample lost only 0.04191 g. Thus, mechanical vibration reduced the wear loss by about 4%. The friction coefficients measured during the stable wear stage were 0.912 for the non-vibrated sample and 0.803 for the vibrated sample. A lower friction coefficient indicates a more stable and effective lubricating film, which is related to the higher graphite content and better nodularity of the vibrated lost foam castings.
| Condition | Weight loss (g) | Friction coefficient |
|---|---|---|
| Non-vibrated | 0.04369 | 0.912 |
| Vibrated | 0.04191 | 0.803 |
The worn surface of the vibrated sample was smoother and exhibited shallower grooves than the non-vibrated sample. Three-dimensional reconstruction of the worn surfaces confirmed that the maximum wear depth of the vibrated sample was smaller. The improvement in wear resistance is mainly attributed to the fine and spherical graphite nodules, which act as solid lubricants and reduce the stress concentration at the surface during the repeated sliding process.
Mechanism of Mechanical Vibration on Microstructure Evolution
The experimental results clearly show that mechanical vibration has a significant influence on the solidification behavior of lost foam castings. During the early stage of solidification, the applied vibration creates periodic compression and tensile stresses in the liquid metal. These stresses cause the primary dendrites to break into fragments, and these fragments become new nuclei. The vibration also promotes convection in the liquid, which assists in the transport of dendritic fragments and the uniform distribution of temperature and solute. As a result, the number of effective nuclei in the melt increases, leading to a finer and more homogeneous microstructure.
From the thermodynamic point of view, mechanical vibration increases the effective undercooling of the melt. The critical nucleation radius can be expressed by the classic nucleation theory:
$$r_c = \frac{2 \gamma_{sl} T_m}{\Delta H_v \Delta T}$$
where \(\gamma_{sl}\) is the solid-liquid interfacial energy, \(T_m\) is the melting temperature, \(\Delta H_v\) is the volumetric latent heat, and \(\Delta T\) is the undercooling. The applied vibration enhances local undercooling and reduces the critical nucleus size, thereby promoting nucleation inside the liquid metal. This is particularly beneficial for graphite nucleation in ductile iron. Graphite nodules nucleate on foreign particles, and the vibration activates more of these substrates. Furthermore, the fragmentation of dendrites creates additional carbon-rich interfaces, which contribute to the formation of graphite spheroids.
The refinement of ferrite grains can be explained by the increased number of austenite nuclei and the reduction of the diffusion distance of carbon. The vibration accelerates the formation of austenite shells around graphite nodules, which stabilizes the graphite and prevents it from growing excessively. The faster cooling induced by vibration also limits the coarsening of ferrite grains. In addition, the transformation from lamellar pearlite to granular pearlite is promoted by mechanical vibration because the vibration enhances carbon diffusion and breaks the continuous cementite lamellae.
The improved tensile properties are the combined result of several factors. First, the higher nodularity and smaller graphite size reduce the stress concentration and improve the load-bearing capability of the matrix. Second, the refined ferrite grains increase the grain boundary area, which impedes dislocation motion and strengthens the material. Third, the finer pearlite lamellae and the presence of granular pearlite improve the work-hardening ability. The simultaneous improvement in strength and elongation suggests that mechanical vibration can effectively synchronize the enhancement of both parameters, which is often difficult to achieve through conventional alloying.
The low-temperature impact toughness is mainly controlled by the cleavage fracture stress and the propagation of cracks. Since the vibrated sample has finer grains and more spherical graphite, the critical cleavage stress is higher. The crack path is more tortuous because the many small graphite nodules act as crack arrestors. The reduction of the ductile-to-brittle transition temperature from -40°C to -50°C is particularly important for engineering applications in cold regions, such as wind turbine components and railway parts.
The wear resistance of ductile iron is closely related to the graphite morphology and matrix hardness. Graphite itself has a lamellar hexagonal structure and can be easily sheared, making it an effective solid lubricant. In lost foam castings with mechanical vibration, the higher graphite fraction ensures a continuous lubricating layer on the wear surface. In addition, the spherical shape of graphite promotes a uniform stress distribution and prevents the formation of micro-cracks that usually initiate at the tips of irregular graphite particles. The work-hardened layer formed during wear is also more stable in the vibrated sample due to the absence of severe stress concentrators.
It should be noted that the vibration parameters must be carefully optimized. Too high a frequency or too large an amplitude may cause turbulence, slag entrapment, or even the rupture of the graphite spheroids. Based on my experimental results, the optimal vibration parameters for QT400-18 ductile iron by lost foam castings are 40 Hz and 2 mm. Under these conditions, the best combination of strength, ductility, low-temperature toughness, and wear resistance is achieved.
Conclusions
Through the systematic study of mechanical vibration applied during the solidification of QT400-18 ductile iron produced by lost foam castings, I draw the following conclusions:
1. Mechanical vibration refines the graphite microstructure of lost foam castings. With increasing vibration frequency from 0 Hz to 40 Hz at a constant amplitude of 1.5 mm, the graphite nodule count increases, the spheroidization rate rises, and the average graphite size decreases. At 50 Hz, however, the spheroidization rate decreases due to the disturbance of the spherical growth environment. At constant frequency of 40 Hz, increasing the amplitude from 0 mm to 2 mm progressively improves the graphite morphology.
2. Mechanical vibration effectively refines the ferrite grains and reduces the pearlite lamellar spacing. The optimum conditions of 40 Hz and 2 mm produce the finest ferrite grains with an ASTM grain size number of 7.47 and an average grain size of 29.14 μm.
3. The tensile properties are significantly improved by mechanical vibration. The highest tensile strength of 462.8 MPa and elongation of 22.8% are obtained at 40 Hz and 2 mm, representing improvements of 43.3 MPa and 4.5 percentage points compared with the non-vibrated condition. These improvements are attributed to the combined effects of refined graphite, refined ferrite, and favorable pearlite morphology.
4. Mechanical vibration improves the low-temperature impact toughness. At 20°C, the impact energy increases from 18.23 J to 19.86 J with vibration. The ductile-to-brittle transition temperature is lowered from about -40°C to -50°C, indicating better low-temperature serviceability of lost foam castings.
5. The wear resistance is also enhanced by mechanical vibration. The vibrated sample loses less weight during the wear test and exhibits a lower friction coefficient than the non-vibrated sample. This is mainly due to the higher graphite content, better nodularity, and more stable work-hardened layer.
Overall, mechanical vibration is a simple, economic, and environmentally friendly technique for enhancing the microstructures and mechanical properties of QT400-18 ductile iron produced by lost foam castings. The optimized vibration parameters of 40 Hz and 2 mm are recommended for practical production.