
In my research, I focus on the sand casting foundry industry, which is characterized by high energy consumption, low resource efficiency, and significant environmental impact. The sand casting foundry sector faces increasing pressure to reduce carbon emissions while maintaining economic viability. My work aims to establish a carbon benefit model for process design features in sand casting foundry operations, enabling the optimization of related process parameters at the design stage. This approach helps improve the overall sustainability of traditional manufacturing by linking product features to downstream environmental and economic performance.
To begin with, I analyze the complete sand casting foundry process, from raw material preparation through melting, molding, pouring, cooling, and finishing. The sand casting foundry process involves multiple interconnected stages, each consuming energy and materials while generating emissions. I identify that the design features of castings directly influence the selection of process routes, the amount of metal poured, the type and quantity of sand cores, the gating system dimensions, and the pouring parameters. Therefore, understanding the relationship between design features and process outcomes is essential for carbon benefit improvement.
I classify sand casting foundry process design features into three main categories: casting material features, casting geometric structure features, and pouring features. Casting material features include the type of molding sand, alloy composition, binder systems, and auxiliary materials. Casting geometric structure features cover wall thickness, holes, fillets, grooves, ribs, and core geometry. Pouring features encompass gating system types, runner dimensions, riser types, and pouring temperature. Each category associates with specific process parameters that can be adjusted to minimize carbon emissions, production time, and resource costs while maintaining casting quality.
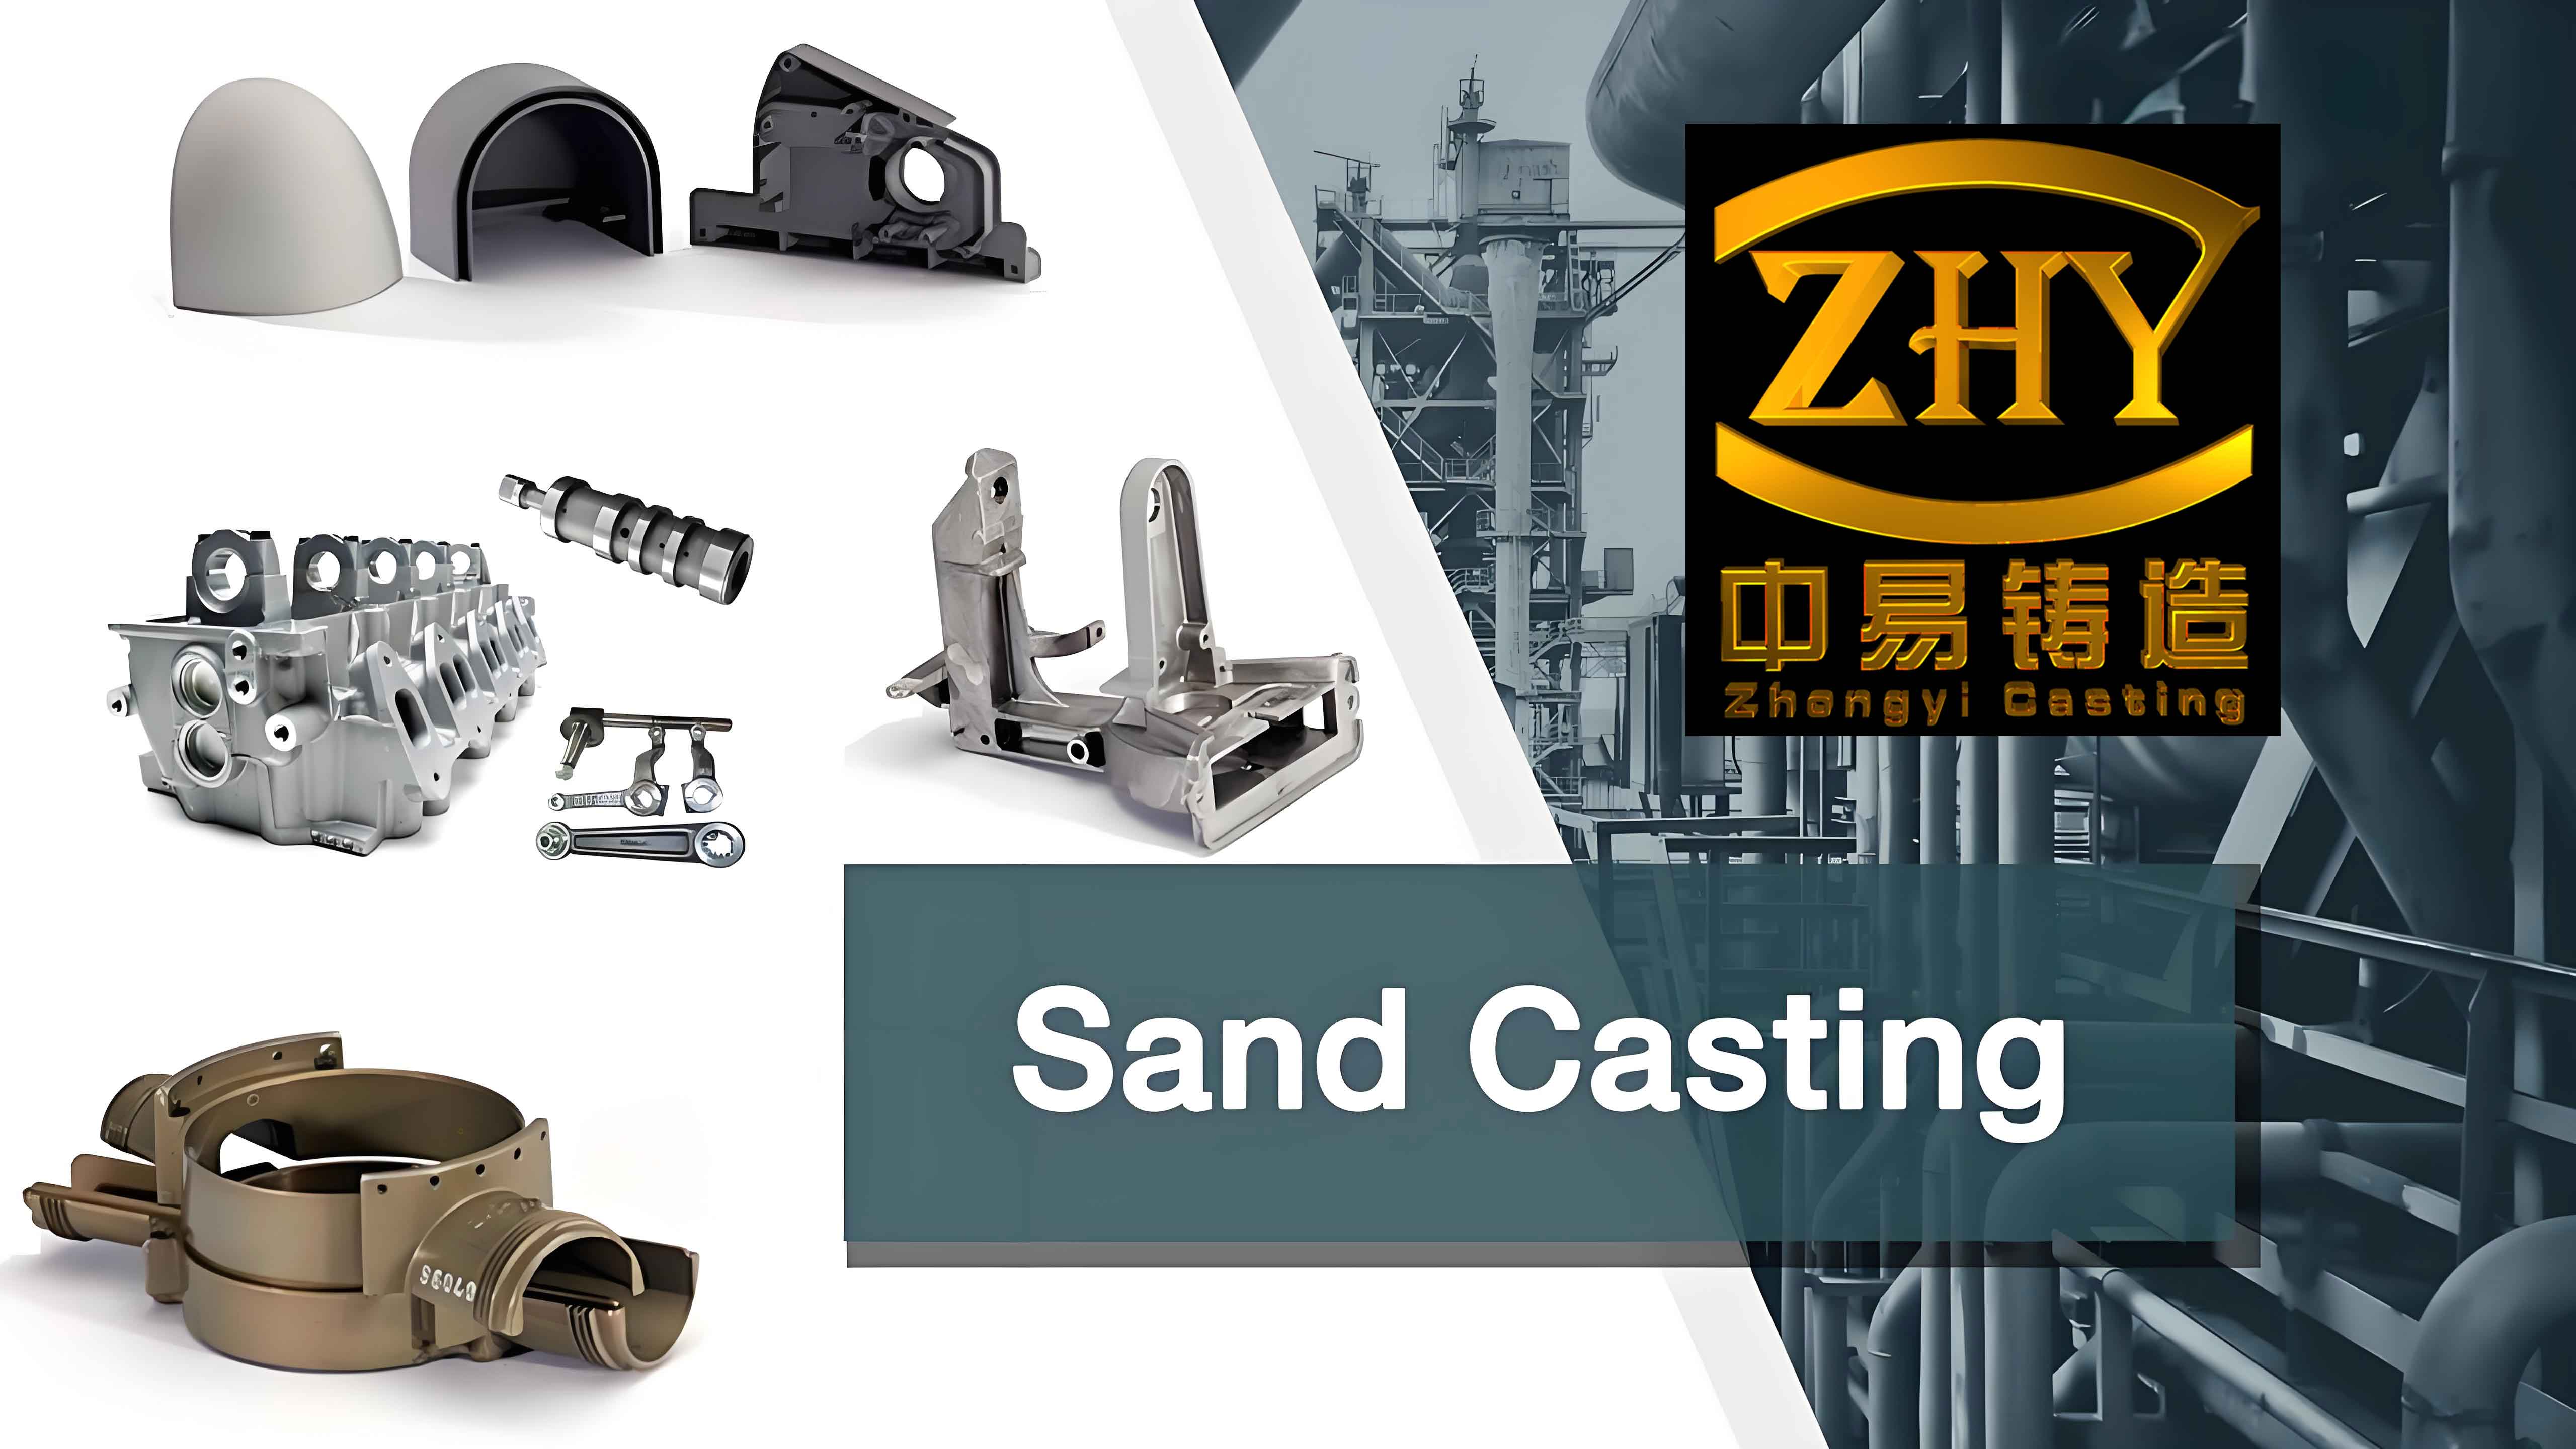
For a sand casting foundry, the interaction between design features and process parameters is complex. For instance, the selection of molding sand affects the thermal conductivity of the mold, which in turn influences the solidification rate and the required pouring temperature. The presence of holes in a casting may require sand cores, which increases the complexity of molding and core-making but reduces the amount of metal needed compared to machining the hole afterward. The gating system design determines the filling velocity and the feeding behavior, affecting the formation of shrinkage defects. These relationships motivate the need for a quantitative carbon benefit model that integrates multiple performance indicators.
Carbon Benefit Model of Sand Casting Foundry Process Design Features
I define the carbon benefit of a sand casting foundry process design feature as a comprehensive evaluation metric that combines carbon emissions, production time, and resource costs. The model enables designers to compare alternative process plans and select the one with the highest benefit, i.e., the lowest weighted sum of these three indicators. The general form of the carbon benefit model is expressed as:
$$ TC = \alpha \cdot CE_{Total} + \beta \cdot PT_{Total} + \mu \cdot RC_{Total} $$
where \( TC \) is the total carbon benefit value, \( CE_{Total} \) is the total carbon emission, \( PT_{Total} \) is the total production time, \( RC_{Total} \) is the total resource cost, and \( \alpha \), \( \beta \), \( \mu \) are weighting factors that reflect the production priorities of the sand casting foundry. A lower \( TC \) indicates a better process plan, as it signifies lower emissions, shorter time, and reduced costs under the given weights.
Carbon Emission Model
In the sand casting foundry context, I decompose total carbon emissions into three categories: energy carbon emissions (\( C_N \)), material carbon emissions (\( C_M \)), and process carbon emissions (\( C_P \)). The calculation is based on the IPCC emission factor method, where the emission amount is obtained by multiplying the consumption of each energy or material by its corresponding carbon emission factor.
$$ CE_{Total} = C_N + C_M + C_P $$
According to the classification of process design features in sand casting foundry, each carbon emission category can be further expressed as a sum of contributions associated with casting material features (CF), geometric structure features (HF), and pouring features (ZF). For energy carbon emissions, I write:
$$ C_N = \sum_{i=1}^{u} m(a_{CF_i}) \cdot EF_i + \sum_{j=1}^{v} m(a_{HF_j}) \cdot EF_j + \sum_{k=1}^{w} m(a_{ZF_k}) \cdot EF_k $$
Here, \( m(a_{CF_i}) \) is the energy consumption associated with the \( i \)-th casting material feature, \( EF_i \) is the corresponding emission factor, and similarly for geometric structure and pouring features. To unify different energy types, I convert all energy consumptions into kilograms of standard coal equivalent (kgce) using the conversion coefficient \( e \) for each energy source:
$$ m(A) = a_A \cdot e_A $$
Material carbon emissions include the emissions from the production, transportation, and processing of materials such as pig iron, steel scrap, sand, coatings, and alloying elements. I calculate them as:
$$ C_M = \sum_{r=1}^{o} m(b_{CF_r}) \cdot f_r + \sum_{s=1}^{p} m(b_{HF_s}) \cdot f_s + \sum_{t=1}^{q} m(b_{ZF_t}) \cdot f_t $$
where \( m(b_{CF_r}) \) is the consumption of the \( r \)-th material related to casting material features, and \( f_r \) is its carbon emission factor. Process carbon emissions are generated by chemical reactions during melting and decomposition of organic binders. The direct emissions are expressed as:
$$ C_P = \sum_{d=1}^{x} V(c_{CF_d}) \cdot a_d + \sum_{e=1}^{y} V(c_{HF_e}) \cdot a_e + \sum_{f=1}^{z} V(c_{ZF_f}) \cdot a_f $$
where \( V(c_{CF_d}) \) is the volume of gas generated by the \( d \)-th chemical reaction associated with casting material features, and \( a_d \) is its corresponding emission coefficient.
Production Time Model
Production time in a sand casting foundry is measured from the start of sand preparation to the final inspection, considering both processing time on main equipment and auxiliary time for loading, unloading, and handling. I model the total production time as:
$$ PT_{Total} = \sum_{i’=1}^{m} \sum_{j’=1}^{n} \left[ \overline{t}_{CF_{i’j’}}(N) + \overline{t}_{HF_{i’j’}}(N) + \overline{t}_{ZF_{i’j’}}(N) \right] + \sum_{i’=1}^{m} \sum_{k’=1}^{n’} \left[ \overline{\tau}_{CF_{j’k’}}(N) + \overline{\tau}_{HF_{j’k’}}(N) + \overline{\tau}_{ZF_{j’k’}}(N) \right] $$
In this equation, \( \overline{t}_{CF_{i’j’}}(N) \) represents the average processing time of the main equipment for the \( j’ \)-th process associated with casting material features in the \( i’ \)-th department, and \( \overline{\tau}_{CF_{j’k’}}(N) \) represents the auxiliary time for the same feature type. The variable \( N \) denotes the production batch size, which affects both main and auxiliary times because setup operations and tool changes are distributed over the batch.
Resource Cost Model
The resource cost in a sand casting foundry consists of energy cost (\( RC_{energy} \)), material cost (\( RC_{material} \)), labor cost (\( RC_{labor} \)), and remaining costs (\( RC_{rest} \)) such as equipment depreciation and tooling expenses. I express the total resource cost as:
$$ RC_{Total} = RC_{energy} + RC_{material} + RC_{labor} + RC_{rest} $$
Each cost component can be split according to the process design feature categories:
$$ RC_X = RC(d_{CF}) + RC(d_{HF}) + RC(d_{ZF}), \quad X \in \{energy, material, labor, rest\} $$
where \( RC(d_{CF}) \) denotes the cost contribution from casting material features, and similarly for geometric structure and pouring features.
Parameter Optimization for Sand Casting Foundry Process Design
With the carbon benefit model established, I proceed to optimize the process parameters associated with the design features. The optimization aims to minimize the carbon benefit value \( TC \) while satisfying quality constraints, specifically the total shrinkage porosity and the void fraction obtained from casting simulation. The optimization problem is formulated as:
$$ \min TC = \alpha \cdot CE_{Total} + \beta \cdot PT_{Total} + \mu \cdot RC_{Total} $$
subject to:
$$ R_1 = \{ X | g_i(X) \ll K_1 \} $$
$$ R_2 = \{ X | m_i(X) \ll K_2 \} $$
$$ T_{min} \le T \le T_{max} $$
$$ cond_1, \cdots, cond_m | b_{min} \le V \le cond_1, \cdots, cond_m | b_{max} $$
Here, \( X \) represents the vector of process parameters to be optimized, \( K_1 \) is the permissible total shrinkage porosity, \( K_2 \) is the permissible void fraction, \( T \) is the pouring temperature, \( V \) is the pouring velocity, and \( cond_1, \cdots, cond_m \) are process conditions such as wall thickness and mold type. The casting quality is verified through numerical simulation using ProCAST, which provides the shrinkage porosity and void fraction for each candidate design.
In my optimization procedure, I first select the associated process parameters based on the design feature being studied. For casting geometric structure features, the parameters include machining allowance on holes, core diameter, core length, and the number of cores. For pouring features, the parameters include pouring temperature, pouring time, gating system cross-sectional area ratios, riser type, and riser dimensions. I set initial values using empirical charts from sand casting foundry handbooks, then design the original process plan and verify its quality through simulation. If the quality criteria are met, I calculate the carbon benefit for the plan. Next, I adjust the parameters within feasible ranges and repeat the simulation and calculation. The parameter set yielding the lowest carbon benefit is selected as the optimal process plan.
Case Study 1: Casting Geometric Structure Feature of a Disc
To demonstrate the application of the carbon benefit model, I analyze a sand casting foundry example of a disc-shaped casting made of HT250 gray cast iron. The net weight of the casting is 186.138 kg, and the total mass including gating system and machining allowances is 203.7 kg. The casting has three holes of 45 mm diameter, which can be produced either by machining (scheme FE1) or by using sand cores (schemes FE2 and FE3). I compare these three process plans over a production batch of 10 pieces.
Table 1 lists the process routes for the three schemes:
| Scheme | Process Route |
|---|---|
| FE1 | Sand mixing – core making – molding – coating – core setting – mold closing – pouring – cooling – shakeout – heat treatment – grinding – inspection |
| FE2 | Sand mixing – molding – coating – mold closing – pouring – cooling – shakeout – heat treatment – drilling – grinding – inspection |
| FE3 | Same as FE2 but with optimized hole machining allowance and core geometry |
The relevant process parameters for FE1, FE2, and FE3 are given in Table 2:
| Parameter | FE1 | FE2 | FE3 |
|---|---|---|---|
| Draft angle (°) | 1.6 | 1.6 | 1.6 |
| Pouring temperature (°C) | 1420 | 1420 | 1420 |
| Mold gas evolution (ml/g) | 15.5 | 15.5 | 15.5 |
| Pouring time (s) | 6 | 6 | 6 |
| Cooling time (h) | 24 | 24 | 24 |
| Surface machining allowance (mm) | 2.5 | 2.5 | 2.5 |
| Hole machining allowance (mm) | 0 | 1.5 | 2.5 |
| Core diameter (mm) | 0 | 42 | 40 |
The simulation results confirm that all three schemes satisfy the quality constraints: no internal shrinkage porosity is observed, and surface voids can be removed by machining. After verifying quality, I calculate the carbon emissions, production time, and resource costs for each scheme.
Table 3 shows the detailed carbon emissions for the three schemes:
| Emission category | FE1 (kg CO2) | FE2 (kg CO2) | FE3 (kg CO2) |
|---|---|---|---|
| Pig iron | 646.405 | 634.038 | 633.941 |
| Steel scrap | 4244.098 | 4162.904 | 4162.160 |
| Silica sand | 154.063 | 156.142 | 155.839 |
| Steel shot | 15.798 | 15.948 | 15.918 |
| Water | 0.349 | 0.349 | 0.349 |
| Auxiliary materials | 81.396 | 89.942 | 81.239 |
| Coating | 90.902 | 91.752 | 91.603 |
| Alcohol | 3.390 | 3.390 | 3.390 |
| Natural gas | 34.880 | 34.880 | 34.880 |
| Coke | 195.250 | 191.515 | 194.442 |
| Main equipment electricity | 397.351 | 377.391 | 387.670 |
| Melting energy | 1043.876 | 1023.905 | 1025.941 |
| Core making and drying energy | 0 | 39.982 | 27.188 |
| Machining energy | 20.900 | 2.300 | 4.800 |
| Carbonaceous direct emissions | 24.699 | 25.150 | 25.024 |
The comparison shows that FE1 has the highest total carbon emissions because machining the holes requires extra metal to be melted to produce the larger casting. FE2 and FE3 use sand cores to form the holes, reducing the amount of metal poured. FE3, which optimized the hole machining allowance and core diameter, achieves the lowest total emissions, being 1.470% lower than FE1 and 1.229% lower than FE2.
Table 4 presents the production time breakdown for the three schemes:
| Department | FE1 (h) | FE2 (h) | FE3 (h) |
|---|---|---|---|
| Sand treatment | 0.589 | 0.719 | 0.686 |
| Molding | 1.159 | 1.289 | 1.256 |
| Melting | 1.757 | 1.724 | 1.726 |
| Pouring and cooling | 24.662 | 24.662 | 24.662 |
| Cleaning | 1.942 | 1.275 | 1.263 |
| Heat treatment | 1.500 | 1.500 | 1.500 |
| Total | 31.609 | 31.169 | 31.093 |
FE1 requires additional machining time in the cleaning department, making its total production time the longest. FE3 achieves the shortest production time due to optimized core geometry and reduced auxiliary operations. The time savings are modest but meaningful for repetitive production.
Resource costs were calculated based on market prices and locally prevailing rates. Table 5 summarizes the cost components:
| Cost category | FE1 (CNY) | FE2 (CNY) | FE3 (CNY) |
|---|---|---|---|
| Material cost | 9156.42 | 7843.51 | 7821.37 |
| Energy cost | 1240.86 | 1127.91 | 1130.54 |
| Labor cost | 1450.00 | 850.00 | 880.00 |
| Remaining cost | 1800.00 | 900.00 | 900.00 |
| Total | 13647.28 | 10721.42 | 10731.91 |
FE2 and FE3 have significantly lower material costs because they require less metal to be melted. FE3 is slightly more expensive than FE2 in material and labor due to a different core design, but its total cost is still much lower than FE1. The difference between FE2 and FE3 is small, within 0.5%, but FE3 shows a better overall performance when carbon emissions and production time are also considered.
Using the weighting factors \( \alpha = 0.45 \), \( \beta = 0.78 \), and \( \mu = 0.62 \) reflecting the factory’s focus on time and cost, I compute the carbon benefit values:
| Scheme | CE_Total (kg CO2) | PT_Total (h) | RC_Total (CNY) | TC |
|---|---|---|---|---|
| FE1 | 6953.2 | 31.609 | 13647.28 | 12012.703 |
| FE2 | 6755.9 | 31.169 | 10721.42 | 10548.009 |
| FE3 | 6748.8 | 31.093 | 10731.91 | 10503.226 |
The results confirm that FE3 has the lowest carbon benefit value, indicating the best comprehensive benefit. This demonstrates that optimizing the casting geometric structure feature parameters, specifically the hole machining allowance and core diameter, can improve the sustainability of a sand casting foundry process without compromising quality.
Case Study 2: Pouring Feature of a Base Casting
In the second case, I examine a base casting used for road traffic installations. The casting weighs 69.882 kg and is made of HT250 gray cast iron. Its maximum dimensions are 400 mm × 300 mm × 182 mm. The initial process plan (FE1) uses a semi-closed gating system with a cross-sectional area ratio of 1.256:1.4:1 for the runner, sprue, and ingate, and no riser. Simulation reveals shrinkage defects inside the casting. To eliminate these defects, I add a necked riser (FE2) and then optimize the pouring features to obtain FE3. The relevant parameters are listed in Table 6.
| Parameter | FE1 | FE2 | FE3 |
|---|---|---|---|
| Pouring temperature (°C) | 1420 | 1420 | 1400 |
| Pouring time (s) | 8 | 8 | 6 |
| Cross-sectional area ratio | 1.256:1.4:1 | 1.256:1.4:1 | 1.256:1.3:1 |
| Gating system mass (kg) | 5.727 | 5.727 | 5.271 |
| Riser type | None | Necked riser | Shrinkage riser |
| Riser quantity | 0 | 1 | 1 |
| Riser mass (kg) | 0 | 0.193 | 1.521 |
| Total pouring system mass (kg) | 5.727 | 5.920 | 6.792 |
After simulation, FE2 and FE3 satisfy the quality requirements while FE1 exhibits shrinkage defects. The total shrinkage porosity and void fraction for FE3 are within acceptable limits. I then calculate the carbon emissions, production time, and resource costs for all three schemes.
Table 7 lists the material consumption for each scheme:
| Material | FE1 (kg) | FE2 (kg) | FE3 (kg) |
|---|---|---|---|
| Pig iron | 11.0389 | 11.1150 | 11.0005 |
| Steel scrap | 37.6533 | 37.9127 | 37.5223 |
| Resin sand | 34.6344 | 33.6351 | 33.6620 |
| Coating | 0.9925 | 0.9520 | 0.9785 |
| Water | 0.3506 | 0.3531 | 0.3495 |
| Steel shot | 0.1020 | 0.1020 | 0.1020 |
The carbon emissions are computed using the emission factors provided in Table 8:
| Emission source | Carbon emission factor |
|---|---|
| Coke | 2.8601 kg CO2/kgce |
| Alcohol | 0.4800 kg CO2/kgce |
| Standard coal | 2.4910 kg CO2/kgce |
| Pig iron | 2.1300 kg CO2/kg |
| Steel scrap | 8.2000 kg CO2/kg |
| Silica sand | 0.2543 kg CO2/kg |
| Coating | 6.0232 kg CO2/kg |
| Water | 1.2040 kg CO2/t |
Table 9 summarizes the carbon emission results:
| Emission category | FE1 (kg CO2) | FE2 (kg CO2) | FE3 (kg CO2) |
|---|---|---|---|
| Pig iron | 23.5129 | 23.6749 | 23.4311 |
| Steel scrap | 308.7569 | 310.8845 | 307.6829 |
| Silica sand | 8.8075 | 8.5534 | 8.5602 |
| Steel shot | 0.8364 | 0.8364 | 0.8364 |
| Water | 0.0004 | 0.0004 | 0.0004 |
| Auxiliary materials | 3.2561 | 3.2528 | 3.2552 |
| Coating | 5.9780 | 5.7341 | 5.8937 |
| Alcohol | 1.3265 | 1.3379 | 1.3227 |
| Coke | 3.5168 | 3.5410 | 3.5045 |
| Electricity | 40.0828 | 45.3363 | 39.8064 |
| Direct carbonaceous | 1.2330 | 1.1280 | 1.2160 |
FE2, which uses a riser to eliminate defects, has higher total emissions than FE1 because the riser adds extra metal. However, FE3, optimized by adjusting the pouring temperature, cross-sectional area ratio, and riser type, achieves lower emissions than FE1 and significantly lower than FE2. This indicates that proper optimization of pouring features can resolve casting defects without compromising environmental performance.
For production time, the total time is dominated by the 24-hour cooling period. The differences among the schemes are small because all require the same cooling time. The optimized FE3 has a slightly shorter pouring time (6 s vs. 8 s), but the effect on total time is negligible. Table 10 shows the production time values:
| Scheme | Total production time (h) |
|---|---|
| FE1 | 26.147 |
| FE2 | 26.289 |
| FE3 | 26.051 |
Resource costs are calculated using the same cost factors as in the first case. Table 11 presents the results:
| Cost category | FE1 (CNY) | FE2 (CNY) | FE3 (CNY) |
|---|---|---|---|
| Material cost | 738.14 | 762.53 | 732.90 |
| Energy cost | 78.23 | 81.66 | 76.14 |
| Labor cost | 280.00 | 310.00 | 270.00 |
| Remaining cost | 350.00 | 360.00 | 340.00 |
| Total | 1446.37 | 1514.19 | 1419.04 |
FE3 has the lowest resource cost among the three schemes, confirming that the optimized pouring design not only reduces emissions but also improves economic efficiency.
Using the same weighting factors \( \alpha = 0.45 \), \( \beta = 0.78 \), \( \mu = 0.62 \), the carbon benefit values are:
| Scheme | CE_Total (kg CO2) | PT_Total (h) | RC_Total (CNY) | TC |
|---|---|---|---|---|
| FE1 | 397.26 | 26.147 | 1446.37 | 314.498 |
| FE2 | 401.25 | 26.289 | 1514.19 | 317.500 |
| FE3 | 395.51 | 26.051 | 1419.04 | 313.211 |
The optimized FE3 achieves the lowest carbon benefit value, demonstrating that the proposed optimization method successfully improves the sand casting foundry process by focusing on pouring feature parameters. This case highlights the importance of considering both quality and sustainability simultaneously when designing gating and risering systems.
Conclusion
In this work, I established a carbon benefit model specifically for sand casting foundry process design features. The model integrates carbon emissions, production time, and resource costs into a single weighted measure, allowing comprehensive evaluation of alternative process plans. I classified the design features into material, geometric structure, and pouring features, and mapped them to their associated process parameters. Through two case studies on a disc casting and a base casting, I verified that optimizing the parameters related to geometric structure features (such as hole machining allowance and core diameter) and pouring features (such as pouring temperature, cross-sectional area ratios, and riser design) can significantly improve the carbon benefit of sand casting foundry production while ensuring casting quality.
The main conclusions from my research are as follows:
- The selection of hole-making method in sand casting foundry strongly affects carbon emissions and costs. Using sand cores instead of machining reduces the amount of metal melted, leading to lower emissions and lower material costs.
- Optimizing the casting geometric structure features, such as machining allowance and core diameter, can further reduce the carbon benefit value even when the core-making route is already chosen.
- For pouring features, adding a riser can eliminate shrinkage defects but may increase emissions and costs. Through parameter optimization, it is possible to design a riser that meets quality requirements with minimal negative impact.
- The proposed carbon benefit model provides a flexible decision-making tool for sand casting foundry engineers, as the weighting factors can be adjusted according to the strategic priorities of the enterprise, whether it be emission reduction, time saving, or cost control.
Future research should extend the carbon benefit model to incorporate other manufacturing processes, including additive and subtractive manufacturing, and to handle multi-objective optimization of the entire process chain in sand casting foundry production. The integration of new technologies with traditional casting will open further opportunities for improving resource efficiency and reducing environmental impact.
In summary, my study contributes a practical methodology for evaluating and optimizing the carbon benefit of sand casting foundry process design features. By applying this approach at the design stage, enterprises can proactively reduce their environmental footprint, streamline production, and achieve sustainable development goals in the traditional manufacturing sector.