
In recent years, the rapid development of metallurgy, aviation, shipbuilding, architecture, and many other industries has imposed increasingly demanding requirements on components subjected to complex loading and harsh service conditions. Castings are widely used in key structural parts such as engine cylinder blocks, crankshafts, propeller hubs, and missile casings. However, casting processes inevitably introduce various defects such as shrinkage cavities, porosities, inclusions, hot tears, and cold shuts. These internal discontinuities can severely degrade the mechanical performance and reliability of the final products. To guarantee product quality, reduce production costs, and ensure engineering safety, online nondestructive inspection of sand foundry defects in castings has become an extremely important practical task. Among the many available techniques, audio frequency inspection based on resonant acoustic principles offers a unique combination of simplicity, speed, and low cost, making it an ideal candidate for inline quality control of sand foundry defects.
This paper presents a comprehensive study on the method and equipment for detecting casting defects, especially sand foundry defects, through audio frequency inspection. The research covers the fundamental theory, the construction of a complete inspection system, the acquisition and processing of acoustic signals, and experimental validation using both artificial notches and real casting defects. The proposed system uses a small hardened steel sphere with fixed gravitational potential energy as the pulse exciter, an electret condenser microphone as the acoustic sensor, and a standard computer sound card as the data acquisition hardware. The acquired signals are processed using MATLAB’s Data Acquisition Toolbox and Signal Processing Toolbox to extract resonant frequency and internal friction values, which serve as the primary feature parameters for identifying sand foundry defects.
1. Introduction
Nondestructive testing (NDT) is an interdisciplinary field that aims to detect internal or surface defects in materials without causing any damage to the inspected object. Conventional NDT methods have been widely used in the foundry industry for detecting sand foundry defects. Table 1 summarizes the most common conventional NDT techniques and their characteristics.
| Method | Physical Principle | Advantages | Limitations |
|---|---|---|---|
| Liquid penetrant testing (PT) | Capillary action of penetrant into surface openings | Simple, cheap, sensitive to surface cracks | Only surface-breaking defects; requires cleaning |
| Magnetic particle testing (MT) | Magnetic flux leakage at surface/near-surface defects | Fast, direct indication, low cost | Only ferromagnetic materials; surface preparation needed |
| Eddy current testing (ET) | Electromagnetic induction | High speed, suitable for tubes and bars | Only conductive materials; limited penetration depth |
| Radiographic testing (RT) | Differential absorption of X-rays or gamma rays | Volumetric, permanent record, good for porosity/inclusions | Expensive, radiation hazard, insensitive to tight cracks |
| Ultrasonic testing (UT) | Reflection/transmission of high-frequency sound waves | High sensitivity, deep penetration, portable | Requires couplant, skilled operator; complex geometry problematic |
| Acoustic emission testing (AE) | Detection of transient elastic waves from defect growth | Dynamic, real-time monitoring | Needs loading; cannot detect static defects |
| Infrared testing (IR) | Thermal contrast caused by defects | Non-contact, full-field imaging | Low resolution for deep defects; expensive cameras |
While these conventional methods are powerful for locating and sizing specific types of flaws, they often require skilled operators, elaborate equipment, and time-consuming scanning procedures. Moreover, many of them are limited to surface or near-surface defects, and some are not suitable for high-speed production lines. In contrast, audio frequency inspection (also known as resonant inspection or sonic testing) determines the structural integrity of the entire component by analyzing its natural vibration characteristics. When a casting is excited by a mechanical impulse, it vibrates at its natural resonant frequencies. The presence of sand foundry defects alters the local stiffness, mass distribution, and damping capacity, which in turn shifts the resonant frequencies and increases the internal friction (energy loss) of the vibrating system. Therefore, by measuring the resonant frequency and internal friction, one can reliably detect whether sand foundry defects exist in the casting.
The development of audio frequency inspection can be traced back to the 1960s. Fuller et al. first established the relationship between resonant frequency and casting quality. Since then, many researchers have applied this technique to evaluate the graphite shape in ductile iron, detect cracks in crankshafts, and assess the mechanical properties of various castings. In recent years, the combination of digital signal processing, computer-based data acquisition, and advanced pattern recognition has greatly enhanced the capability of audio frequency inspection. The technique now offers a fast, objective, and quantitative means of detecting sand foundry defects in a single measurement, covering both surface and internal flaws without any pre-treatment of the workpiece.
The purpose of this research is to design and construct a practical audio frequency inspection system for detecting casting defects. The main contributions include: (1) a detailed theoretical analysis of the relationship between casting defects and acoustic parameters; (2) the development of a cost-effective hardware setup using a steel ball exciter, electret microphone, and computer sound card; (3) the implementation of a complete signal conditioning and processing chain; and (4) experimental verification on artificial notch specimens and cast samples with various sand foundry defects.
2. Principles of Audio Frequency Inspection for Sand Foundry Defects
2.1 Resonant Frequency Measurement
When a mechanical structure is excited by an impulse, it freely vibrates at its natural frequencies. For a continuous system, the vibration can be represented as a superposition of normal modes. In the case of a uniform bar with free-free boundary conditions, the longitudinal vibration frequencies are given by:
$$
f_n = \frac{n}{2L}\sqrt{\frac{E}{\rho}} \quad (n = 1,2,3,\ldots)
$$
where \( f_n \) is the \( n \)-th resonant frequency, \( L \) is the length of the bar, \( E \) is the dynamic elastic modulus, and \( \rho \) is the material density. For a cylindrical rod, the fundamental resonant frequency can also be expressed as:
$$
f_0 = \frac{1}{2L}\sqrt{\frac{E}{\rho}}
$$
Any discontinuity in the casting, such as a crack, shrinkage, or inclusion, changes the local stiffness and density distribution. This causes the resonant frequencies to shift, typically decreasing as the overall stiffness decreases or as a crack interrupts the load path. Therefore, a comparison between the measured resonant frequency of a test sample and that of a known defect-free reference provides a direct indicator of sand foundry defects.
For a damped single-degree-of-freedom system, the equation of free vibration is:
$$
m\frac{d^2X(t)}{dt^2} + R\frac{dX(t)}{dt} + KX(t) = 0
$$
where \( m \) is the mass, \( R \) is the damping coefficient, and \( K \) is the stiffness. The damped natural frequency is:
$$
f_d = f_n\sqrt{1-\zeta^2}
$$
where \( \zeta \) is the damping ratio. Since defects increase the damping, they also slightly reduce the observed resonant frequency compared to the undamped natural frequency.
2.2 Internal Friction and Energy Attenuation
The presence of sand foundry defects not only modifies the resonant frequencies but also increases the rate at which vibration energy dissipates. This energy dissipation, known as internal friction, is caused by the internal damping of the material and the additional friction at defect interfaces. The logarithmic decrement \( \delta \) is commonly used to quantify internal friction:
$$
\delta = \frac{1}{n}\ln\left(\frac{A_k}{A_{k+n}}\right)
$$
where \( A_k \) and \( A_{k+n} \) are the amplitudes of the \( k \)-th and \( (k+n) \)-th oscillation cycles, respectively. The relationship between the logarithmic decrement and the loss factor \( Q^{-1} \) is:
$$
Q^{-1} = \frac{\delta}{\pi}
$$
where \( Q \) is the quality factor of the resonance. As the amplitude of vibration decays exponentially:
$$
A(t) = A_0 e^{-\delta f_n t}
$$
If a casting contains cracks or voids, the internal friction increases because the defect regions create local stress concentrations and frictional sliding. Thus, measuring the internal friction provides another robust feature for identifying sand foundry defects.
2.3 Feature Parameters for Defect Identification
Based on the above analysis, two main feature parameters are extracted from the acoustic response of a casting: (1) the fundamental resonant frequency \( f_0 \), and (2) the internal friction value expressed as \( Q^{-1} \) or logarithmic decrement \( \delta \). Table 2 summarizes the expected changes in these parameters when sand foundry defects are present.
| Defect type | Resonant frequency | Internal friction | Physical mechanism |
|---|---|---|---|
| Surface crack | Decrease | Increase | Reduced stiffness, additional friction |
| Shrinkage cavity | Decrease | Increase | Mass reduction, local compliance |
| Inclusion | Decrease | Increase | Discontinuity in elastic modulus |
| Porosity | Decrease | Increase | Reduced effective cross-section, scattering |
In practice, the absolute values of these parameters depend on the casting geometry, size, and material composition. Therefore, a reference set of defect-free castings with identical dimensions and material specifications should be established first. The test sample is then compared against this reference. If the measured resonant frequency deviates by more than a predefined threshold, or the internal friction exceeds the reference range, the casting is flagged as potentially defective. This statistical approach is particularly suitable for mass-produced sand foundry castings where the geometry is constant.
3. Construction of the Audio Frequency Inspection System
The complete audio frequency inspection system consists of five major components: an impulse excitation device, an audio sensor (microphone), a signal conditioning circuit, a data acquisition card (computer sound card), and a microcomputer for data processing. The block diagram of the system is shown conceptually as follows.
The excitation device is a critical part because it must provide a repeatable, broad-band mechanical impulse to the casting. A small hardened steel ball dropped from a fixed height supplies a consistent impact energy. The impact hardfaced steel ball produces a short-duration pulse whose frequency spectrum covers a wide range, typically from a few hundred hertz to over 20 kHz. This ensures that several resonant modes of the casting are excited.
To obtain accurate resonant frequencies, the support conditions must be carefully selected. For a bar or beam-like casting, the optimal support points are at the nodal positions of the fundamental vibration mode. For a free-free beam, the first bending mode has displacement nodes at approximately 0.224L and 0.776L from one end. Supporting the casting at these nodes minimizes the energy lost to the supports and maximizes the internal vibration response. Table 3 lists the nodal positions for the first few vibration modes of a uniform bar.
| Mode number \( n \) | Resonant frequency | Nodal positions (fraction of length from one end) |
|---|---|---|
| 1 | \( f_0 = \frac{1}{2L}\sqrt{E/\rho} \) | None (first mode has no zero-displacement interior point for longitudinal vibration; for bending mode: 0.224, 0.776) |
| 2 | \( f_2 = \frac{2}{2L}\sqrt{E/\rho} \) | 0.5 |
| 3 | \( f_3 = \frac{3}{2L}\sqrt{E/\rho} \) | 0.333, 0.667 |
| 4 | \( f_4 = \frac{4}{2L}\sqrt{E/\rho} \) | 0.25, 0.5, 0.75 |
For this study, the casting is placed on two thin foam strips located at the nodal positions of the second longitudinal mode to reduce support interference. The excitation point is located at one end of the casting, and the microphone is positioned at a fixed distance (about 10 cm) from the opposite end, picking up the air-borne sound.
The audio sensor must have high sensitivity and stability in the frequency range of interest. An electret condenser microphone is selected because it offers a flat frequency response from 0.04 to 16 kHz, high sensitivity, small size, and low cost. Table 4 summarizes the specifications of the selected microphone module.
| Parameter | Value |
|---|---|
| Sensitivity | −38 dB ± 3 dB |
| Output impedance | 2.2 kΩ |
| Operating voltage | 2.0 V |
| Frequency response | 0.04–16 kHz |
| Signal-to-noise ratio | ≥ 68 dB |
| Directional pattern | Omnidirectional back-electret |
The signal conditioning circuit is designed to amplify the weak microphone output to a level compatible with the sound card line input (typically ±1 V). A three-op-amp instrumentation amplifier followed by a proportional amplifier provides a total gain adjustable between 500 and 2100. The gain is controlled by a variable resistor \( R_W \). The overall gain formula is:
$$
A_u = \left(1 + \frac{2R_2}{R_1}\right)\left(\frac{R_7}{R_6}\right)
$$
with the specific values used in the circuit, the achievable gain is:
$$
A_u = \frac{R_W}{R_8} \times \left(1 + \frac{2R_2}{R_1}\right)
$$
In order to protect the sound card from overvoltage, a 1.5 V transient suppression diode is placed in parallel with the output. A resistance network is also used to match the output impedance to the line input impedance of the sound card.
For data acquisition, a standard computer sound card is utilized instead of a dedicated high-price DAQ card. Modern sound cards support 16-bit or 24-bit resolution with sampling rates up to 96 kHz, which is more than sufficient for acoustic signals in the audible range. The sampling rate is set to 44.1 kHz, and the sample length is 1 second. This provides a frequency resolution of approximately 0.0215 Hz when using a 2048-point window, which is adequate for accurate resonance peak identification.
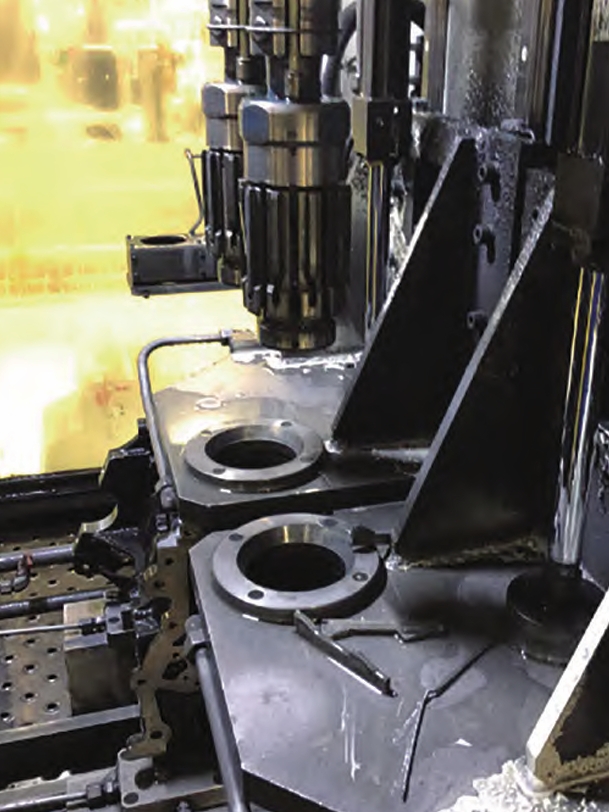
The following figure shows a typical cast engine cylinder block that represents the class of components investigated in this research. Castings like this often contain sand foundry defects that must be detected before machining.
4. Audio Signal Acquisition and Processing
4.1 Data Acquisition Using MATLAB and Sound Card
The signal acquisition program is developed in the MATLAB environment using the Data Acquisition Toolbox. The program first queries the sound card capabilities using the daqhwinfo function, then creates an analog input object, adds a channel, and configures the sampling parameters. The key configuration commands are as follows:
ai = analoginput('winsound');
addchannel(ai, 1);
set(ai, 'SampleRate', 44100);
set(ai, 'TriggerType', 'software');
set(ai, 'TriggerRepeat', 0);
set(ai, 'SamplesPerTrigger', 44100);
set(ai, 'TimeOut', 2);
start(ai);
[data, time] = getdata(ai);
The acquired data are automatically stored in the computer memory and then written to a CSV file for further offline processing. The program also displays the time-domain waveform in real time.
4.2 Preprocessing of Acoustic Signals
The raw acoustic signal often contains a trend component caused by DC offset, sensor drift, and low-frequency environmental noise. This trend must be removed before feature extraction. The polynomial least-squares method is used to fit and subtract a low-order polynomial trend. If the sampled data are \( X_k \) (k=1,2,…,n), the fitted polynomial is:
$$
\hat{X}_k = a_0 + a_1 k + a_2 k^2 + \cdots + a_m k^m
$$
where the coefficients \( a_j \) are determined by minimizing the sum of squared errors:
$$
E = \sum_{k=1}^{n} \left( \hat{X}_k – X_k \right)^2
$$
Typically, a linear trend (m=1) or a quadratic trend (m=2) is sufficient for the acoustic signals encountered in this system.
After detrending, a smoothing operation is applied to reduce high-frequency random noise. The five-point three-degree smoothing algorithm is used, which is based on least-squares polynomial fitting. The smoothed value \( y_i \) is computed from the raw data \( x_i \) using the following set of equations:
$$
\begin{aligned}
y_1 &= \frac{1}{70}\left[69x_1 + 4(x_2 + x_3) – 6(x_4 + x_5)\right] \\
y_2 &= \frac{1}{35}\left[2(x_1 + x_5) + 27x_2 + 12x_3 – 8x_4\right] \\
y_i &= \frac{1}{35}\left[-3(x_{i-2} + x_{i+2}) + 12(x_{i-1} + x_{i+1}) + 17x_i\right] \\
& \quad (i = 3,4,\ldots,m-2) \\
y_{m-1} &= \frac{1}{35}\left[2(x_{m-4} + x_m) – 8x_{m-3} + 12x_{m-2} + 27x_{m-1}\right] \\
y_m &= \frac{1}{70}\left[69x_m + 4(x_{m-1} + x_{m-2}) – 6(x_{m-3} + x_{m-4})\right]
\end{aligned}
$$
4.3 Digital Filtering
To further isolate the frequency band of interest, a digital band-pass filter is implemented. Both finite impulse response (FIR) and infinite impulse response (IIR) filters can be used. In this work, a Butterworth IIR band-pass filter with cutoff frequencies of 1 kHz and 16 kHz is designed. The system function of a digital filter is generally expressed as:
$$
H(z) = \frac{\sum_{k=0}^{N} b_k z^{-k}}{1 + \sum_{k=1}^{M} a_k z^{-k}}
$$
The filter is designed using MATLAB’s Signal Processing Toolbox with the following steps:
- Specify the passband and stopband frequencies and the maximum passband ripple.
- Convert the digital specifications to analog lowpass prototype parameters.
- Design the analog lowpass filter using Butterworth, Chebyshev, or elliptic approximations.
- Transform the analog filter to a digital bandpass filter using the bilinear transform.
- Apply the filter to the acoustic signal using the
filtfiltfunction to achieve zero-phase filtering.
Table 5 compares the characteristics of the main types of digital filters used in acoustic signal processing.
| Type | Advantages | Disadvantages | Application |
|---|---|---|---|
| IIR | Lower order for same roll-off; computationally efficient | Nonlinear phase; possible instability | Bandpass filtering for resonance extraction |
| FIR | Exact linear phase; always stable | Higher order required; more computation | When phase preservation is critical |
4.4 Feature Parameter Extraction
After filtering, the resonant frequency is extracted from the power spectrum. The filtered time-domain signal \( x[n] \) is transformed using the fast Fourier transform (FFT):
$$
X[k] = \sum_{n=0}^{N-1} x[n] e^{-j 2\pi k n / N}
$$
The power spectral density is then:
$$
P[k] = \frac{|X[k]|^2}{N f_s}
$$
where \( f_s \) is the sampling frequency. The peak of \( P[k] \) in the frequency band 6–12 kHz corresponds to the primary longitudinal resonance of the test bar. The corresponding frequency is recorded as \( f_0 \).
The internal friction is determined from the time-domain envelope of the filtered signal. The logarithmic envelope of the decaying vibration is fitted to a straight line using the least-squares method. The slope of this line is proportional to \( -\delta f_0 \). In this study, the internal friction is calculated using:
$$
\delta = \frac{1}{n}\ln\left(\frac{A_1}{A_{n+1}}\right)
$$
and then converted to \( Q^{-1} \). This parameter reflects the total damping caused by both the material and any sand foundry defects.
5. Experimental Results and Discussion
5.1 Artificial Notch Specimens
To validate the system, a set of 16 steel bars (Φ20 × 250 mm) with no initial defects was prepared. Artificial notches of various depths (1 mm, 2 mm, 3 mm, and 4 mm) were cut at four different positions along the length: L/6, L/4, L/3, and L/2, where L is the bar length. The notch width was 1 mm. The resonant frequency of each specimen was measured using the developed audio system. Table 6 reports the measured resonant frequencies for different notch depths and positions.
| Notch depth (mm) | Position L/6 | Position L/4 | Position L/3 | Position L/2 |
|---|---|---|---|---|
| 0 | 8537 | 8540 | 8538 | 8537 |
| 1 | 8512 | 8518 | 8520 | 8517 |
| 2 | 8486 | 8480 | 8473 | 8468 |
| 3 | 8357 | 8344 | 8345 | 8339 |
| 4 | 8219 | 8205 | 8224 | 8199 |
It can be observed that the resonant frequency decreases monotonically with increasing notch depth, regardless of the notch position. For example, a 4 mm notch causes a frequency drop of about 300 Hz relative to the intact bar. This confirms that the resonant frequency is highly sensitive to the severity of the discontinuity.
The internal friction values for the same specimens were also measured and are listed in Table 7.
| Notch depth (mm) | Position L/6 | Position L/4 | Position L/3 | Position L/2 |
|---|---|---|---|---|
| 0 | 1.505 | 1.501 | 1.509 | 1.506 |
| 1 | 1.809 | 1.786 | 1.796 | 1.824 |
| 2 | 2.031 | 1.998 | 2.050 | 2.067 |
| 3 | 2.152 | 2.147 | 2.202 | 2.178 |
| 4 | 2.376 | 2.352 | 2.408 | 2.386 |
These results clearly show that the internal friction increases with notch depth. The presence of a notch converts some of the vibrational energy into localized plastic deformation and friction at the crack faces, thereby accelerating the decay of free vibrations. Both parameters are thus reliable indicators of sand foundry defects.
5.2 Castings with Real Defects
To further verify the applicability of the method, a group of ductile iron cylindrical bars (QT200, Φ20 × 250 mm) were specially cast with different types of defects, including surface cracks, inclusions, and shrinkage cavities. A set of defect-free bars was used as the reference. The measured resonant frequencies and internal friction values are shown in Table 8.
| Defect type | Resonant frequency (Hz) | Internal friction \( Q^{-1} \times 10^{-3} \) |
|---|---|---|
| Surface crack | 7498 | 3.242 |
| Inclusion | 7545 | 2.753 |
| Shrinkage cavity | 7537 | 3.568 |
| No defect (reference) | 7630 | 2.436 |
All defective samples exhibit a lower resonant frequency and a higher internal friction than the reference. The surface crack produces the greatest frequency drop (132 Hz), while the shrinkage cavity causes the largest increase in internal friction (46.5% relative to the reference). This demonstrates that different types of sand foundry defects affect the acoustic response in a measurable and distinguishable way.
The power spectra of the four specimens were compared. The defect-free bar shows a sharp, high-amplitude resonance peak at 7630 Hz. In contrast, the notched or defective bars show a broader, lower-amplitude peak shifted downward in frequency. The reduction in peak amplitude is consistent with increased energy dissipation caused by sand foundry defects.
During the experiments, it was found that the audio system can reliably distinguish defective castings from good ones as long as the geometry and material of the parts remain constant. The measurement repeatability was within ±5 Hz for the resonant frequency and ±3% for the internal friction. This level of precision is adequate for inline screening of sand foundry defects.
5.3 Statistical Evaluation and Threshold Setting
In practical industrial applications, a batch of defect-free castings is first measured to establish the normal distribution of the resonant frequency and internal friction. Let \( \mu_f \) and \( \sigma_f \) be the mean and standard deviation of the resonant frequency, and \( \mu_Q \) and \( \sigma_Q \) be the mean and standard deviation of the internal friction. A casting is classified as defective if:
$$
\left| f_{\text{test}} – \mu_f \right| \geq k_1 \sigma_f
$$
$$
Q_{\text{test}} \geq \mu_Q + k_2 \sigma_Q
$$
where \( k_1 \) and \( k_2 \) are the threshold coefficients chosen according to the required sensitivity and false-alarm rate. For example, using \( k_1 = 3 \) gives a false alarm probability of about 0.3% for a normal distribution. In this study, the reference set yielded \( \mu_f = 7630 \) Hz, \( \sigma_f = 8.2 \) Hz, \( \mu_Q = 2.436 \times 10^{-3} \), and \( \sigma_Q = 0.09 \times 10^{-3} \). All defective samples exceeded the 3-sigma limits, confirming the excellent discriminative power of the method for sand foundry defects.
6. Conclusion
In this paper, a complete audio frequency inspection system for detecting casting defects was designed, constructed, and experimentally validated. The main conclusions of this study are as follows:
- The audio frequency inspection method is a powerful nondestructive technique capable of detecting both surface and internal sand foundry defects. The fundamental resonant frequency and the internal friction are two robust feature parameters that reflect the presence and severity of discontinuities.
- The developed inspection system consists of a steel ball excitation device, an electret condenser microphone, a signal conditioning circuit, and a computer sound card. This hardware configuration is simple, low-cost, and suitable for online inspection in foundry environments.
- The use of a computer sound card as the data acquisition device, together with MATLAB’s Data Acquisition Toolbox and Signal Processing Toolbox, provides a flexible and powerful software platform. The implemented digital signal processing chain—detrending, smoothing, and band-pass filtering—effectively extracts the desired acoustic features from noisy measurements.
- Experiments on artificial notch specimens and real ductile iron castings with surface cracks, inclusions, and shrinkage cavities demonstrated that defective samples exhibit a clear decrease in resonant frequency and an increase in internal friction. The measured changes were statistically significant, and the inspection system successfully identified all defective samples.
- The audio inspection system offers several advantages over conventional NDT methods: it measures the entire component in one test, requires no couplant or surface preparation, provides objective quantitative results, and is easily automatable for high-volume production lines. Therefore, it is a promising solution for online quality control of sand foundry defects.
Future work will focus on extending the method to more complex casting geometries, improving the excitation repeatability, and integrating machine learning algorithms for automatic classification of different defect types. The ultimate goal is to develop a robust industrial system capable of real-time monitoring of sand foundry defects in a wide range of cast components.