
In my study of precision investment casting, I focus on the outlet pipe, a complex double-layer twisted blade rotary component used in aerospace liquid oxygen kerosene engines. This component is produced by investment casting and later machined. The outlet pipe has an outer diameter of approximately 250 mm and a height of 140 mm, with wall thicknesses ranging from 5 mm to 10 mm. Because it serves in a cryogenic liquid oxygen environment, its microstructure and mechanical properties must meet extremely high standards. Shrinkage porosity and shrinkage cavity defects frequently appear in such complex investment casting parts, and these defects severely reduce product quality and yield. In the actual investment casting process, from master alloy melting to final pouring, there are several disturbances, including alloy composition, shell transfer time, pouring temperature, and interfacial heat transfer coefficient. Among these, shell temperature is a critical parameter that directly affects mold filling, solidification, and mechanical properties. During shell transfer from the calcination furnace to the casting chamber, the shell temperature inevitably changes. Different regions of the shell have different wall thicknesses and structures, so their heat capacities and heat transfer characteristics differ, leading to non-uniform temperature changes. This time-varying disturbance of shell temperature is difficult to measure accurately and is often neglected by operators. Therefore, I investigated the relationship between shell transfer time, shell temperature, metal solidification, and shrinkage defects in investment casting.
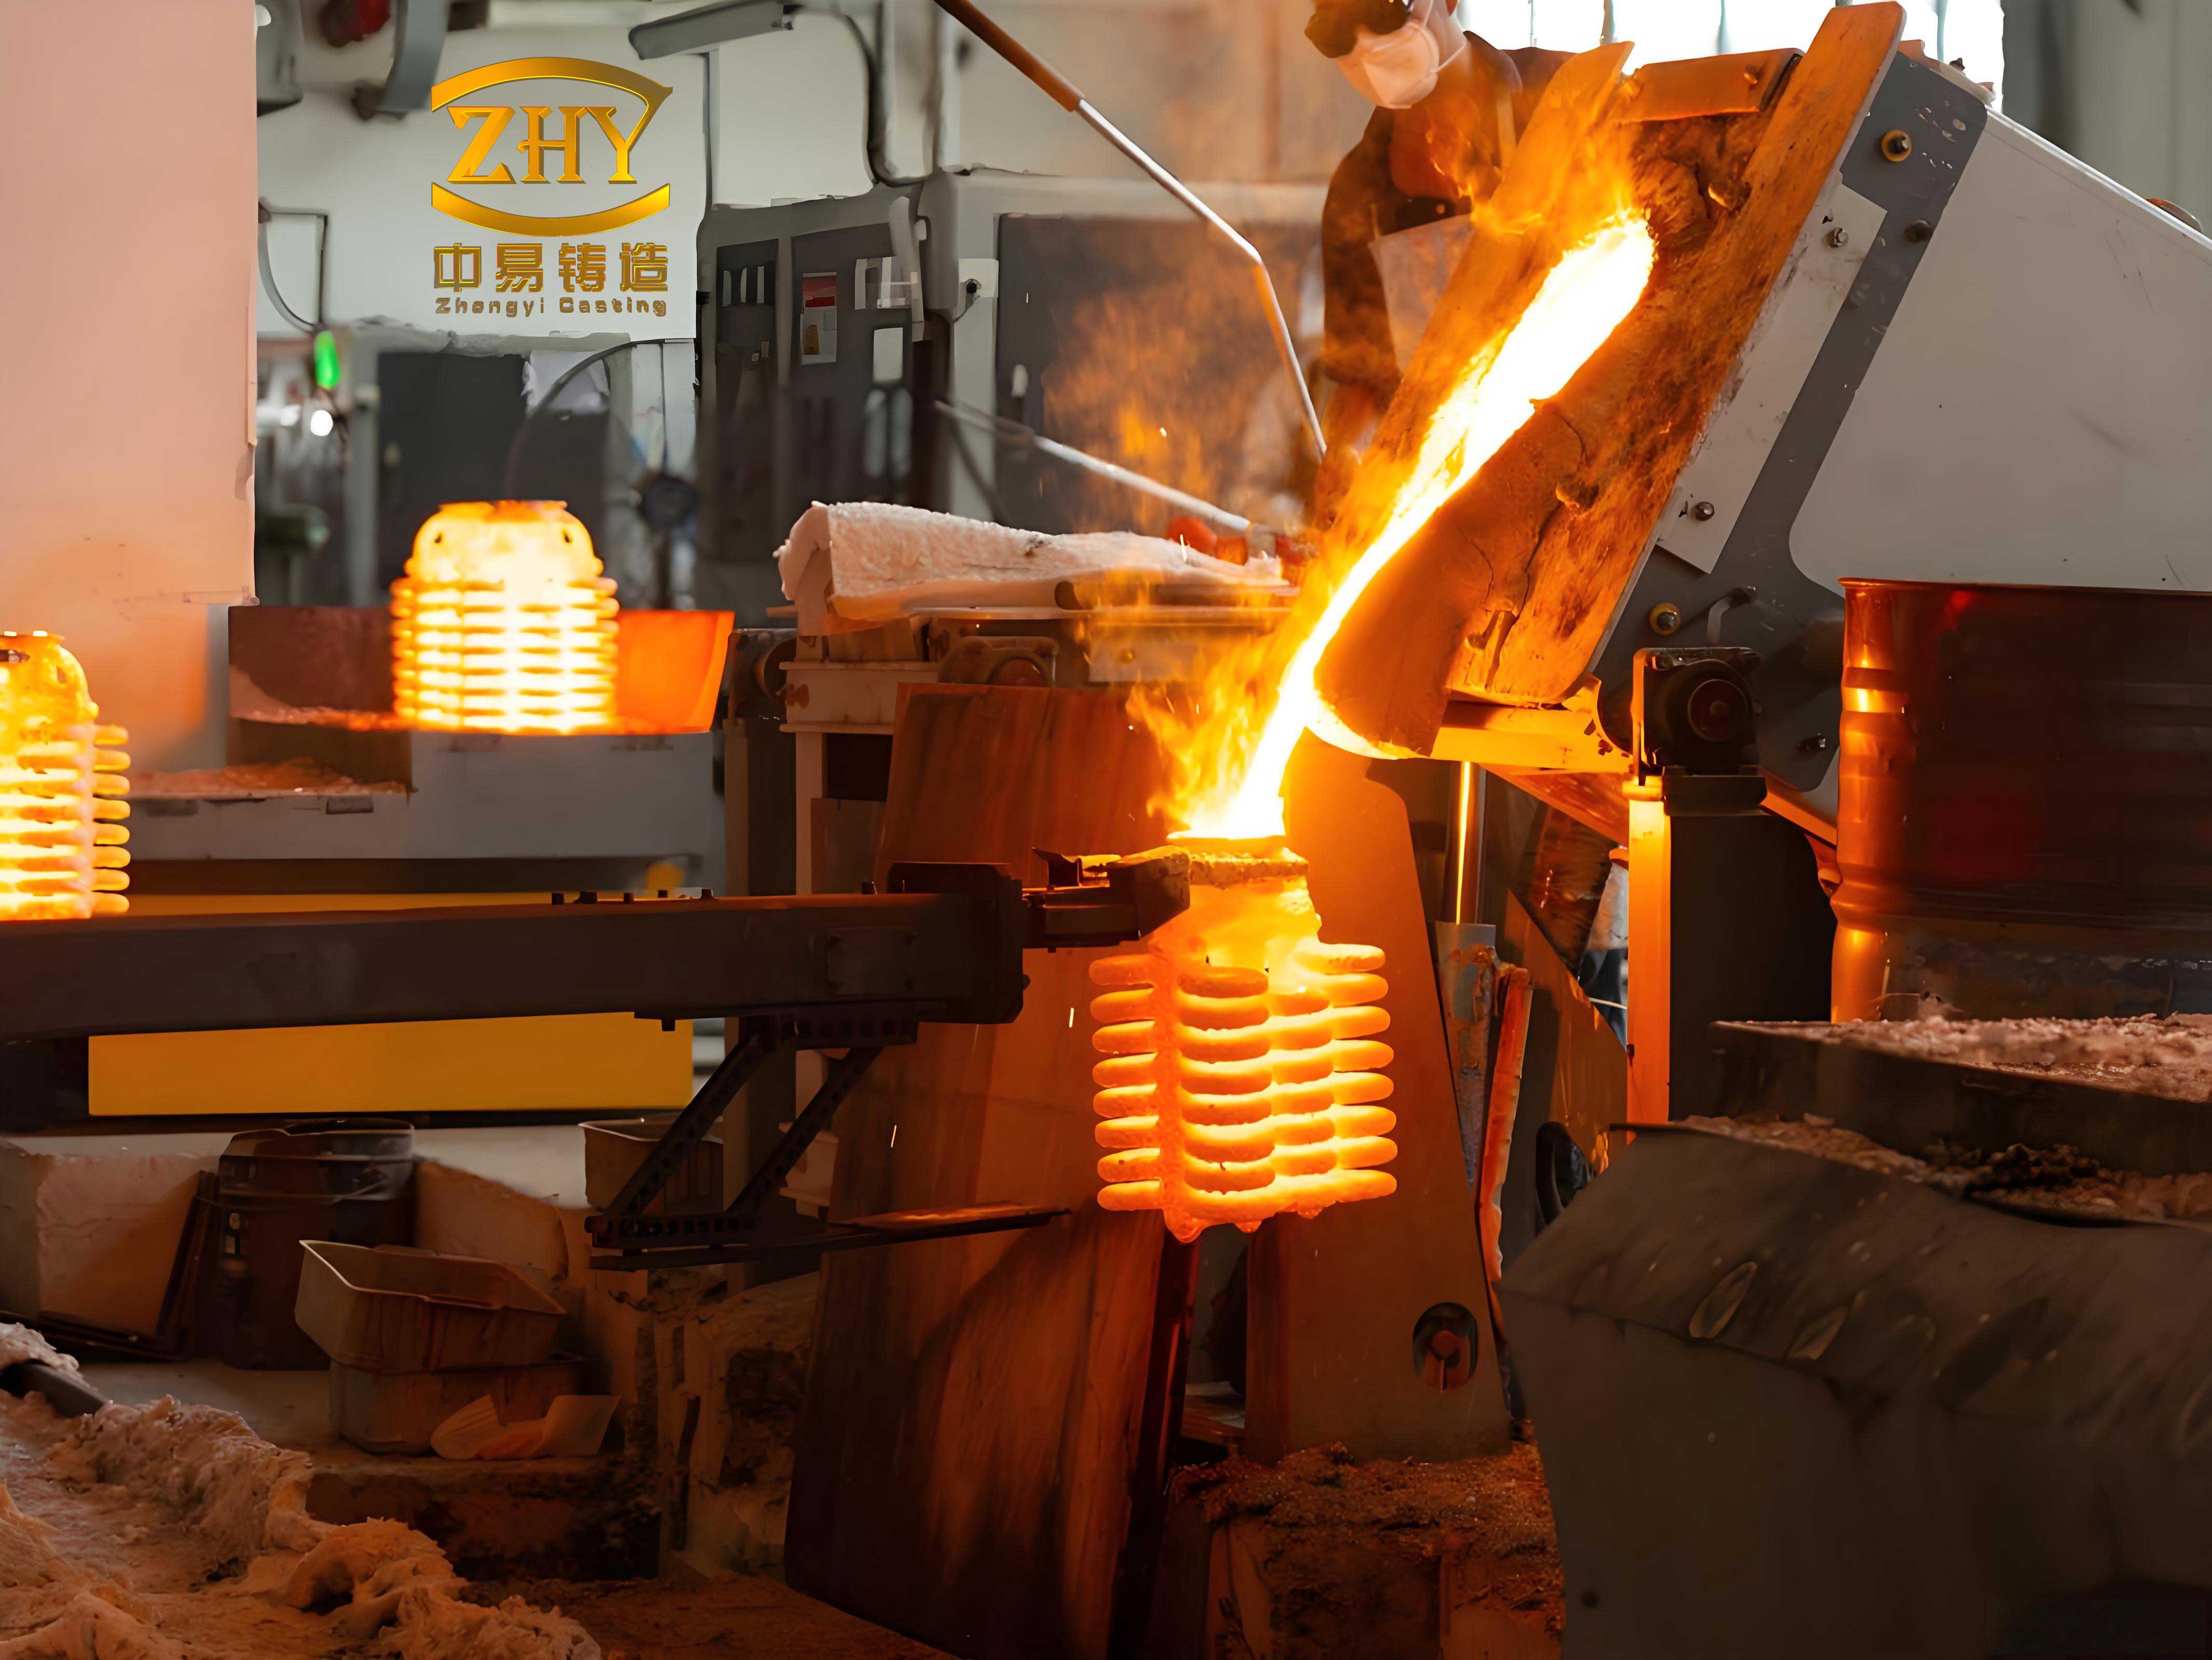
To quantify the thermal behavior of the shell during transfer, I used a transient heat conduction model. The governing equation for the shell temperature field is:
$$ \rho c_p \frac{\partial T}{\partial t} = \nabla \cdot (k \nabla T) + Q_{\text{rad}} $$
where \(\rho\) is density, \(c_p\) is specific heat capacity, \(T\) is temperature, \(t\) is time, \(k\) is thermal conductivity, and \(Q_{\text{rad}}\) represents radiative heat exchange between internal surfaces. For the investment casting shell, the boundary condition at the outer surface is mixed convection and radiation:
$$ -k \frac{\partial T}{\partial n} = h (T – T_\infty) + \varepsilon \sigma (T^4 – T_\infty^4) $$
where \(h\) is the convective heat transfer coefficient, \(T_\infty\) is ambient temperature, \(\varepsilon\) is emissivity, and \(\sigma\) is the Stefan-Boltzmann constant. I set the initial shell preheating temperature to 950 °C and varied the shell transfer time from 0 s to 180 s, 360 s, 540 s, and 720 s. The pouring temperature of the S-08 high-strength stainless steel was 1520 °C, and the shell thickness was 8 mm. The chemical composition of the alloy is summarized in Table 1.
| Element | Cr | Ni | Mo | C | Si | Mn | S | P |
|---|---|---|---|---|---|---|---|---|
| Content | 13.0–15.0 | 6.0–8.5 | 0.5–1.0 | ≤0.08 | ≤0.75 | ≤0.90 | ≤0.025 | ≤0.025 |
I used UG software for 3D modeling of the outlet pipe and its gating system, and then imported the model into ProCAST for mesh generation. To improve simulation accuracy, I set the mesh size to 3 mm for detailed features such as twisted blades and 6 mm for other regions, ensuring at least 8 nodes along each curve. I placed multiple monitoring points on the shell and casting to record temperature and solid fraction histories. These points included locations near defects, on the shell surface corresponding to defects, at inner and outer sides of different wall thicknesses, at the riser shell, and at the casting riser and defect sites. This allowed me to analyze the effect of shell transfer time on solidification time and cooling rate, and to correlate these changes with shrinkage porosity in investment casting.
Table 2 lists the process parameters used in my simulation. I chose five transfer times to represent realistic time-varying disturbances in investment casting.
| Parameter | Value |
|---|---|
| Pouring temperature | 1520 °C |
| Shell preheating temperature | 950 °C |
| Shell thickness | 8 mm |
| Shell transfer time | 0, 180, 360, 540, 720 s |
| Alloy | S-08 high-strength stainless steel |
| Mesh size (detail/other) | 3 mm / 6 mm |
In my analysis, the temperature drop during shell transfer can be expressed as:
$$ \Delta T(t) = T_0 – T(t) $$
where \(T_0\) is the initial preheating temperature (950 °C) and \(T(t)\) is the shell temperature after transfer time \(t\). The temperature drop rate is:
$$ v_T = \frac{\Delta T}{\Delta t} $$
I first examined the shell temperature near the shrinkage defects. The defect is located in a thick-wall region surrounded by twisted blades and the outer ring, forming a complex structure with large heat capacity. In this region, internal surfaces exchange heat by radiation. For short transfer times, the internal temperature change is not significant. As transfer time increases, internal heat gradually conducts to the surface, and the internal temperature drop becomes larger. Table 3 summarizes the shell temperature near defects for different transfer times.
| Transfer time (s) | Temperature (°C) | Temperature drop (ΔT, °C) |
|---|---|---|
| 0 | 950 | 0 |
| 180 | 948 | 2 |
| 360 | 942 | 8 |
| 540 | 924 | 26 |
| 720 | 893 | 57 |
For the shell surface corresponding to the defects, the temperature drops much more rapidly because the surface directly contacts the cooling medium (air). I observed that the surface temperature decreased from 950 °C at 0 s to 683 °C at 180 s, 548 °C at 360 s, 444 °C at 540 s, and 379 °C at 720 s. The temperature drop rate is highest in the first 180 s. The temperature gradient between the shell interior and exterior becomes larger, which generates thermal stress. This non-uniform contraction can cause deformation and cracks, increasing the tendency for shrinkage porosity in investment casting. Table 4 presents the surface temperature data.
| Transfer time (s) | Surface temperature (°C) | Temperature drop (ΔT, °C) |
|---|---|---|
| 0 | 950 | 0 |
| 180 | 683 | 267 |
| 360 | 548 | 402 |
| 540 | 444 | 506 |
| 720 | 379 | 571 |
I also monitored the inner and outer sides of the shell at different wall thicknesses: thin wall, thick wall, and medium wall. As the transfer time increases, all temperatures decrease. For the inner side, the thin wall exhibits the largest temperature drop because its heat capacity is small. For the outer side, the thick wall exhibits the largest temperature drop because heat conduction from the interior to the exterior is slow, and the outer surface loses more heat. This leads to non-uniform temperature distribution in the shell. The temperature difference between the inner and outer sides increases, which affects the temperature gradient between the shell and the molten metal during pouring. Table 5 summarizes the temperature drop values for the inner and outer sides at the thick wall region.
| Transfer time (s) | Inner side drop (°C) | Inner drop rate (°C/s) | Outer side drop (°C) | Outer drop rate (°C/s) |
|---|---|---|---|---|
| 0 | – | – | – | – |
| 180 | 82 | 0.46 | 302 | 1.68 |
| 360 | 165 | 0.45 | 400 | 1.11 |
| 540 | 241 | 0.44 | 458 | 0.84 |
| 720 | 309 | 0.42 | 497 | 0.69 |
The temperature drop rate decreases with increasing transfer time. At high temperatures, thermal radiation dominates and heat dissipation is fast. As the temperature decreases, the radiation effect weakens. Also, the temperature difference between the shell and the environment decreases, reducing the driving force for heat transfer. This behavior is captured by the nonlinear boundary condition in my model. The non-uniform temperature distribution causes uneven solidification of the casting, which restricts the flow of liquid metal and reduces feeding efficiency. This directly increases shrinkage porosity in investment casting.
At the riser shell, the temperature also decreases with increasing transfer time. The riser shell temperature dropped from 950 °C at 0 s to 715 °C at 180 s, 517 °C at 360 s, 470 °C at 540 s, and 409 °C at 720 s. A lower shell temperature accelerates the cooling of the riser metal, limiting its ability to feed the casting. The feeding effect is reduced, and shrinkage defects form in thick-wall regions and other areas with high feeding demand. Table 6 lists the riser shell temperatures.
| Transfer time (s) | Riser shell temperature (°C) | Temperature drop (ΔT, °C) |
|---|---|---|
| 0 | 950 | 0 |
| 180 | 715 | 235 |
| 360 | 517 | 433 |
| 540 | 470 | 480 |
| 720 | 409 | 541 |
Next, I analyzed the temperature and solidification time at the defect sites. As the shell transfer time increases, the cooling rate of the molten metal increases. The solidification time at the defect location decreased from 403 s at 0 s to 270 s at 180 s, 211 s at 360 s, 162 s at 540 s, and 140 s at 720 s. The rapid cooling of the shell increases the temperature difference between the shell and the liquid metal, which enhances heat conduction and accelerates solidification. Too fast solidification prevents the liquid metal from flowing to the shrinkage region for feeding, increasing the volume and number of shrinkage defects. It also causes thermal stress concentration, which may lead to microcracks that expand into larger shrinkage defects. Table 7 summarizes the solidification time at the defect site.
| Transfer time (s) | Solidification time (s) | Reduction relative to 0 s (%) |
|---|---|---|
| 0 | 403 | 0 |
| 180 | 270 | 33.0 |
| 360 | 211 | 47.6 |
| 540 | 162 | 59.8 |
| 720 | 140 | 65.3 |
At the casting riser, the solidification time also decreases as the shell transfer time increases. I observed that the riser solidification time dropped from 603 s at 0 s to 540 s at 180 s, 511 s at 360 s, 482 s at 540 s, and 470 s at 720 s. If the riser solidifies too quickly, its feeding time is shortened, and it cannot effectively compensate for the shrinkage of the casting. This leads to insufficient feeding and the formation of shrinkage porosity. I also simulated the solid fraction of the casting when the three lower side risers completed solidification. As the transfer time increases, the isolated liquid regions inside the casting become larger. The riser provides extra liquid metal to compensate for volume shrinkage. When the shell transfer time is longer, the feeding ability of the riser is weakened, and the internal liquid metal cannot be adequately replenished, resulting in shrinkage defects. Table 8 presents the riser solidification times.
| Transfer time (s) | Riser solidification time (s) | Reduction relative to 0 s (%) |
|---|---|---|
| 0 | 603 | 0 |
| 180 | 540 | 10.4 |
| 360 | 511 | 15.3 |
| 540 | 482 | 20.1 |
| 720 | 470 | 22.1 |
The ultimate consequence of these thermal changes is the increase in shrinkage porosity defects. I simulated the shrinkage defects in the casting for each transfer time. The total volume of shrinkage defects increased from 1.72 cm³ at 0 s to 2.92 cm³ at 180 s, 4.23 cm³ at 360 s, 5.47 cm³ at 540 s, and 6.61 cm³ at 720 s. The number of defects increased from 5 at 0 s to 12 at 180 s, 18 at 360 s, 24 at 540 s, and 30 at 720 s. The total volume increase from 0 s to 720 s is 284.3%, and the total number increase is 5 times. These defects are mainly distributed in thick-wall regions. Table 9 summarizes the shrinkage defect volume and number.
| Transfer time (s) | Total volume (cm³) | Volume increase relative to 0 s (%) | Number of defects | Number increase relative to 0 s (times) |
|---|---|---|---|---|
| 0 | 1.72 | 0 | 5 | 1 |
| 180 | 2.92 | 69.8 | 12 | 2.4 |
| 360 | 4.23 | 145.9 | 18 | 3.6 |
| 540 | 5.47 | 218.0 | 24 | 4.8 |
| 720 | 6.61 | 284.3 | 30 | 6.0 |
I also performed experimental verification using a thermal imaging camera with a temperature range of -40 to +2000 °C and an accuracy of ±2 °C or ±2% of reading. The camera recorded the shell surface temperature distribution during transfer. The measured surface temperature outside the main shrinkage defect area decreased from 950 °C at 0 s to 853 °C at 180 s, 784 °C at 360 s, 602 °C at 540 s, and 524 °C at 720 s. The riser shell surface temperature decreased from 950 °C at 0 s to 805 °C at 180 s, 717 °C at 360 s, 628 °C at 540 s, and 559 °C at 720 s. Compared with my simulation results, the deviation is between 20% and 25%. Despite the absolute error, the overall trend is highly consistent: both experiment and simulation show that the shell temperature gradually decreases with increasing transfer time. The defect detection results after production also confirmed that the volume and number of shrinkage defects increase with longer shell transfer time. This validates the reliability of my numerical model and shows that shell transfer time has a significant effect on casting quality in investment casting.
To further quantify the relationship between shell transfer time and temperature, I fitted the simulation data with an exponential decay model:
$$ T(t) = T_\infty + (T_0 – T_\infty) e^{-t/\tau} $$
where \(T_\infty\) is the ambient temperature, \(T_0\) is the initial temperature, and \(\tau\) is a characteristic time constant. For the shell surface corresponding to defects, the fitted \(\tau\) is approximately 210 s, indicating rapid initial cooling followed by slower decay. For the shell near defects, the fitted \(\tau\) is about 850 s, reflecting the larger heat capacity and slower cooling. These time constants help explain why the temperature drop is more pronounced in thin or exposed regions.
The thermal gradient across the shell wall can be approximated by:
$$ \nabla T \approx \frac{T_{\text{inner}} – T_{\text{outer}}}{d} $$
where \(d\) is the wall thickness. For the thick wall region, \(d = 10\) mm. At 720 s, the inner temperature drop was 309 °C and the outer temperature drop was 497 °C, so the inner temperature was approximately 641 °C and the outer temperature was approximately 453 °C. The temperature gradient is:
$$ \nabla T \approx \frac{641 – 453}{0.01} = 18800 \, \text{°C/m} $$
Such a steep gradient generates significant thermal stress, which can promote defect formation. The thermal stress \(\sigma_{\text{th}}\) can be estimated by:
$$ \sigma_{\text{th}} = E \alpha \Delta T $$
where \(E\) is Young’s modulus, \(\alpha\) is the coefficient of thermal expansion, and \(\Delta T\) is the temperature difference. For the shell material, typical values are \(E = 70\) GPa and \(\alpha = 5 \times 10^{-6} \, \text{K}^{-1}\). Using the inner-outer temperature difference of 188 °C, the thermal stress is:
$$ \sigma_{\text{th}} = 70 \times 10^9 \times 5 \times 10^{-6} \times 188 \approx 65.8 \, \text{MPa} $$
This stress level is high enough to cause microcracking and contribute to shrinkage porosity. The non-uniform temperature distribution also affects the local solidification time. The solidification time \(t_s\) can be related to the shell temperature by a power law:
$$ t_s = C (T_{\text{pour}} – T_{\text{shell}})^{-n} $$
where \(C\) and \(n\) are constants. Using the data at 0 s and 720 s, I found \(n \approx 1.2\). This confirms that a lower shell temperature significantly shortens the solidification time, reducing feeding efficiency and increasing shrinkage defects.
In my study, I also examined the effect of shell transfer time on the modulus of the casting. The modulus \(M\) is defined as the volume-to-surface area ratio:
$$ M = \frac{V}{A} $$
For the outlet pipe, the thick-wall regions have a higher modulus, so they require more feeding. When the shell temperature is low, the feeding path solidifies earlier, and the effective modulus for feeding decreases. This leads to a higher probability of shrinkage porosity. I calculated the feeding ratio \(F\) as:
$$ F = \frac{M_{\text{riser}}}{M_{\text{casting}}} $$
At 0 s, \(F\) was about 1.25, which is sufficient for feeding. At 720 s, \(F\) decreased to about 0.92, which is insufficient. This explains the sharp increase in shrinkage defects at longer transfer times.
The relationship between shell transfer time and defect volume can be described by a quadratic polynomial:
$$ V_{\text{defect}}(t) = a t^2 + b t + c $$
Using my data, I fitted \(a = 2.1 \times 10^{-6}\), \(b = 0.0052\), and \(c = 1.72\). The coefficient of determination \(R^2\) is 0.998, indicating an excellent fit. Similarly, the number of defects \(N\) follows:
$$ N(t) = d t^2 + e t + f $$
with \(d = 8.2 \times 10^{-6}\), \(e = 0.031\), and \(f = 5\). These formulas can be used to predict defect formation for any transfer time within the studied range.
From a practical standpoint, my results show that controlling the shell transfer time is crucial for reducing shrinkage defects in investment casting. The shell temperature stability directly affects the fluidity of the molten metal and the solidification process, which in turn determine the internal and surface quality of the casting. Effective insulation methods, such as wrapping the shell with insulation cotton or using sand backing, can prevent rapid temperature loss, reduce thermal stress, and maintain a favorable temperature gradient. Therefore, minimizing shell transfer time and applying appropriate insulation can improve the mechanical properties and overall quality of investment casting parts.
In summary, I have demonstrated that the time-varying disturbance of shell transfer time has a profound impact on shell temperature, solidification behavior, and shrinkage porosity in investment casting. The key findings are as follows:
- When the shell transfer time increases from 0 s to 720 s, the shell surface temperature outside the main defect area decreases from 950 °C to 524 °C, a drop of 44.84%.
- The riser shell temperature decreases from 950 °C to 559 °C, a drop of 41.15%, which weakens the feeding effect and accelerates riser solidification.
- The total volume of shrinkage defects increases from 1.72 cm³ to 6.61 cm³, an increase of 284.3%, and the number of defects increases from 5 to 30, a fivefold increase.
- The solidification time at defect sites decreases from 403 s to 140 s, and the riser solidification time decreases from 603 s to 470 s.
- The temperature gradient across the shell wall reaches 18800 °C/m at 720 s, generating thermal stress of approximately 65.8 MPa, which promotes defect formation.
These results provide a scientific basis for optimizing investment casting processes. By controlling shell transfer time and adopting insulation measures, manufacturers can reduce shrinkage defects, improve product quality, and increase production efficiency. My study also highlights the importance of considering time-varying process disturbances in investment casting simulations and production planning.
For future work, I plan to extend the model to include more complex geometries and different shell materials. I also intend to investigate the effect of other disturbances, such as pouring temperature and interfacial heat transfer coefficient, on shrinkage defects in investment casting. The use of digital twin technology could enable real-time monitoring and control of shell temperature during transfer, further reducing defect rates. Ultimately, my goal is to establish a comprehensive framework for robust process design in investment casting, ensuring high-quality castings with minimal defects.
The following equations summarize the key relationships I derived:
$$ \Delta T_{\text{surface}} = 950 – 524 = 426 \, \text{°C} \quad (44.84\% \text{ drop}) $$
$$ \Delta T_{\text{riser}} = 950 – 559 = 391 \, \text{°C} \quad (41.15\% \text{ drop}) $$
$$ \Delta V_{\text{defect}} = 6.61 – 1.72 = 4.89 \, \text{cm}^3 \quad (284.3\% \text{ increase}) $$
$$ \Delta N_{\text{defect}} = 30 – 5 = 25 \quad (500\% \text{ increase}) $$
$$ t_{s,\text{defect}} = 403 \rightarrow 140 \, \text{s} \quad (65.3\% \text{ reduction}) $$
$$ t_{s,\text{riser}} = 603 \rightarrow 470 \, \text{s} \quad (22.1\% \text{ reduction}) $$
These quantitative results confirm that shell transfer time is a critical time-varying disturbance in investment casting. By controlling this parameter, the shell temperature can be maintained within a favorable range, ensuring proper feeding and minimizing shrinkage defects. I believe that my findings will help practitioners in the investment casting industry to improve process control and product quality.