
In my research on lightweight commercial vehicle structures, I focused on the integral manufacturing of a load-bearing crossbeam through ductile iron casting. The growing demand for reduced fuel consumption and lower emissions has made vehicle weight reduction a central engineering objective. For commercial vehicles, the crossbeam is a critical load-bearing component that must simultaneously satisfy high stiffness, high strength, and fatigue durability requirements. Traditional steel crossbeams are usually assembled from multiple stamped and welded parts, which increases process complexity, manufacturing cost, and potential weak points. In contrast, ductile iron casting offers a promising route for integrated design because it can produce complex geometries in a single pour while maintaining excellent mechanical properties. My work therefore combines structural integration, casting process design, numerical simulation, statistical optimization, and experimental validation to develop a reliable ductile iron casting process for a commercial vehicle crossbeam.
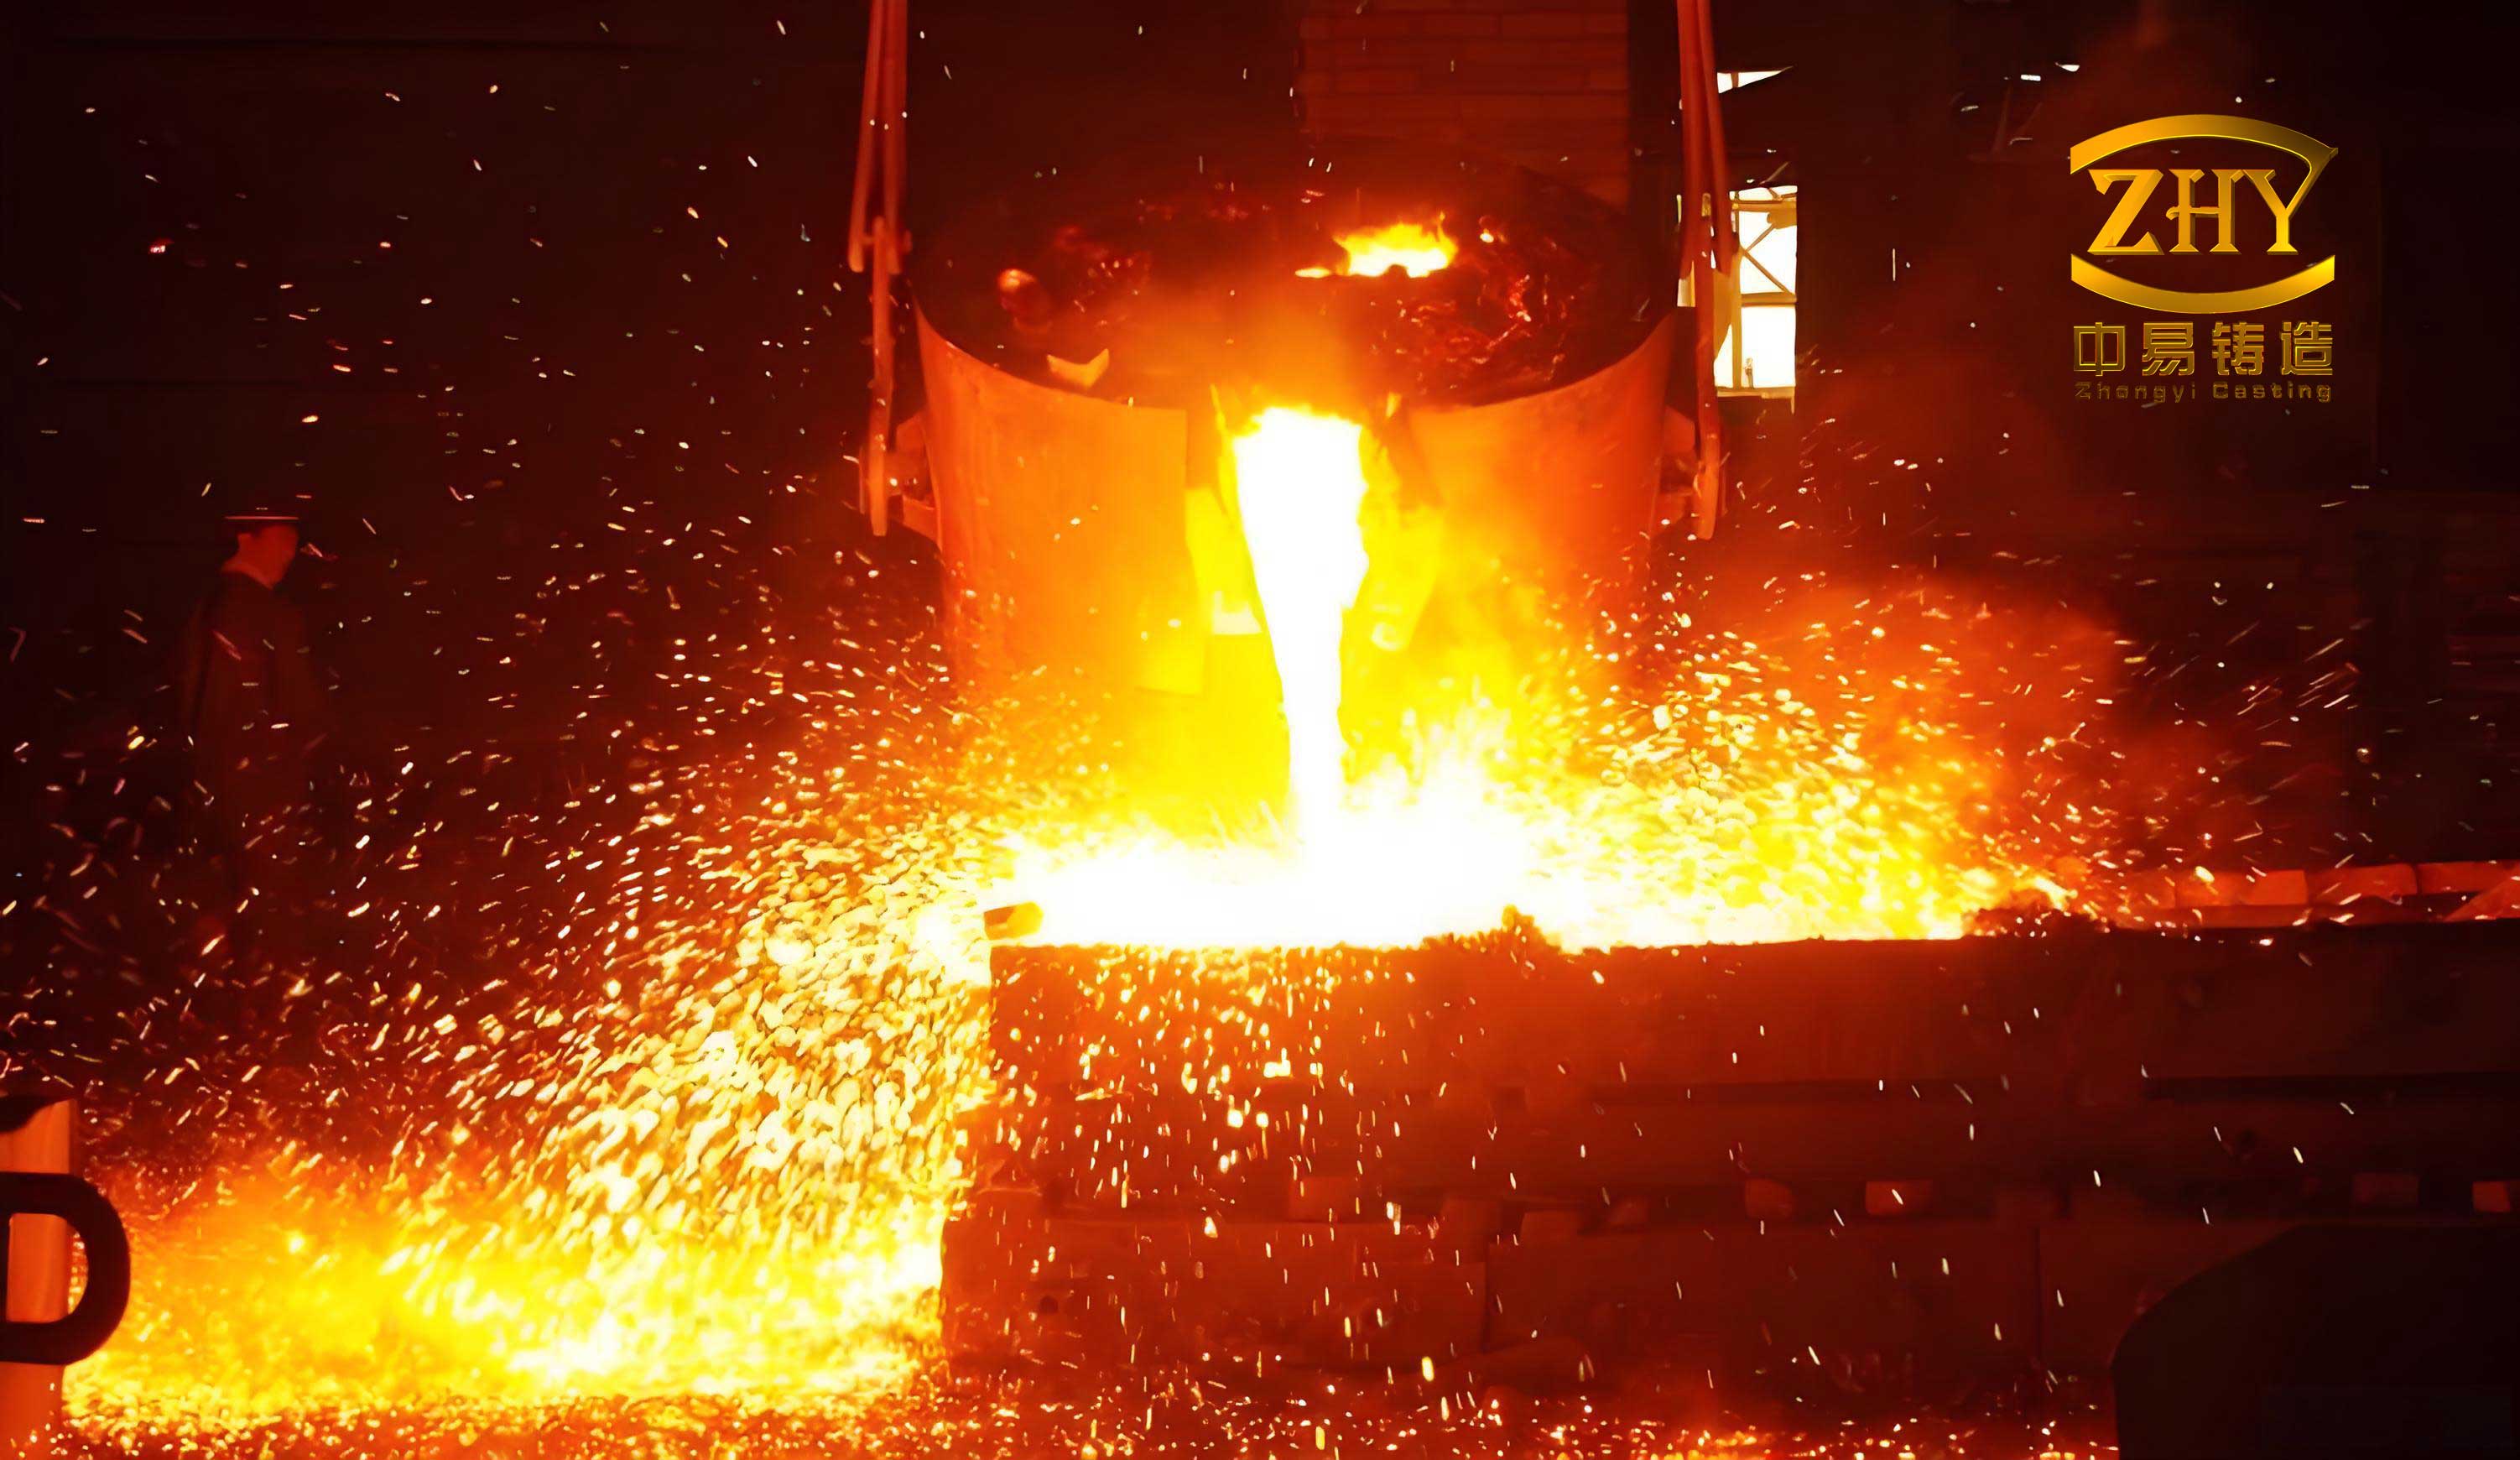
Ductile iron casting is distinguished from gray iron casting by the presence of spheroidal graphite, which interrupts the continuity of the matrix far less severely than flake graphite. This nodular graphite morphology improves tensile strength, toughness, fatigue resistance, and wear resistance. The matrix can be ferritic, pearlitic, or a mixture of both, and its proportion directly controls the balance between strength and ductility. In my study, I selected a pearlitic ductile iron grade, QT800-5, because the crossbeam requires high strength and moderate elongation. The chemical composition, nodularity, graphite size, and pearlite content all influence the final performance of the ductile iron casting. Therefore, I treated the crossbeam not only as a structural problem but also as a metallurgical and process-control problem.
The solidification behavior of ductile iron casting is more complex than that of many other cast alloys. It exhibits divorced eutectic solidification, a wide eutectic temperature range, and a mushy freezing mode. Graphite nodules grow first, and then austenite shells form around them. Carbon diffusion through the austenite shell becomes sluggish, which slows graphite growth and extends the solidification interval. The remaining liquid is partitioned into isolated pockets, making feeding difficult. If these isolated liquid regions cannot be adequately fed, shrinkage porosity and shrinkage cavities form. In addition, graphite has a lower density than liquid iron, so graphitization expansion can partially compensate for solidification shrinkage. However, this expansion can also deform the solidifying shell and increase mold wall movement, which may worsen shrinkage defects if the process is not properly controlled. My objective was to design a ductile iron casting process that balances these effects through proper gating, risering, and parameter selection.
Numerical simulation is an essential tool for modern ductile iron casting development. It allows the filling and solidification processes to be visualized before actual production, reducing trial-and-error cost and shortening the development cycle. I used a commercial casting simulation platform to model mold filling, heat transfer, solidification, gas entrainment, and shrinkage porosity. The simulation results were then used to optimize the gating system, riser arrangement, pouring temperature, and pouring speed. The main physical fields included the velocity field, temperature field, liquid fraction, and defect distribution. The governing equations for fluid flow and heat transfer can be summarized as follows:
$$ \nabla \cdot \mathbf{v} = 0 $$
$$ \rho \left( \frac{\partial \mathbf{v}}{\partial t} + \mathbf{v} \cdot \nabla \mathbf{v} \right) = -\nabla p + \mu \nabla^2 \mathbf{v} + \rho \mathbf{g} $$
$$ \rho c_p \left( \frac{\partial T}{\partial t} + \mathbf{v} \cdot \nabla T \right) = \nabla \cdot (k \nabla T) + L \frac{\partial f_s}{\partial t} $$
Here, \(\mathbf{v}\) is the velocity vector, \(\rho\) is density, \(p\) is pressure, \(\mu\) is dynamic viscosity, \(\mathbf{g}\) is gravitational acceleration, \(c_p\) is specific heat, \(T\) is temperature, \(k\) is thermal conductivity, \(L\) is latent heat, and \(f_s\) is solid fraction. These equations were solved numerically to predict the filling and solidification behavior of the ductile iron casting.
Before designing the casting process, I performed a structural integration study of the original crossbeam. The original component consisted of seven separate steel parts, including L-shaped plates, fixed seats, and a U-shaped plate. The total mass was 50.5 kg. The manufacturing route involved multiple forming, welding, and assembly steps, which increased cost and reduced dimensional consistency. I redesigned the crossbeam as a single ductile iron casting with a mass of 36 kg, achieving a 28.7% weight reduction. The integrated design also reduced the number of joints and eliminated weld-induced defects. The main technical parameters of the original crossbeam are summarized in Table 1.
| Component | Material | Elastic modulus (MPa) | Yield strength (MPa) | Poisson ratio | Mass (kg) |
|---|---|---|---|---|---|
| Fixed seat | QT550 | 172000 | 320 | 0.275 | 9.78 × 2 |
| Steel plate | B510L | 200000 | 355 | 0.3 | (4.46 + 5.07) × 2 |
For the integrated ductile iron casting, I used an equal-stiffness replacement method to estimate the minimum wall thickness. The relationship between steel and ductile iron thickness can be expressed as:
$$ E_{sl} t_{sl}^3 = E_{dl} t_{dl}^3 $$
where \(E_{sl}\) and \(E_{dl}\) are the elastic moduli of steel and ductile iron, respectively, and \(t_{sl}\) and \(t_{dl}\) are the corresponding wall thicknesses. Using this equation, I determined that the minimum ductile iron wall thickness should be 8.0 mm to maintain stiffness comparable to the original steel structure. I also changed the main load-bearing section from an I-beam configuration to a circular tubular section to improve torsional rigidity. Reinforcing ribs were placed in critical zones, and fillets were used at transitions to reduce stress concentration. The maximum overall dimensions of the integrated crossbeam were 839 mm × 403 mm × 221 mm.
I then performed static structural analysis under four representative load cases: acceleration, cornering, torsion, and emergency braking. The finite element model included the crossbeam, frame rails, and connection points. Shell elements were used for the frame rails and steel plates, while tetrahedral elements were used for the complex ductile iron casting. Rigid elements simulated bolts, rivets, and thrust rods. The mesh contained 66,444 shell elements and 67,864 nodes for the frame, and 3,309,713 tetrahedral elements and 133,147 nodes for the crossbeam. The boundary conditions constrained all degrees of freedom at the wheel mounting points. The applied loads were 60,000 N in the negative X direction for acceleration, 80,000 N in the negative Y direction for cornering, 80,000 N·m torque for torsion, and 20,000 N opposite forces for emergency braking. Table 2 summarizes the maximum equivalent stress for the original and integrated crossbeams.
| Load case | Original crossbeam maximum stress (MPa) | Integrated crossbeam maximum stress (MPa) |
|---|---|---|
| Acceleration | 85.1 | 69.3 |
| Cornering | 396.1 | 311.1 |
| Torsion | 680.6 | 558.4 |
| Emergency braking | 95.4 | 95.4 |
The original crossbeam exceeded the yield strength of the material under torsional loading, with a maximum stress of 680.6 MPa. The integrated ductile iron crossbeam showed a maximum equivalent stress of 558.4 MPa under torsion, which is below the allowable stress of QT800-5. The safety factor was approximately 1.4, satisfying the strength requirement for commercial vehicle operation. The maximum stress locations were consistently found near threaded holes, where stress concentration occurs. These results confirmed that the integrated design could meet the structural requirements while reducing weight.
After structural verification, I designed the ductile iron casting process. The parting plane was selected at the maximum contour of the crossbeam to ensure proper mold filling and easy demolding. The casting had a complex geometry with wall thickness varying from 8.0 mm to 55.4 mm. Such thickness variation creates hot spots and isolated liquid regions during solidification. Because ductile iron casting exhibits mushy solidification, feeding must be carefully controlled. I used a sand mold with a self-hardening resin sand core. The core was designed to form the internal cavities, and venting channels were incorporated to remove gases generated by the resin binder and metal-mold reaction.
The gating system was designed as a closed system with a cross-sectional area ratio of sprue : runner : ingate = 2.50 : 1.25 : 1. Four ingates were used to ensure uniform filling of the long-span crossbeam. The ingate area was calculated using the flow rate equation:
$$ A_g = \frac{V}{v_g t} $$
where \(A_g\) is the total ingate cross-sectional area, \(V\) is the volume of metal passing through the ingates, \(v_g\) is the flow velocity, and \(t\) is the filling time. The calculated ingate area was 1200 mm², the runner area was 1500 mm², and the sprue area was 3000 mm². The pouring time was estimated from the empirical relationship:
$$ t = f \left( \sqrt{G} + \sqrt[3]{0.2 W G} \right) $$
where \(f\) is a material coefficient, \(G\) is the casting mass, and \(W\) is the wall thickness. Using \(f = 0.6\) to \(0.8\), I obtained a pouring time of approximately 7.27 s, which corresponded to a pouring speed of about 11 cm/s. The initial pouring temperature range was set between 1380 °C and 1420 °C, and the mold preheating temperature was 20 °C. The casting shrinkage rate for pearlitic ductile iron was taken as 1.2%.
I first simulated the initial gating system with four risers. The filling process showed that the liquid metal entered the mold smoothly, but solidification analysis revealed isolated liquid regions at both ends of the crossbeam. These regions had long solidification times and could not be fed adequately, leading to shrinkage porosity. The initial porosity volume was 751.16 mm³. I then optimized the riser design by increasing the number of risers from four to eight, with each riser having dimensions of 4 × Φ70 mm × 120 mm, and placing them symmetrically at both ends of the crossbeam. The optimized gating system reduced the porosity volume to 685.85 mm³, a decrease of 8.69%. Table 3 compares the initial and optimized gating systems.
| Parameter | Initial design | Optimized design |
|---|---|---|
| Number of risers | 4 | 8 |
| Riser dimensions | — | 4 × Φ70 mm × 120 mm |
| Porosity volume (mm³) | 751.16 | 685.85 |
| Reduction (%) | — | 8.69 |
The optimized gating system also shortened the solidification time at both ends from 436 s to 307.67 s. The isolated liquid regions disappeared, and the final solidification zones were mainly located in the risers and gating system. This indicated that the risers successfully provided feeding to the hot spots. The shrinkage porosity distribution matched the residual liquid regions, confirming that the simulation could accurately predict defect locations. The optimized process produced a more uniform defect distribution, with most defects concentrated in the risers rather than in the load-bearing sections of the crossbeam.
Next, I systematically studied the effects of pouring temperature and pouring speed on the ductile iron casting process. I simulated three pouring temperatures: 1380 °C, 1400 °C, and 1420 °C, while keeping the pouring speed at 11 cm/s and the mold temperature at 20 °C. The filling process at 1400 °C was smooth and stable. At 1380 °C, the metal flow was slower, and some thick sections filled later, but no cold shuts or misruns occurred. At 1420 °C, the flow was faster, but more vortices appeared, increasing gas entrainment. The gas entrainment volumes for 1380 °C, 1400 °C, and 1420 °C were 1700.58 mm³, 1682.44 mm³, and 1697.82 mm³, respectively. The minimum gas entrainment occurred at 1400 °C. The shrinkage porosity volumes for the same temperatures were 667.92 mm³, 685.85 mm³, and 702.11 mm³, respectively. The lowest porosity volume occurred at 1380 °C. These results showed that pouring temperature has opposing effects on gas entrainment and shrinkage porosity. Higher temperature improves fluidity but increases solidification shrinkage and gas solubility effects. Lower temperature reduces shrinkage but may impair filling.
I then studied the effect of pouring speed. I simulated three pouring speeds: 10 cm/s, 11 cm/s, and 12 cm/s, while keeping the pouring temperature at 1400 °C and the mold temperature at 20 °C. At 10 cm/s, the filling process was slower but very stable. At 12 cm/s, the filling was faster, but more splashing and local vortices occurred. The gas entrainment volumes for 10 cm/s, 11 cm/s, and 12 cm/s were 1655.77 mm³, 1682.44 mm³, and 1700.39 mm³, respectively. The minimum gas entrainment occurred at 10 cm/s. The shrinkage porosity volumes for the same speeds were 696.92 mm³, 685.85 mm³, and 680.85 mm³, respectively. The minimum porosity volume occurred at 12 cm/s. These trends indicated that higher pouring speed reduces shrinkage porosity by shortening filling time and retaining more heat, but it also increases gas entrainment because of higher turbulence.
To determine the optimal combination of process parameters, I designed an L9 orthogonal experiment with two factors and three levels. The factors were pouring speed A (10, 11, 12 cm/s) and pouring temperature B (1380, 1400, 1420 °C). The response variables were gas entrainment volume and shrinkage porosity volume. Table 4 shows the orthogonal array and the measured simulation results.
| Experiment | A: pouring speed (cm/s) | B: pouring temperature (°C) | Gas entrainment (mm³) | Shrinkage porosity (mm³) |
|---|---|---|---|---|
| 1 | 10 | 1380 | 1677.19 | 679.18 |
| 2 | 10 | 1400 | 1655.77 | 696.92 |
| 3 | 10 | 1420 | 1668.84 | 713.20 |
| 4 | 11 | 1400 | 1682.44 | 685.85 |
| 5 | 11 | 1420 | 1697.82 | 702.11 |
| 6 | 11 | 1380 | 1700.58 | 667.92 |
| 7 | 12 | 1420 | 1704.32 | 697.20 |
| 8 | 12 | 1400 | 1700.39 | 680.85 |
| 9 | 12 | 1380 | 1721.51 | 663.00 |
I analyzed the orthogonal experiment using range analysis and variance analysis. For gas entrainment, the range of pouring speed was 124.42, and the range of pouring temperature was 60.68. This indicated that pouring speed had a stronger effect on gas entrainment than pouring temperature. The analysis of variance showed that the F value for pouring speed was 24.266 with p = 0.006, which is statistically significant. The F value for pouring temperature was 5.211 with p = 0.077, which is not statistically significant at the 0.05 level. Therefore, pouring speed significantly affected gas entrainment, while pouring temperature did not. Table 5 summarizes the significance test for gas entrainment.
| Source | Sum of squares | Degrees of freedom | Mean square | F value | p value |
|---|---|---|---|---|---|
| Pouring speed | 2643.000 | 2 | 1321.500 | 24.266 | 0.006 |
| Pouring temperature | 567.608 | 2 | 283.804 | 5.211 | 0.077 |
| Error | 108.919 | 2 | 54.459 | — | — |
For shrinkage porosity, the range of pouring speed was 48.29, and the range of pouring temperature was 102.45. This indicated that pouring temperature had a stronger effect on shrinkage porosity than pouring speed. The analysis of variance showed that the F value for pouring temperature was 12.247 with p = 0.017, which is statistically significant. The F value for pouring speed was 2.847 with p = 0.167, which is not statistically significant. Therefore, pouring temperature significantly affected shrinkage porosity, while pouring speed did not. Table 6 summarizes the significance test for shrinkage porosity.
| Source | Sum of squares | Degrees of freedom | Mean square | F value | p value |
|---|---|---|---|---|---|
| Pouring speed | 406.121 | 2 | 203.061 | 2.847 | 0.167 |
| Pouring temperature | 1747.142 | 2 | 873.571 | 12.247 | 0.017 |
| Error | 142.659 | 2 | 71.330 | — | — |
Based on the orthogonal experiment and variance analysis, I selected the optimal parameters as pouring speed 11 cm/s, pouring temperature 1380 °C, and mold temperature 20 °C. This combination corresponded to experiment 6, which produced a gas entrainment volume of 1700.58 mm³ and a shrinkage porosity volume of 667.92 mm³. Although the gas entrainment was slightly higher than the minimum value, the shrinkage porosity was the lowest among all runs, and the pouring speed of 11 cm/s provided a good balance between filling stability and defect control. The optimized process reduced the shrinkage porosity volume by 11.74% compared with the initial gating system. The final solidification simulation showed that the solidification sequence followed the intended directional pattern: the thin central web solidified first, followed by the ends and thin walls, and finally the thick sections and risers. The total solidification time was 307.67 s.
I then conducted a production trial using the optimized process. The melting was carried out in a 1000 kg medium-frequency induction furnace. The charge consisted of high-purity pig iron, carbon steel scrap, and foundry returns. The nodularizer was FeSiMg6RE2 rare earth magnesium alloy, and the inoculants were Si-Ba and 75SiFe. The spheroidization treatment was performed by the cored wire method, which improved magnesium absorption and reduced smoke and oxidation. The pouring temperature was 1380 °C, the pouring speed was 11 cm/s, and the mold temperature was 20 °C. After pouring, the casting was cooled below 400 °C, then shaken out, cleaned, and inspected. Table 7 shows the chemical composition of the trial crossbeam. The carbon equivalent and residual magnesium content were within the required range, and the phosphorus and sulfur contents were sufficiently low to avoid phosphide eutectic and sulfide inclusions.
| Element | C | Si | Mn | P | S | Mg | Ni | Mo | Cu |
|---|---|---|---|---|---|---|---|---|---|
| wt.% | 3.61 | 2.67 | 0.105 | 0.007 | 0.007 | 0.043 | 0.438 | 0.151 | 0.803 |
I sampled three positions on the crossbeam: position 1 near the ingate, position 2 at the thin central web, and position 3 at the far end. Metallographic analysis showed that the graphite morphology was predominantly spheroidal. The nodularity grade was 2 for all positions, and the graphite size grade was 6 to 7. The matrix consisted of ferrite and pearlite, with pearlite content above 90% and carbide content below 1%. No phosphide eutectic was observed. Table 8 summarizes the metallographic rating results. The graphite nodule count was 180/mm² at position 1, 252/mm² at position 2, and 212/mm² at position 3. Position 2 had the smallest graphite nodules because it solidified fastest, while position 1 had the largest nodules because it cooled slowly near the ingate.
| Position | Nodularity grade | Graphite size grade | Pearlite content (%) | Carbide (%) | Phosphide eutectic (%) |
|---|---|---|---|---|---|
| 1 | 2 | 6 | ≥90 | 1 | — |
| 2 | 2 | 7 | ≥95 | 1 | — |
| 3 | 2 | 6 | ≥90 | 1 | — |
Tensile tests were performed on specimens from the three positions. The results are shown in Table 9. Position 1 had the highest elongation of 7.6%, with a yield strength of 546 MPa and a tensile strength of 875 MPa. Position 2 had the highest tensile strength of 891 MPa, a yield strength of 562 MPa, and the lowest elongation of 6.0%. Position 3 had a tensile strength of 854 MPa, a yield strength of 552 MPa, and an elongation of 6.5%. All positions exceeded the minimum requirements of yield strength ≥ 500 MPa, tensile strength ≥ 800 MPa, and elongation ≥ 5%. The hardness values at all positions were above 270 HV, with small variation, indicating uniform matrix quality and adequate feeding. Table 10 shows the hardness results.
| Position | Yield strength Rp0.2 (MPa) | Tensile strength Rm (MPa) | Elongation A (%) |
|---|---|---|---|
| 1 | 546 | 875 | 7.6 |
| 2 | 562 | 891 | 6.0 |
| 3 | 552 | 854 | 6.5 |
| Position | Hardness 1 (HV) | Hardness 2 (HV) | Hardness 3 (HV) | Average (HV) |
|---|---|---|---|---|
| 1 | 280.8 | 285.8 | 285.8 | 284.1 |
| 2 | 272.2 | 293.8 | 279.7 | 281.9 |
| 3 | 297.3 | 280.8 | 279.7 | 285.9 |
Fracture surface analysis showed that the fracture morphology was dominated by cleavage facets and river patterns, indicating limited ductility, which is typical of pearlitic ductile iron. The cleavage platform size and river pattern density increased with distance from the ingate. Position 1 near the ingate had finer cleavage features and better plasticity, while positions 2 and 3 had larger cleavage platforms and more river patterns, indicating lower plasticity. Energy dispersive spectroscopy revealed that the main inclusion was CaO, with a sharp diamond-like morphology. This inclusion acted as a stress concentrator and crack initiation site, and its detrimental effect on mechanical properties was greater than that of spheroidal graphite. Graphite nodules also acted as crack initiation sites, but cracks tended to propagate along the graphite-matrix interface without forming large voids, so their influence was less severe than that of sharp oxide inclusions.
The results of my study demonstrate that ductile iron casting can be successfully used to produce an integrated commercial vehicle crossbeam with high strength, adequate ductility, and reduced weight. The optimized process combined structural integration, gating system design, riser optimization, numerical simulation, and statistical analysis. The final casting met the mechanical property requirements, and the microstructure was uniform and predominantly pearlitic. The main conclusions of my work can be summarized as follows.
First, the integrated crossbeam design reduced the mass from 50.5 kg to 36 kg, a 28.7% reduction. Static analysis under acceleration, cornering, torsion, and braking showed that the maximum equivalent stress was 558.4 MPa, with a safety factor of 1.4. This satisfied the strength requirement for commercial vehicle operation. The maximum stress occurred near threaded holes, where local reinforcement or fillet optimization could be considered in future work.
Second, the initial gating system with four risers produced a shrinkage porosity volume of 751.16 mm³. By increasing the number of risers to eight and placing them at both ends of the crossbeam, the porosity volume was reduced to 685.85 mm³, a decrease of 8.69%. The optimized risers eliminated isolated liquid regions and improved feeding. The final solidification zones were confined to the risers and gating system, protecting the load-bearing sections of the crossbeam.
Third, the effects of pouring temperature and pouring speed on ductile iron casting quality were systematically investigated. The lowest gas entrainment occurred at 1400 °C and 10 cm/s, while the lowest shrinkage porosity occurred at 1380 °C and 12 cm/s. The orthogonal experiment and variance analysis showed that pouring speed significantly affected gas entrainment, while pouring temperature significantly affected shrinkage porosity. The optimal combination was pouring speed 11 cm/s, pouring temperature 1380 °C, and mold temperature 20 °C. This process reduced the shrinkage porosity volume to 667.92 mm³, which was 11.74% lower than the initial design.
Fourth, the production trial confirmed the simulation results. The chemical composition was stable, with carbon equivalent and residual magnesium within the specified range. The microstructure consisted of spheroidal graphite, ferrite, and pearlite. The pearlite content exceeded 90%, the nodularity grade was 2, and the graphite size grade was 6 to 7. The mechanical properties at three positions met the requirements of QT800-5. The yield strength ranged from 546 to 562 MPa, the tensile strength ranged from 854 to 891 MPa, and the elongation ranged from 6.0% to 7.6%. Hardness was above 270 HV at all positions.
Fifth, fracture and EDS analysis revealed that the main defect affecting ductility was CaO inclusion, which had a sharp morphology and acted as a crack initiation site. Graphite nodules also initiated cracks, but their effect was less detrimental because cracks propagated along the interface without forming large voids. Future work should focus on inclusion control, melt cleanliness, and optimized inoculation to further improve toughness.
In summary, my research establishes a comprehensive methodology for the design and optimization of ductile iron casting processes for commercial vehicle crossbeams. The method integrates structural analysis, casting simulation, statistical design of experiments, and experimental validation. The optimized ductile iron casting process produces a lightweight, high-strength, and reliable crossbeam that meets the demanding requirements of commercial vehicle applications. The findings provide a practical reference for the development of other large, complex, load-bearing ductile iron castings.
Future work can be extended in several directions. First, fatigue testing and durability analysis under realistic service loads should be performed to evaluate long-term performance. Second, heat treatment such as austempering could be explored to further improve the strength-toughness balance of the ductile iron casting. Third, advanced melt treatment and filtration could be used to reduce oxide inclusions and improve fracture resistance. Fourth, multi-objective optimization algorithms could be coupled with casting simulation to optimize gating and risering more efficiently. Finally, the integration of real-time process monitoring and digital twin technology could further improve quality consistency in industrial production of ductile iron castings.