
In my research, I focused on the quality control challenges encountered in the production of complex thin-walled stainless steel bearing seats. The key to controlling the quality of investment casting products lies in the design of the gating system and the setting of process parameters. For a complex thin-walled stainless steel bearing seat produced by a company, defects such as shrinkage porosity, shrinkage cavity, misrun, and scarring frequently occurred, leading to a low qualified rate. I addressed this problem by combining numerical simulation with intelligent optimization algorithms to optimize the investment casting process. This approach ensured the qualified rate of castings while improving the process yield and production efficiency.
During the filling process, the complex structure of the bearing seat and its thin walls made it prone to misrun. During solidification, isolated liquid regions formed at irregular junctions, and without proper feeding, shrinkage cavities and porosity appeared. Through structural analysis of the thin-walled bearing seat, I determined the pouring position and ingate locations, and designed five casting process schemes, including top and side combined pouring, inclined pouring, and stepped pouring. I then performed numerical simulation analysis of the casting process for these schemes. The filling and solidification processes of different gating system structures were simulated, and internal shrinkage defects were predicted. Among them, Scheme 5, a combined stepped pouring system, achieved the highest process yield, and the simulated shrinkage porosity volume was 0.76 cc. Combined with actual production trials, I analyzed and tested the bearing seats produced by different gating system schemes. The results showed that Scheme 5 had the fewest surface defects such as shrinkage porosity and scarring, and internal inspection revealed the smallest shrinkage porosity volume, making it the optimal scheme. This indicated that the combined stepped pouring system is effective for complex thin-walled bearing seats, providing a reference for the design and optimization of gating systems for similar complex thin-walled castings.
After determining the gating system, I selected four investment casting process parameters as research objects: pouring temperature, pouring speed, mold shell roasting temperature, and mold shell thickness. Through orthogonal experiments, I studied the influence of process parameters on shrinkage porosity and equivalent stress. The mold shell thickness had the greatest influence on the probability of casting defects. I used 25 groups of orthogonal experimental results as sample data to establish a BP neural network, which was optimized using the PSO algorithm. The optimized neural network served as a nonlinear prediction model between process parameters and casting defects. Combined with the GA algorithm for multi-objective optimization, I obtained a process parameter combination that improved the investment casting quality. Using the optimized process parameters, numerical simulation showed that the optimization effect on shrinkage porosity was 44.74%, and the optimization effect on equivalent stress was 2.41%. By controlling the mold shell thickness at about 5 mm, mold shell preheating temperature at about 1148 °C, pouring temperature at about 1619 °C, and pouring speed at about 1.5 kg·s⁻¹, I conducted trial production. Macroscopic inspection and internal testing of the bearing seats showed that casting defects such as surface scarring and internal shrinkage porosity disappeared. This demonstrated that numerical simulation combined with intelligent optimization algorithms can predict casting defects, reduce the probability of defects, and improve the process yield and product quality of investment casting. The concept of full mold casting also played a role in my understanding of pattern removal and mold filling behavior, and I repeatedly considered full mold casting principles when analyzing the gating system. In full mold casting, the pattern is vaporized during pouring, which shares similarities with the lost wax process in terms of pattern removal and mold filling. My work on full mold casting comparisons helped me appreciate the importance of smooth filling and proper venting. I also noted that full mold casting often requires careful control of pouring speed to avoid turbulence, which is directly relevant to my investment casting optimization.
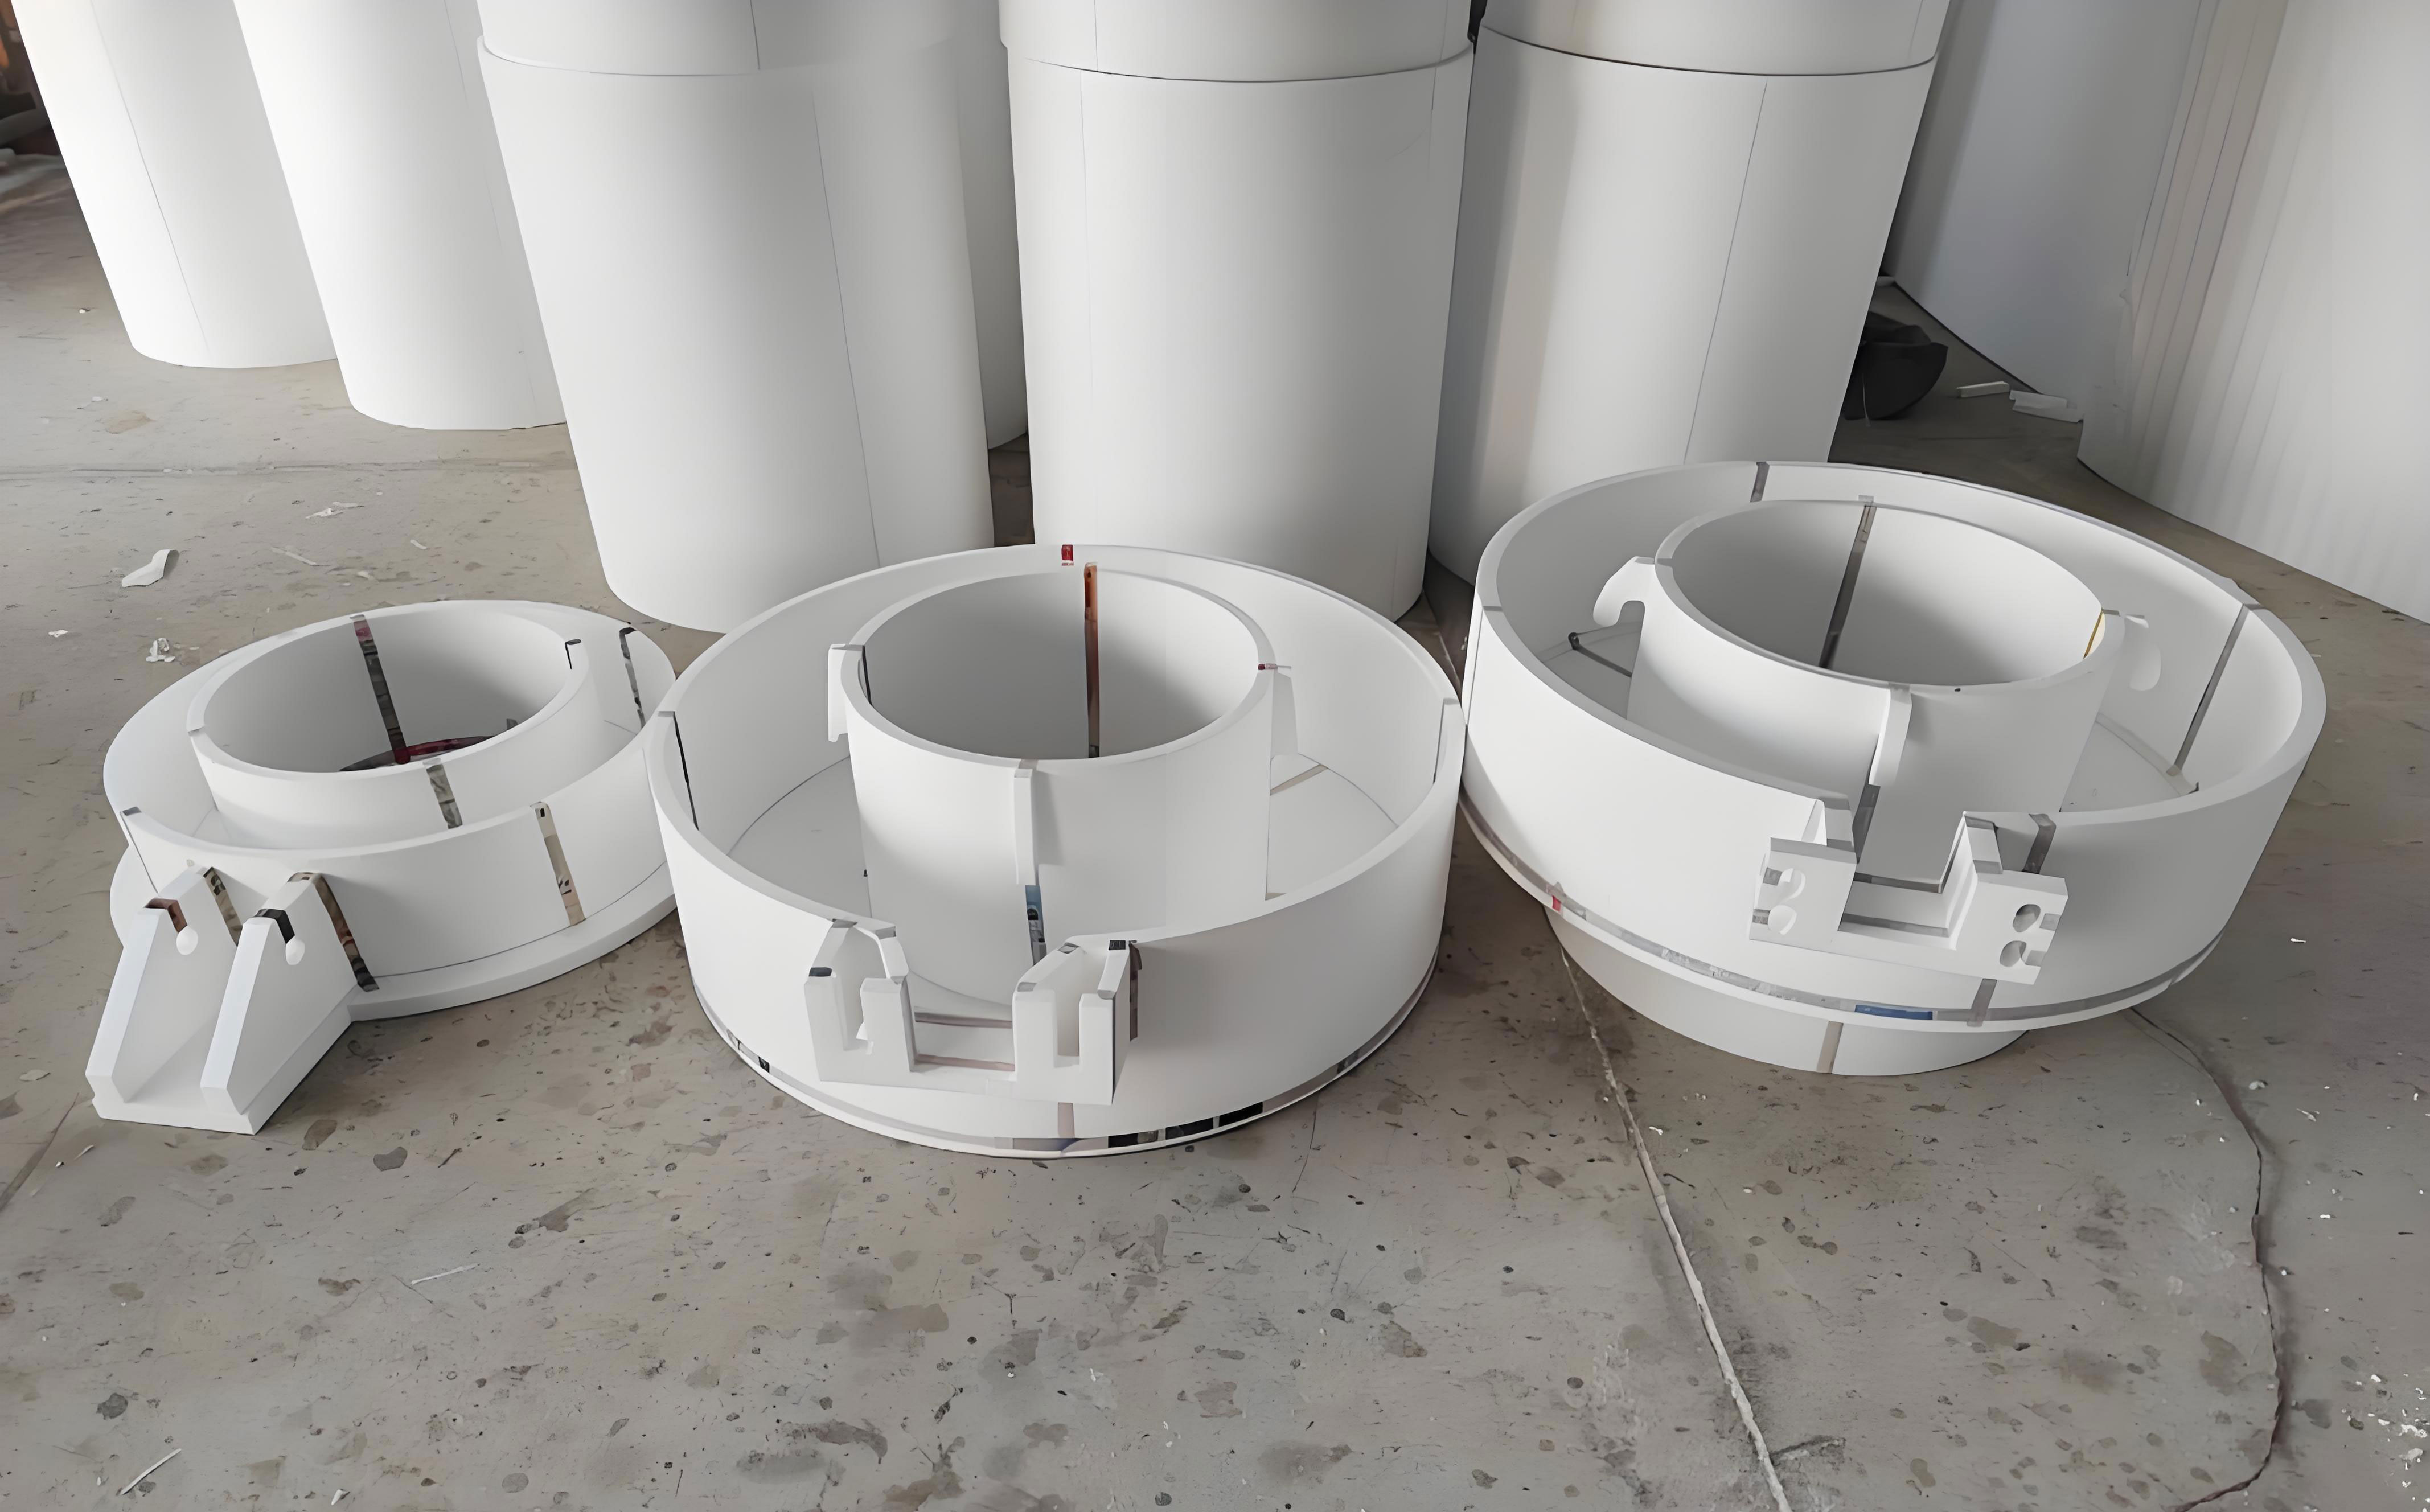
Investment casting, also known as lost wax casting, is a precision casting method. Its main process includes pattern assembly fabrication, shell making, shell drying and roasting, alloy melting and pouring, cooling, shell removal, and post-processing. The full mold casting process, in contrast, uses a foam pattern that is vaporized by the molten metal. Both processes require careful design of the gating system to ensure complete filling and proper feeding. In my study, I applied numerical simulation to visualize the filling and solidification processes, which is essential for defect prediction and process optimization.
Materials and Experimental Methods
The material used in my experiments was 1.4308 stainless steel, equivalent to GX5CrNi19-10. This austenitic stainless steel has good corrosion resistance, high-temperature performance, and excellent mechanical and machining properties. Its chemical composition is listed in Table 1.
| C | Si | Mn | P | S | Cr | Ni | Fe |
|---|---|---|---|---|---|---|---|
| ≤0.07 | ≤1.50 | ≤1.50 | 0.040 | 0.030 | 18.0–20.0 | 8.00–11.0 | Bal. |
The wax pattern material was a recycled medium-temperature wax. Its technical indicators are shown in Table 2.
| Softening point/°C | Drop point/°C | Standard shrinkage | Needle penetration | Ash content | Color |
|---|---|---|---|---|---|
| 79.40–85.00 | 87.70–93.30 | 0.90%–1.00% | 20–30D | <0.02% | Yellow-brown |
For the shell, I used zircon sand for the face coat and mullite sand for the backing layers. The technical indicators are given in Table 3.
| Material | Chemical formula | Chemical nature | Melting point/°C | Refractoriness/°C | Density/(g/cm³) | Thermal expansion coefficient/(1/°C) |
|---|---|---|---|---|---|---|
| Zircon sand | ZrO₂·SiO₂ | Acidic | 2750 | >1825 | 4.5–4.9 | 4.6 × 10⁻⁶ |
| Mullite sand | 3Al₂O₂·2SiO₂ | Neutral | 1810 | >1700 | 3.16 | 4.5 × 10⁻⁶ |
The experimental equipment included a vertical wax injection machine, wax cleaning tank, slurry mixer, automatic sand rain machine, automatic slurry dipping and sanding machine, dewaxing autoclave, roasting furnace, medium-frequency melting furnace, shell shaker, sandblasting machine, X-ray photoelectron spectrometer, X-ray inspection equipment, wire-cut EDM, and metallographic microscope.
Numerical Simulation Theory
For the filling process, I assumed the molten metal to be an incompressible viscous fluid and neglected turbulence. The continuity equation is:
$$\frac{\partial \rho}{\partial t} + \frac{\partial (\rho u)}{\partial x} + \frac{\partial (\rho v)}{\partial y} + \frac{\partial (\rho w)}{\partial z} = 0$$
The Navier-Stokes equations in three directions are:
$$\rho \left( \frac{\partial u}{\partial t} + u \frac{\partial u}{\partial x} + v \frac{\partial u}{\partial y} + w \frac{\partial u}{\partial z} \right) = -\frac{\partial p}{\partial x} + \mu \left( \frac{\partial^2 u}{\partial x^2} + \frac{\partial^2 u}{\partial y^2} + \frac{\partial^2 u}{\partial z^2} \right) + \rho g_x$$
$$\rho \left( \frac{\partial v}{\partial t} + u \frac{\partial v}{\partial x} + v \frac{\partial v}{\partial y} + w \frac{\partial v}{\partial z} \right) = -\frac{\partial p}{\partial y} + \mu \left( \frac{\partial^2 v}{\partial x^2} + \frac{\partial^2 v}{\partial y^2} + \frac{\partial^2 v}{\partial z^2} \right) + \rho g_y$$
$$\rho \left( \frac{\partial w}{\partial t} + u \frac{\partial w}{\partial x} + v \frac{\partial w}{\partial y} + w \frac{\partial w}{\partial z} \right) = -\frac{\partial p}{\partial z} + \mu \left( \frac{\partial^2 w}{\partial x^2} + \frac{\partial^2 w}{\partial y^2} + \frac{\partial^2 w}{\partial z^2} \right) + \rho g_z$$
The energy conservation equation is:
$$\rho C_p \left( \frac{\partial T}{\partial t} + u \frac{\partial T}{\partial x} + v \frac{\partial T}{\partial y} + w \frac{\partial T}{\partial z} \right) = \lambda \left( \frac{\partial^2 T}{\partial x^2} + \frac{\partial^2 T}{\partial y^2} + \frac{\partial^2 T}{\partial z^2} \right) + \rho L \frac{\partial f_s}{\partial t}$$
For solidification, heat conduction follows Fourier’s law:
$$q = -k \frac{\partial T}{\partial x}$$
Heat convection follows Newton’s law:
$$q = \alpha (T_f – T_w)$$
Heat radiation follows the Stefan-Boltzmann law:
$$q = \varepsilon \sigma_0 T_s^4$$
Shrinkage cavity and porosity formation can be described by the volume deficit:
$$V = \frac{1}{2} \left[ \alpha_L (t_L – t_S) + \alpha_{SL} (t_S – t_F) – \alpha_V (t_L – t_F) \right] V_S$$
The Niyama criterion for porosity prediction is:
$$\frac{G}{\sqrt{R}} < K$$
where \(G\) is the local temperature gradient, \(R\) is the cooling rate, and \(K\) is the critical value, typically \(1 \, ^\circ\text{C}^{1/2} \cdot \text{min}^{1/2} \cdot \text{cm}^{-1}\).
Process Scheme Design
The bearing seat has a maximum dimension of 245 mm × 214 mm, with a cylindrical length of 245 mm. The wall thickness is 5–6 mm, and after machining, the end wall thickness is about 3 mm. One side of the square frame has a protruding thin wall of 2.4 mm, and the inner square hollow has a minimum thickness of 1.8 mm. The square frame outline is 196.6 mm × 177.6 mm, with an internal recess and edge wall thickness of 3 mm. The angle between the two side walls is 2°. Reinforcing ribs connect the cylindrical and square sections, with a thickness of 2.5 mm and an angle of 2°. The total mass is 2.2 kg. The full mold casting concept helped me understand the importance of pattern decomposition and assembly, especially for such a complex thin-walled part.
I determined the pouring position and ingate locations based on the structural analysis. The ingates were placed on the thin-walled cylinder and one side of the square frame. I designed five gating system schemes, as summarized in Table 4.
| Scheme | Pouring position | Gating type | Module weight/kg | Process yield/% |
|---|---|---|---|---|
| 1 | Cylinder horizontal, thin plate at bottom | Combined pouring | 9.9 | 44.4 |
| 2 | Cylinder vertical, thin plate on side | Stepped pouring | 11.6 | 37.9 |
| 3 | Cylinder horizontal, thin plate inclined | Inclined pouring | 10.2 | 43.1 |
| 4 | Cylinder horizontal, thin plate at top | Combined pouring | 10.4 | 42.3 |
| 5 | Cylinder vertical, thin plate on side, four parts per mold | Combined stepped pouring | 18.0 | 48.9 |
I calculated the pouring time using:
$$t_J = S \sqrt{G_{\text{part}} \cdot \delta_{\text{min}}}$$
where \(S\) is an empirical coefficient (1.4 for stainless steel), \(G_{\text{part}}\) is the total mass of molten metal, and \(\delta_{\text{min}}\) is the minimum wall thickness. The initial pouring speed was calculated as:
$$v_J = K \frac{L}{\delta_{\text{min}}}$$
where \(K\) is the pouring coefficient (0.05 for top pouring, 0.06 for side pouring, 0.08 for bottom pouring), and \(L\) is the maximum length of the thin wall.
The initial process parameters were: pouring temperature 1620 °C, pouring speed 2 kg·s⁻¹, mold shell preheating temperature 1130 °C, and mold shell thickness 6 mm.
Numerical Simulation of Different Schemes
I imported the 3D models into ProCAST, meshed them, and set the material properties. The solidus temperature of 1.4308 stainless steel was 1386 °C, and the liquidus temperature was 1485 °C. The mold shell was set as refractory mullite. The interface heat transfer coefficient between metal and shell was 500 W/(m²·K). The pouring temperature was 1620 °C, and the shell preheating temperature was 1130 °C.
The filling processes of the five schemes were simulated. Scheme 1 filled the bottom thin wall first, and the metal liquid surface rose evenly. Scheme 2 used dual sprue runners, and the filling was relatively stable. Scheme 3 had an inclined pouring position, and the liquid surface was slightly higher on the two sides. Scheme 4 filled the bottom square frame first, then the cylinder, with some splashing observed. Scheme 5 used four parts per mold, and the liquid surface showed a stepped distribution. All schemes completed filling without premature solidification, indicating reasonable designs.
The solidification processes were also simulated. In all schemes, the thinnest walls solidified first. Isolated liquid regions formed at irregular junctions, especially at the intersection of the cylinder and square frame. The amount of isolated liquid varied among schemes. Scheme 1 had the least isolated liquid, while Scheme 5 had a relatively uniform solidification front due to the combined stepped gating.
The shrinkage porosity defects were predicted. The results are summarized in Table 5.
| Scheme | Number of defect locations | Shrinkage porosity volume/cc |
|---|---|---|
| 1 | 14 | 0.71 |
| 2 | 16 | 0.76 |
| 3 | 15 | 0.76 |
| 4 | 12 | 0.84 |
| 5 | 14 | 0.76 |
Scheme 1 had the smallest shrinkage volume, but Scheme 4 had the fewest defect locations. However, considering the overall process yield and actual production trials, Scheme 5 was selected as the optimal gating system. In the actual trials, Scheme 5 produced the fewest surface defects and the smallest internal shrinkage porosity. The full mold casting principle of smooth filling without turbulence was well reflected in the performance of Scheme 5.
Experimental Verification of Schemes
I fabricated wax patterns, assembled the gating systems, and prepared the shell. The shell making process included face coat, transition layers, and backing layers. Each layer involved dipping, sanding, and drying. The shells were dewaxed in an autoclave and then roasted before pouring. The 1.4308 stainless steel was melted in a medium-frequency furnace. The pouring temperature was about 1620 °C, and the shell preheating temperature was about 1130 °C. After pouring, the castings were cooled, shelled, cut, and sandblasted.
The chemical composition of the poured metal was checked and is shown in Table 6.
| C | Si | Mn | P | S | Cr | Ni | Cu | Mo | Fe |
|---|---|---|---|---|---|---|---|---|---|
| 0.064 | 0.703 | 1.173 | 0.027 | 0.0050 | 18.42 | 8.36 | 0.049 | 0.036 | Bal. |
The macro defects were observed. The main defects were shrinkage cavities and scarring. The defect statistics are shown in Table 7.
| Scheme | Mold type | Defect type | Number of parts | Number of locations |
|---|---|---|---|---|
| 1 | Two parts per mold | Shrinkage porosity | 2 | 2 |
| 1 | Two parts per mold | Scarring | 2 | 5 |
| 2 | Two parts per mold | Shrinkage porosity | 2 | 3 |
| 2 | Two parts per mold | Scarring | 2 | 2 |
| 3 | Two parts per mold | Shrinkage porosity | 2 | 1 |
| 3 | Two parts per mold | Scarring | 2 | 10 |
| 4 | Two parts per mold | Shrinkage porosity | 2 | 2 |
| 4 | Two parts per mold | Scarring | 2 | 0 |
| 5 | Four parts per mold | Shrinkage porosity | 4 | 1 |
| 5 | Four parts per mold | Scarring | 4 | 5 |
X-ray inspection and wire-cut EDM were used to examine internal defects. The results confirmed that Scheme 5 had the fewest internal defects, consistent with the numerical simulation. Therefore, Scheme 5 was chosen as the final gating system.
Orthogonal Experiment for Process Parameter Optimization
After fixing the gating system, I optimized the process parameters. I selected four factors: pouring temperature, pouring speed, mold shell preheating temperature, and mold shell thickness. Each factor had five levels, as shown in Table 8.
| Level | Pouring temperature/°C | Pouring speed/kg·s⁻¹ | Shell preheating temperature/°C | Shell thickness/mm |
|---|---|---|---|---|
| 1 | 1600 | 1.5 | 1110 | 5 |
| 2 | 1610 | 1.75 | 1120 | 5.5 |
| 3 | 1620 | 2 | 1130 | 6 |
| 4 | 1630 | 2.25 | 1140 | 6.5 |
| 5 | 1640 | 2.5 | 1150 | 7 |
I used an \(L_{25}(5^4)\) orthogonal array and obtained 25 simulation results. The results are shown in Table 9.
| No. | Pouring temperature/°C | Pouring speed/kg·s⁻¹ | Shell preheating temperature/°C | Shell thickness/mm | Shrinkage porosity/cc | Equivalent stress/MPa |
|---|---|---|---|---|---|---|
| 1 | 1600 | 1.5 | 1110 | 5 | 0.81 | 570.80 |
| 2 | 1600 | 1.75 | 1130 | 6.5 | 1.11 | 406.03 |
| 3 | 1600 | 2 | 1150 | 5.5 | 0.68 | 485.33 |
| 4 | 1600 | 2.25 | 1120 | 7 | 1.01 | 387.78 |
| 5 | 1600 | 2.5 | 1140 | 6 | 1.06 | 452.99 |
| 6 | 1610 | 1.5 | 1150 | 6.5 | 0.86 | 408.64 |
| 7 | 1610 | 1.75 | 1120 | 5.5 | 0.83 | 513.65 |
| 8 | 1610 | 2 | 1140 | 7 | 0.95 | 372.29 |
| 9 | 1610 | 2.25 | 1110 | 6 | 1.01 | 473.41 |
| 10 | 1610 | 2.5 | 1130 | 5 | 0.68 | 559.18 |
| 11 | 1620 | 1.5 | 1140 | 5.5 | 0.66 | 491.83 |
| 12 | 1620 | 1.75 | 1110 | 7 | 1.06 | 400.16 |
| 13 | 1620 | 2 | 1130 | 6 | 0.76 | 459.94 |
| 14 | 1620 | 2.25 | 1150 | 5 | 0.53 | 569.59 |
| 15 | 1620 | 2.5 | 1120 | 6.5 | 0.84 | 415.10 |
| 16 | 1630 | 1.5 | 1130 | 7 | 0.82 | 399.75 |
| 17 | 1630 | 1.75 | 1150 | 6 | 0.66 | 478.66 |
| 18 | 1630 | 2 | 1120 | 5 | 0.63 | 557.82 |
| 19 | 1630 | 2.25 | 1140 | 6.5 | 0.65 | 420.54 |
| 20 | 1630 | 2.5 | 1110 | 5.5 | 0.87 | 513.04 |
| 21 | 1640 | 1.5 | 1120 | 6 | 0.71 | 488.42 |
| 22 | 1640 | 1.75 | 1140 | 5 | 0.50 | 564.70 |
| 23 | 1640 | 2 | 1110 | 6.5 | 0.82 | 426.47 |
| 24 | 1640 | 2.25 | 1130 | 5.5 | 0.61 | 507.49 |
| 25 | 1640 | 2.5 | 1150 | 7 | 0.68 | 390.18 |
I performed range analysis to determine the influence order of factors. The results are shown in Table 10.
| Factor | Pouring temperature | Pouring speed | Shell preheating temperature | Shell thickness |
|---|---|---|---|---|
| K1 | 4.66 | 3.85 | 4.57 | 3.14 |
| K2 | 4.33 | 4.16 | 4.01 | 3.65 |
| K3 | 3.85 | 3.83 | 3.97 | 4.20 |
| K4 | 3.63 | 3.81 | 3.81 | 4.27 |
| K5 | 3.31 | 4.12 | 3.41 | 4.52 |
| R1 | 1.35 | 0.35 | 1.16 | 1.38 |
| k1 | 2302.93 | 2359.44 | 2383.87 | 2822.09 |
| k2 | 2327.18 | 2363.20 | 2362.77 | 2511.34 |
| k3 | 2336.63 | 2301.85 | 2332.39 | 2353.42 |
| k4 | 2369.80 | 2358.80 | 2302.35 | 2076.78 |
| k5 | 2377.25 | 2330.49 | 2332.41 | 1950.16 |
| R2 | 74.32 | 61.35 | 81.52 | 871.93 |
For shrinkage porosity, the influence order was: shell thickness > pouring temperature > shell preheating temperature > pouring speed. For equivalent stress, the influence order was: shell thickness > shell preheating temperature > pouring temperature > pouring speed. The shell thickness had the greatest influence on both defects. This finding is consistent with my observations in full mold casting, where mold strength and permeability are critical.
Intelligent Optimization Using PSO-BP and GA
I established a BP neural network with four input nodes (pouring temperature, pouring speed, shell preheating temperature, shell thickness) and two output nodes (shrinkage porosity volume, equivalent stress). The hidden layer had 9 nodes, determined by the empirical formula:
$$M = \sqrt{m + n} + a$$
where \(m\) is the number of input nodes, \(n\) is the number of output nodes, and \(a \in [0, 10]\). The transfer function from input to hidden layer was Sigmoid, and from hidden to output was purelin. The training algorithm was Levenberg-Marquardt. The maximum training epochs were 1000, learning rate 0.1, and training accuracy 0.0001.
I used the PSO algorithm to optimize the initial weights and thresholds of the BP neural network. The PSO parameters were: maximum iterations 100, population size 50, particle length 44, learning factor 1.5, inertia weight 0.8, position range [-0.7, 0.7], and velocity range [-10, 10]. I also compared with a GA-optimized BP network. The PSO-optimized network had lower prediction error and converged faster. The fitness comparison is shown in Table 11.
| Algorithm | Convergence generation | Final fitness |
|---|---|---|
| PSO | 40 | 0.012 |
| GA | 55 | 0.028 |
After obtaining the PSO-BP prediction model, I used the GA algorithm for multi-objective optimization. The optimization model was:
$$\min f = f(net(x_1, x_2, x_3, x_4))$$
$$\text{subject to } 1600 \le x_1 \le 1640, \, 1.5 \le x_2 \le 2.5, \, 1110 \le x_3 \le 1150, \, 5 \le x_4 \le 7$$
I used a weight coefficient transformation method to convert the two objectives into a single objective. The weight for shrinkage porosity was \(w_1\), and for equivalent stress was \(w_2\), with \(w_1 + w_2 = 1\). I tested different weight combinations. The optimization results are shown in Table 12.
| \(w_1\) | \(w_2\) | Pouring temperature/°C | Pouring speed/kg·s⁻¹ | Shell preheating temperature/°C | Shell thickness/mm | Shrinkage porosity/cc | Optimization effect | Equivalent stress/MPa | Optimization effect |
|---|---|---|---|---|---|---|---|---|---|
| 0.5 | 0.5 | 1639.65 | 2.41 | 1122.00 | 6.97 | 0.68 | 10.53% | 393.11 | 14.53% |
| 0.6 | 0.4 | 1603.05 | 2.15 | 1148.89 | 5.01 | 0.54 | 28.95% | 436.62 | 5.07% |
| 0.7 | 0.3 | 1601.00 | 2.15 | 1149.96 | 5.01 | 0.49 | 35.53% | 439.84 | 4.37% |
| 0.8 | 0.2 | 1619.26 | 1.53 | 1148.70 | 5.05 | 0.42 | 44.74% | 448.86 | 2.41% |
| 0.9 | 0.1 | 1618.47 | 2.29 | 1136.91 | 5.03 | 0.58 | 23.68% | 434.85 | 5.46% |
Considering that shrinkage porosity is the main cause of rejection, I selected the weight combination with \(w_1 = 0.8\) and \(w_2 = 0.2\), which gave a 44.74% optimization effect on shrinkage porosity. The optimal parameters were: pouring temperature 1619.26 °C, pouring speed 1.53 kg·s⁻¹, shell preheating temperature 1148.70 °C, and shell thickness 5.05 mm.
Numerical Simulation of the Optimized Process
I simulated the optimized process. The filling process was smoother due to the lower pouring speed. The higher shell preheating temperature improved the thermal insulation. The thinner shell improved permeability. The shrinkage porosity volume decreased to 0.42 cc, a reduction of 44.74%. The equivalent stress decreased to 448.86 MPa, a reduction of 2.41%. The defect distribution comparison is shown in Table 13.
| Indicator | Original process | Optimized process | Optimization effect |
|---|---|---|---|
| Shrinkage porosity/cc | 0.76 | 0.42 | 44.74% |
| Equivalent stress/MPa | 459.94 | 448.86 | 2.41% |
Experimental Verification of the Optimized Process
I conducted trial production using the optimized parameters: pouring temperature about 1619 °C, pouring speed about 1.5 kg·s⁻¹, shell preheating temperature about 1148 °C, and shell thickness about 5 mm. After post-processing, the castings showed no macroscopic shrinkage porosity, cold shuts, or obvious deformation. Acid pickling did not reveal any yellowing, indicating no surface shrinkage. The flatness and coaxiality requirements were met. X-ray inspection showed no obvious internal shrinkage defects. Wire-cut EDM confirmed that shrinkage porosity was essentially eliminated. The full mold casting principle of smooth filling was again validated in the optimized investment casting process.
Conclusions
In my study, I successfully optimized the investment casting process for a complex thin-walled stainless steel bearing seat. The main conclusions are as follows:
1. Different gating system structures affected the location, number, and size of shrinkage defects. The combined stepped pouring system (Scheme 5) with four parts per mold achieved the highest process yield of 48.9% and the fewest defects. Top pouring, bottom pouring, and inclined pouring were less effective for irregular thin-walled parts.
2. From the orthogonal experiment, the influence order on shrinkage porosity was: shell thickness > pouring temperature > shell preheating temperature > pouring speed. For equivalent stress, the order was: shell thickness > shell preheating temperature > pouring temperature > pouring speed. Shell thickness had the greatest impact on casting quality.
3. The PSO-optimized BP neural network accurately predicted the relationship between process parameters and casting defects. Combined with GA multi-objective optimization, the optimal parameters were: pouring temperature 1619.26 °C, pouring speed 1.53 kg·s⁻¹, shell preheating temperature 1148.70 °C, and shell thickness 5.05 mm.
4. Using the optimized parameters, the shrinkage porosity volume was reduced by 44.74%, and the equivalent stress was reduced by 2.41%. Experimental verification showed that casting defects disappeared, and the product met the flatness and coaxiality requirements. This demonstrates that numerical simulation combined with intelligent optimization algorithms can effectively improve the quality and yield of investment casting. The full mold casting concept of smooth filling and proper venting also provided valuable insights for my optimization work.
Overall, my research provides a practical and efficient approach for controlling the quality of complex thin-walled stainless steel castings in investment casting, and it highlights the importance of integrating numerical simulation with intelligent optimization algorithms. The findings can serve as a reference for similar complex thin-walled castings in industrial production.