
In this study, I examine the entire wax injection molding route used in lost wax casting, with particular attention to the coupled thermal, rheological, viscoelastic, and dimensional phenomena that control wax pattern accuracy. In lost wax casting, the wax pattern is not a simple temporary shape. It is the first physical carrier of the geometry that will be reproduced in ceramic shell and finally in metal. Therefore, every dimensional error generated during wax injection, in-mold cooling, demolding, and post-demolding storage can propagate through the lost wax casting chain and influence the final casting. My first-person objective is to build a numerical route that can describe the stress and deformation history of the wax pattern from filling and packing to external storage, and then to use that route for process optimization in lost wax casting.
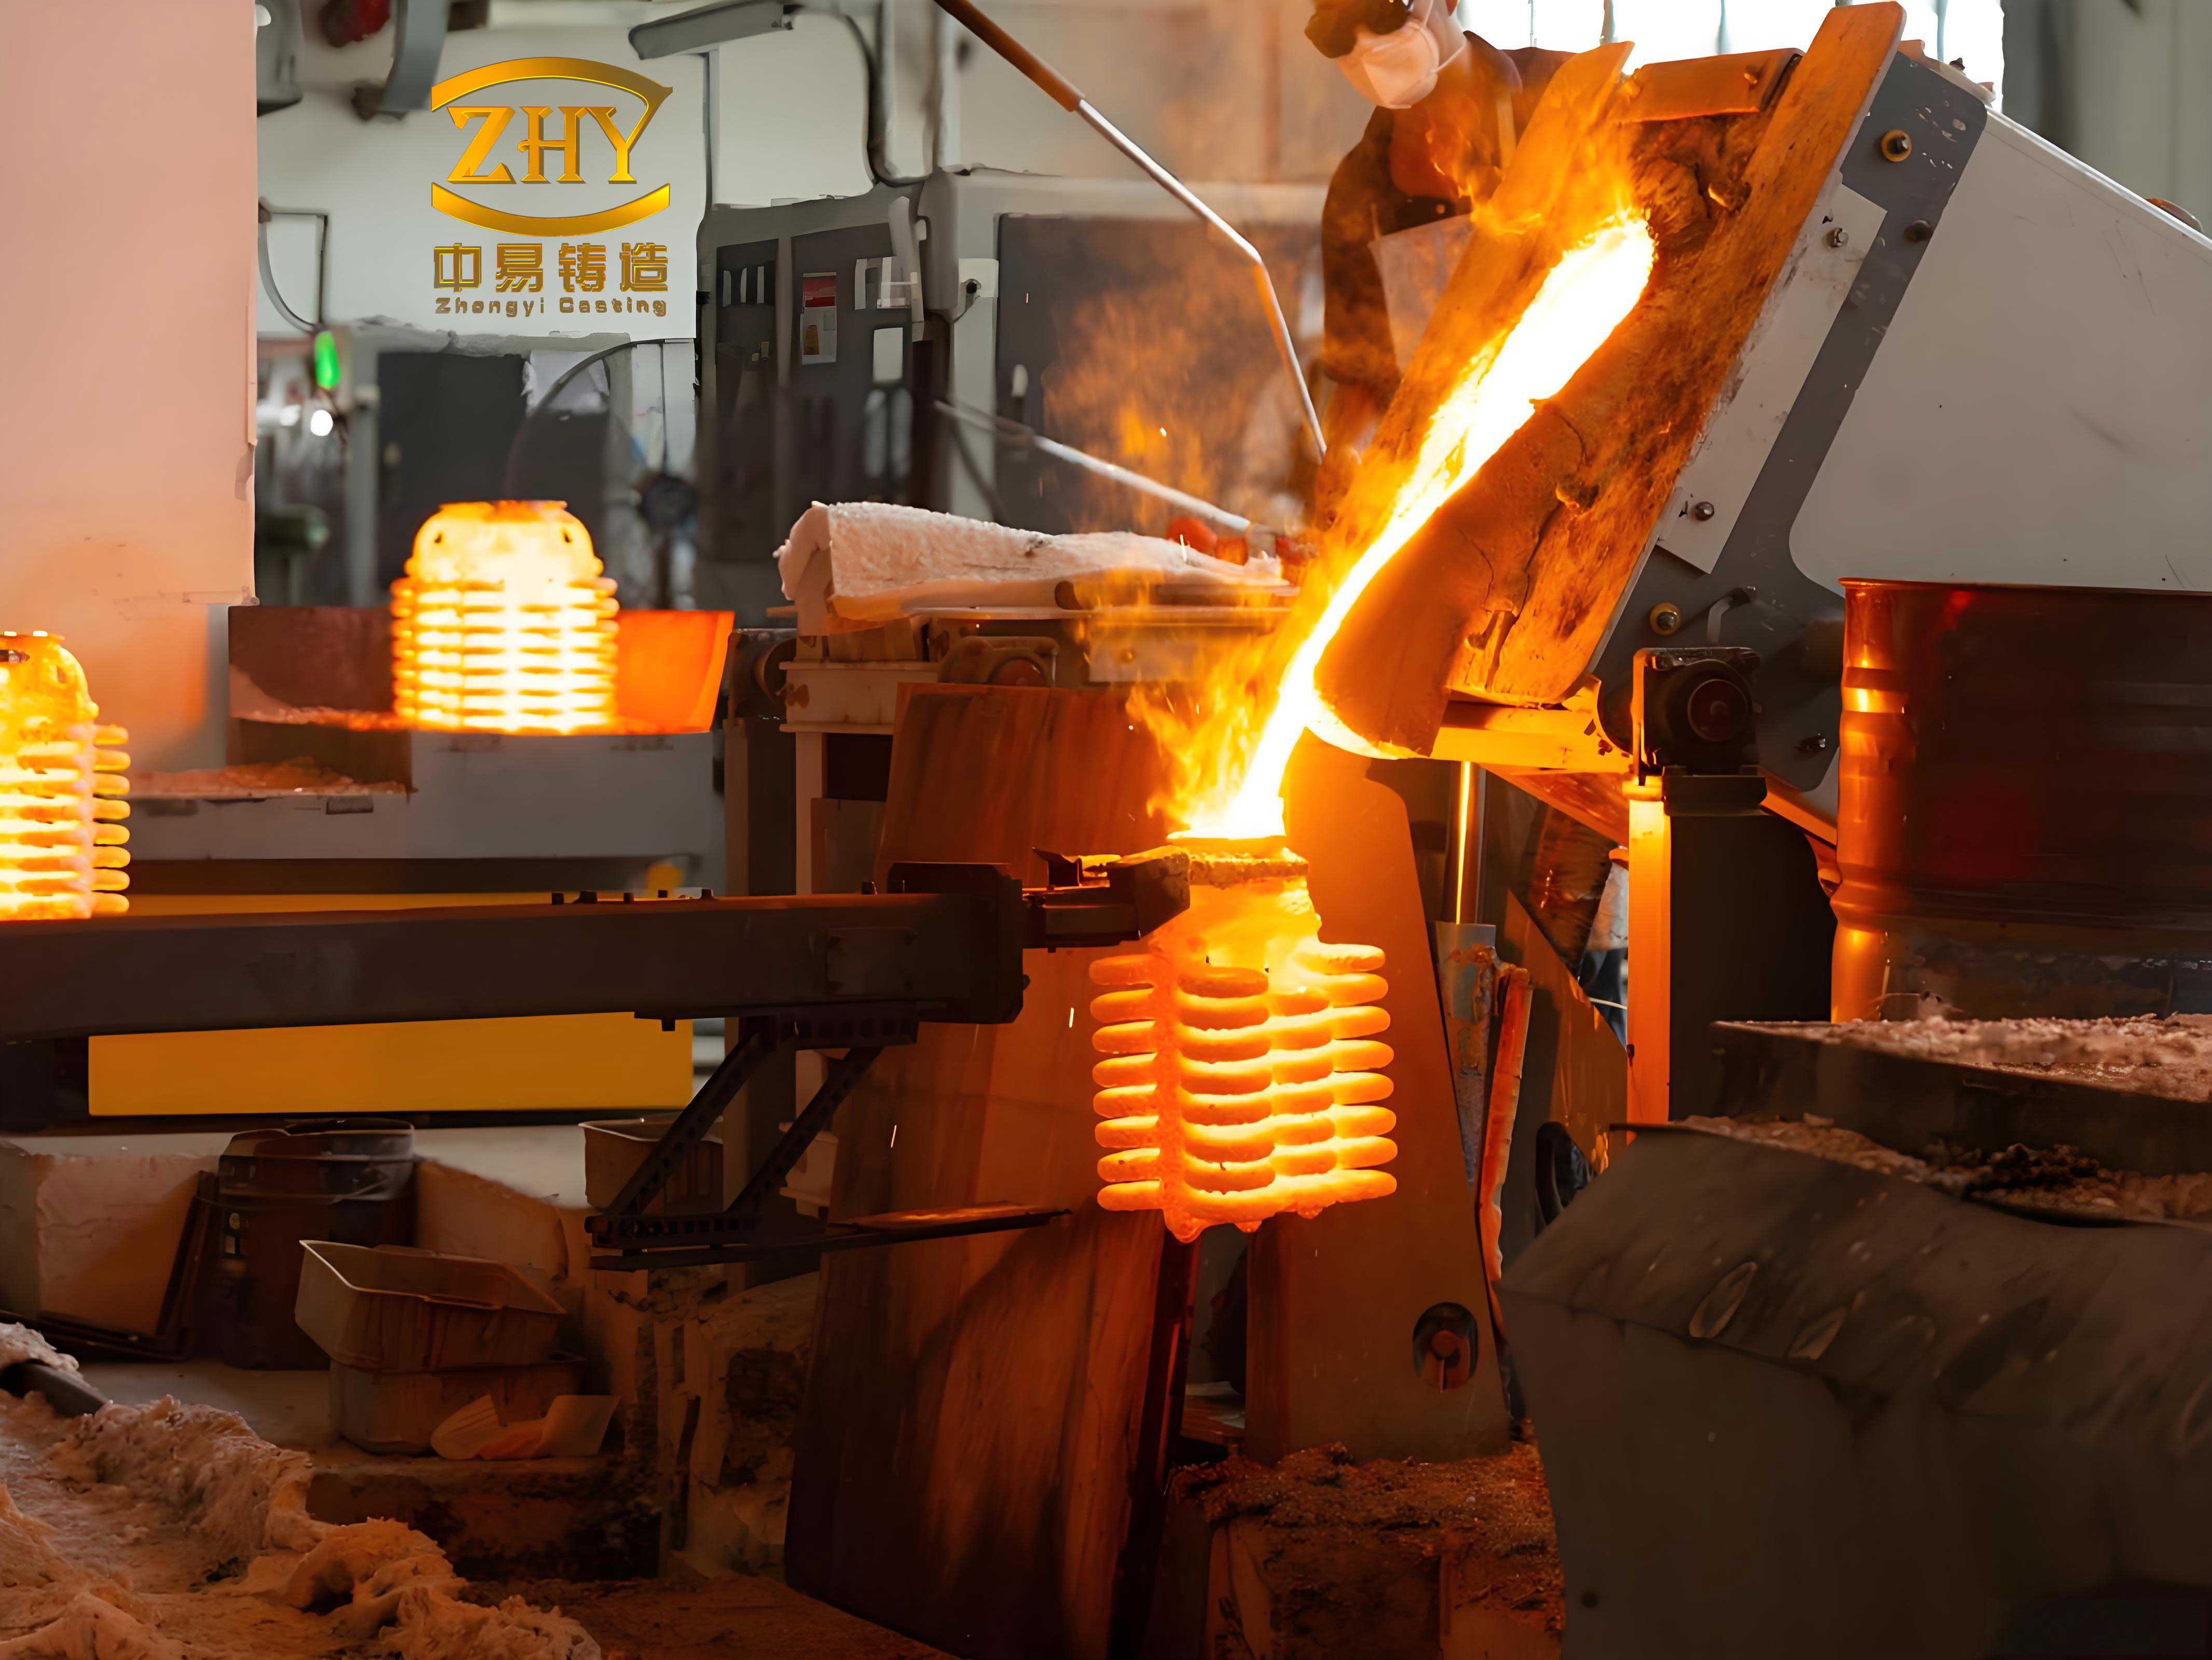
The motivation is straightforward. Lost wax casting is widely used for aerospace, automotive, medical, and energy components because it can provide high dimensional precision, good surface quality, and complex thin-walled geometry. However, the process chain is long. It includes wax injection, wax assembly, shell building, dewaxing, shell firing, alloy pouring, knockout, cutting, heat treatment, and finishing. Each stage introduces dimensional variation. Among these stages, wax pattern preparation is especially important because the pattern defines the cavity in the ceramic shell. If the wax pattern distorts, the shell inherits that distortion, and the final casting inherits it again. Thus, accurate simulation of wax injection molding in lost wax casting is a necessary step toward precision control.
I focus on a typical three-way pipe wax pattern and on K512-type wax, a material used in precision lost wax casting because of its low and stable linear shrinkage, good flowability, low ash content, and reusability. The full route I simulate contains four connected stages: filling and packing, in-mold cooling, demolding stress release, and external storage deformation. The first stage is computed in a mold-filling simulation environment, and the remaining stages are computed in a finite element environment. The link between them is the temperature field, pressure history, residual stress state, and displacement state at the end of packing. This combined route allows me to represent the viscoelastic behavior of the wax rather than treating it as a purely elastic or purely thermal material.
1. Theoretical Models for Lost Wax Casting Wax Injection
The numerical description of lost wax casting wax injection requires at least three families of constitutive relations. The first family describes the viscosity of molten wax during filling and packing. The second family describes the pressure-volume-temperature behavior of wax during cooling and shrinkage. The third family describes the viscoelastic stress relaxation and creep of the solidified wax after the melt has cooled below its transition range.
1.1 Viscosity Model
For the filling and packing analysis, I use the Cross-WLF viscosity model. This model is suitable because the apparent viscosity of wax depends on shear rate, temperature, and pressure. During injection into a complex mold, the shear rate and temperature vary strongly from the gate to the flow front. The Cross-WLF model captures shear thinning and the zero-shear plateau, which is important for predicting filling patterns, pressure demand, and packing compensation.
$$\eta = \frac{\eta_0}{1 + \left(\frac{\eta_0 \dot{\gamma}}{\tau^*}\right)^{1-n}}$$
Here, \(\eta\) is the melt viscosity, \(\eta_0\) is the zero-shear viscosity, \(\dot{\gamma}\) is the shear rate, \(\tau^*\) is the critical stress at the transition to shear thinning, and \(n\) is the power-law index. The zero-shear viscosity is temperature and pressure dependent:
$$\eta_0 = D_1 \exp\left[-\frac{A_1(T-T^*)}{A_2+(T-T^*)}\right]$$
The glass transition reference temperature is expressed as:
$$T^* = D_2 + D_3 p$$
The pressure coefficient in the denominator is:
$$A_2 = \tilde{A}_2 + D_3 p$$
Table 1 lists the fitted Cross-WLF coefficients for the K512-type wax used in my lost wax casting study. These coefficients were obtained from rheological measurements at several temperatures and shear rates. The fitted behavior shows that the wax is strongly shear thinning at high shear rate and strongly temperature sensitive near the injection range.
| Cross-WLF parameter | Value | Unit |
|---|---|---|
| \(n\) | 0.3691 | – |
| \(\tau^*\) | 0.427887 | Pa |
| \(D_1\) | \(2.18\times 10^{36}\) | Pa·s |
| \(D_2\) | 263.15 | K |
| \(D_3\) | 0 | K/Pa |
| \(A_1\) | 123.92 | – |
| \(A_2\) | 51.6 | K |
1.2 Pressure-Volume-Temperature Model
Shrinkage in lost wax casting begins as soon as the wax enters the cavity and continues after demolding. To predict volumetric shrinkage, I use the modified dual-domain Tait equation. This equation describes the specific volume of the wax as a function of temperature and pressure, and it separates the melt domain from the solid domain through a transition temperature.
$$V(T,p)=V_0(T)\left\{1-C\ln\left[1+\frac{p}{B(T)}\right]\right\}+V_1(T,p)$$
For the solid domain, when \(T < b_5 + b_6 p\), the terms are:
$$
\begin{aligned}
V_0 &= b_{1s} + b_{2s}(T-b_5),\\
B(T) &= b_{3s}\exp\left[-b_{4s}(T-b_5)\right],\\
V_1 &= b_7\exp\left[b_8(T-b_5)-b_9p\right].
\end{aligned}
$$
For the melt domain, when \(T > b_5 + b_6 p\), the terms are:
$$
\begin{aligned}
V_0 &= b_{1m} + b_{2m}(T-b_5),\\
B(T) &= b_{3m}\exp\left[-b_{4m}(T-b_5)\right],\\
V_1 &= 0.
\end{aligned}
$$
The isothermal compressibility derived from the Tait equation is:
$$\kappa_T = -\frac{1}{V}\left(\frac{\partial V}{\partial p}\right)_T = \frac{C}{(p+B)\left[1-C\ln\left(1+\frac{p}{B}\right)\right]}$$
The linear thermal expansion coefficient can be expressed as:
$$\alpha = \frac{1}{3}\frac{1}{V}\left(\frac{\partial V}{\partial T}\right)_p = \frac{1}{3}\left(\frac{b_2}{V_0}-p\kappa_T b_4\right)$$
Table 2 gives the fitted Tait coefficients. I used isobaric cooling measurements at several pressures and temperatures to fit both domains. The coefficient of determination for both domains exceeded 0.99, which indicates that the modified dual-domain Tait equation captures the volumetric behavior of the wax with sufficient accuracy for lost wax casting simulation.
| Tait parameter | Value | Unit |
|---|---|---|
| \(b_{1m}\) | 0.00114 | m³/kg |
| \(b_{2m}\) | \(1.372\times 10^{-6}\) | m³/(kg·K) |
| \(b_{3m}\) | \(6.4005\times 10^{7}\) | Pa |
| \(b_{4m}\) | 0.1685 | 1/K |
| \(b_{1s}\) | 0.001141 | m³/kg |
| \(b_{2s}\) | \(3.478\times 10^{-6}\) | m³/(kg·K) |
| \(b_{3s}\) | \(3.9838\times 10^{7}\) | Pa |
| \(b_{4s}\) | 0.0296 | 1/K |
| \(b_5\) | 324.15 | K |
| \(b_6\) | \(5\times 10^{-7}\) | K/Pa |
| \(b_7\) | 0 | m³/kg |
| \(b_8\) | 0 | 1/K |
| \(b_9\) | 0 | 1/Pa |
1.3 Viscoelastic Model
After the wax has cooled sufficiently, its behavior cannot be represented only by viscosity or elasticity. It exhibits viscoelasticity. I therefore use a generalized Maxwell model to describe the stress relaxation and creep of the wax pattern. The model consists of a long-term elastic spring and several Maxwell branches in parallel. Each Maxwell branch contains a spring and a dashpot and contributes one relaxation time and one modulus weight.
$$\sigma(t)=\int_{-\infty}^{t} G(\xi-\xi’)\frac{\partial e_{ij}(t)}{\partial t}dt+\delta_{ij}\int_{-\infty}^{t} K(\xi-\xi’)\frac{\partial(\varepsilon_m-\varepsilon_{th})}{\partial t}dt$$
The reduced time is defined as:
$$\xi=\int_0^t \frac{1}{\alpha_T}d\lambda$$
The shear relaxation modulus is represented as:
$$G(t)=G_\infty+\sum_{i=1}^{n}G_i\exp\left(-\frac{t}{\tau_i}\right)$$
The bulk relaxation modulus is represented as:
$$K(t)=K_\infty+\sum_{i=1}^{n}K_i\exp\left(-\frac{t}{\tau_i}\right)$$
In the finite element implementation, I assume that the bulk relaxation modulus is nearly constant during the storage stage, while the shear modulus relaxes according to the generalized Maxwell spectrum. This assumption is common for polymers and waxes when volumetric deformation is dominated by thermal contraction rather than by viscoelastic bulk flow.
To obtain the relaxation spectrum, I measured the dynamic storage modulus and loss modulus over a range of temperatures. I then applied the time-temperature superposition principle. The shift factor was fitted with the Arrhenius equation:
$$\alpha_T=\exp\left[\frac{E_a}{R}\left(\frac{1}{T}-\frac{1}{T_0}\right)\right]$$
Table 3 lists the normalized relaxation spectrum obtained from the master curves. The spectrum contains fifteen Maxwell branches. The fit gave a coefficient of determination of 0.999 for the storage modulus and a good overall fit for the loss modulus. This spectrum is used in all viscoelastic calculations reported below.
| Branch | \(g_i\) | \(k_i\) | \(\tau_i\) |
|---|---|---|---|
| 1 | 0.249872 | 0 | \(3.05\times 10^{-6}\) |
| 2 | 0.108686 | 0 | \(4.17\times 10^{-5}\) |
| 3 | 0.100223 | 0 | \(4.26\times 10^{-5}\) |
| 4 | 0.075527 | 0 | 0.000302 |
| 5 | 0.048213 | 0 | 0.000635 |
| 6 | 0.043825 | 0 | 0.00132 |
| 7 | 0.070928 | 0 | 0.005115 |
| 8 | 0.04595 | 0 | 0.025809 |
| 9 | 0.033264 | 0 | 0.083786 |
| 10 | 0.037807 | 0 | 0.480111 |
| 11 | 0.004711 | 0 | 1.55232 |
| 12 | 0.003099 | 0 | 2.2558 |
| 13 | 0.037882 | 0 | 25.5829 |
| 14 | 0.04011 | 0 | 10176.7 |
| 15 | 0.000997 | 0 | 277165 |
1.4 Thermal Properties
The thermal properties of wax differ significantly from those of metals. The thermal conductivity is low, and the specific heat varies with temperature. I measured the thermal conductivity in both solid and liquid states and measured the specific heat from the solid region into the melt region. These data are required for transient heat transfer during filling, packing, and cooling. The transition temperature of the wax is about 49 °C, which is important because it determines when the material can be treated as solidified in the simulation and when the relaxation spectrum becomes active. Table 4 summarizes the thermal and physical data used in the lost wax casting simulation.
| Property | Value or range | Unit |
|---|---|---|
| Transition temperature | 49 | °C |
| Thermal conductivity, solid | Measured temperature dependent | W/(m·K) |
| Thermal conductivity, liquid | Measured temperature dependent | W/(m·K) |
| Specific heat capacity | 30 to 70 | °C measurement range |
| Poisson ratio | 0.47 | – |
| Linear shrinkage | 0.9 to 1.1 | % |
| Ash content | 0.022 | % |
| Needle penetration | 7 | DMM |
2. Combined Simulation Workflow for Lost Wax Casting
The full simulation workflow I constructed contains four computational stages. First, I simulate filling and packing in a mold-filling solver. Second, I transfer the resulting temperature and pressure states into a finite element solver for in-mold cooling. Third, I release the mold constraints and compute the demolding stress redistribution. Fourth, I compute the external storage deformation under gravity and room-temperature relaxation. This staged approach avoids treating the entire process as a single monolithic thermo-mechanical problem, which would be difficult to converge and expensive to run for a full lost wax casting pattern.
2.1 Filling and Packing Stage
For filling and packing, I use a three-dimensional mesh of the wax pattern and a gate location. The injection conditions for the baseline three-way pipe pattern are given in Table 5. The melt enters the cavity, fills the thin and thick sections, and then packing pressure is applied to compensate for shrinkage. The filling pattern is strongly influenced by the high viscosity of the wax and by the non-isothermal mold wall. I checked the flow front temperature and the pressure at the velocity-to-pressure switchover point. The flow front temperature varied only slightly across the cavity, which indicates that the filling pattern was stable.
| Injection parameter | Value | Unit |
|---|---|---|
| Wax injection temperature | 55 | °C |
| Mold temperature | 22 | °C |
| Filling time | 5.5 | s |
| Packing pressure | 1.5 | MPa |
| Packing time | 40 | s |
| In-mold cooling time | 300 | s |
I also performed an off-center injection experiment to validate the filling simulation. In the experiment, the mold was injected for a controlled short time without packing, and the partially filled wax pattern was removed and allowed to freeze. The observed flow front shape was compared with the simulated flow front. The simulation reproduced the fountain flow behavior and the slower advance on the outer side of the pipe. This validation gave me confidence that the flow field used as the starting point for the stress analysis was reasonable.
2.2 In-Mold Cooling Stage
After packing, the wax remains inside the mold and continues to cool. During this stage, the mold constrains the wax, so the pattern cannot warp freely. The main deformation is volumetric shrinkage, and the main mechanical process is stress relaxation. I compute the temperature field first and then use it as an input to the stress analysis. This sequential thermal-stress coupling is efficient and stable. The mold is treated as a rigid body because its thermal expansion is much smaller than that of the wax. The contact between wax and mold is defined as hard contact in the normal direction.
I compared an elastic model and a viscoelastic model for the in-mold cooling stage. In the elastic model, all thermal stress is retained. In the viscoelastic model, a significant fraction of the thermal stress relaxes during cooling. The difference is large. The maximum stress in the viscoelastic case is much lower than that in the elastic case. Because the wax is constrained by the mold, the displacement difference between the two models before demolding is not as large as the stress difference, but the stress state that remains at demolding is very different. This difference controls the subsequent warpage.
| Model | Maximum stress after cooling | Maximum displacement before demolding | Relative stress level |
|---|---|---|---|
| Elastic | High | Constrained by mold | 1.00 |
| Viscoelastic | About 30% lower than elastic due to relaxation | Similar before demolding | About 0.70 |
2.3 Demolding Stage
Demolding is a short but critical stage in lost wax casting. When the mold constraints are removed, the residual stress redistributes almost immediately. I model this stage as a free deformation step with a duration of 1 s. Because the duration is short, creep and relaxation during demolding are small compared with the instantaneous stress release, so I use an elastic model for this step. The stress and displacement fields change very quickly. The maximum stress drops sharply within the first fraction of a second, and the displacement field also redistributes almost instantaneously.
I compared the warpage after demolding for the elastic and viscoelastic in-mold cooling models. The elastic model predicts a maximum deformation of 1.527 mm. The viscoelastic model predicts a maximum deformation of 1.279 mm. Thus, ignoring stress relaxation in the in-mold cooling stage overestimates the demolding warpage by about 19%. This result shows that viscoelastic relaxation must be included if the goal is to predict accurate wax pattern dimensions in lost wax casting.
| In-mold cooling model | Maximum deformation after demolding | Difference |
|---|---|---|
| Elastic | 1.527 mm | Reference |
| Viscoelastic | 1.279 mm | About 19% lower |
2.4 Storage Stage
After demolding, the wax pattern is stored in a controlled environment until its dimensions become stable. During storage, the pattern is no longer constrained by the mold, but it is still affected by gravity, contact with the supporting surface, and its own residual stress field. The temperature is still above room temperature at the beginning of storage, so the pattern continues to cool. After it reaches room temperature, viscoelastic relaxation and creep continue until the dimensions approach a stable value. I simulate 24 h of storage. The pattern is placed horizontally on a flat support. The deformation is computed with the generalized Maxwell model and the measured relaxation spectrum.
For the three-way pipe pattern, the key dimensions after 24 h are compared with experimental measurements in Table 6. The maximum deviation is 0.30 mm, and most deviations are below 0.25 mm. This agreement supports the validity of the combined simulation route for lost wax casting wax patterns.
| Feature | Mold dimension (mm) | Measured dimension (mm) | Simulated dimension (mm) | Deviation (mm) |
|---|---|---|---|---|
| \(X_{AE1}\) | 170.5 | 168.62 | 168.50 | 0.12 |
| \(X_{AE2}\) | 170.5 | 168.25 | 168.15 | 0.10 |
| \(Y_{A12}\) | 117 | 115.53 | 115.29 | 0.24 |
| \(Z_{B12}\) | 117 | 115.28 | 114.98 | 0.30 |
| \(X_{C12}\) | 95 | 93.65 | 93.49 | 0.16 |
| \(Z_{D12}\) | 95 | 93.67 | 93.54 | 0.13 |
3. Full-Process Deformation Behavior in Lost Wax Casting
The full-process simulation reveals that the deformation of the wax pattern is not evenly distributed among the stages. For the three-way pipe pattern, the in-mold cooling stage contributes about 35% of the total deformation, the demolding stage contributes about 40%, and the storage stage contributes about 25%. More than 98% of the final deformation occurs within the first 9 h after demolding. This means that the early storage period is the most important period for dimensional control in lost wax casting. If the pattern is measured immediately after demolding, or if it is moved too soon, the dimensions may still change significantly.
| Stage | Deformation contribution | Characteristic behavior |
|---|---|---|
| In-mold cooling | About 35% | Constrained shrinkage and stress relaxation |
| Demolding | About 40% | Rapid stress release and displacement redistribution |
| External storage | About 25% | Viscoelastic cooling, creep, and relaxation |
I tracked several key points on the three-way pipe pattern. The points on the long pipe and short pipe were used to define distances along the coordinate axes. The difference between certain points represents warpage, while the distance between other points represents shrinkage. The evolution of these quantities shows that the pattern tends to contract toward the short-pipe side because the intersection between the long and short pipes is a thick region. This thick region cools more slowly and has a higher average temperature at demolding, so it shrinks more after demolding. When the pattern is placed horizontally, the top surface is not perfectly level. The deformation continues for several hours and then gradually approaches a stable state.
The viscoelastic character of the wax is visible in the stress and strain histories. After the pattern reaches room temperature, the stress still decreases, and the strain still increases. This means that room-temperature aging is not a passive waiting period. It is an active viscoelastic deformation period. For lost wax casting, this implies that the storage time and storage condition are process variables in their own right.
4. Influence of Injection Parameters in Lost Wax Casting
I then investigated how injection parameters affect the dimensional deformation of the wax pattern. The parameters considered were mold temperature, packing pressure, filling time, wax injection temperature, and packing time. The response variables were the average volumetric shrinkage and the maximum free deformation after demolding. I first selected practical ranges based on the material transition temperature and on the need for complete filling. Then I used a Taguchi method to screen the factors, followed by a response surface method to build predictive models, and finally a genetic algorithm to solve the multi-objective optimization problem.
4.1 Parameter Ranges
The wax solidifies below about 49 °C, so the injection temperature must be well above this value. However, if the injection temperature is too high, the cooling time becomes long, and the thermal shrinkage increases. The mold temperature also controls the cooling rate. A higher mold temperature improves uniformity but increases shrinkage. Filling time reflects the injection velocity. If filling is too fast, the flow may become unstable. If filling is too slow, the wax may freeze before the cavity is full. Packing pressure compresses the wax and compensates for shrinkage, but excessive packing pressure can cause flashing and demolding difficulty. Packing time should be long enough to compensate shrinkage, but once the gate freezes, additional packing time has little effect. Table 7 gives the selected ranges.
| Parameter | Symbol | Range | Unit |
|---|---|---|---|
| Mold temperature | A | 19 to 25 | °C |
| Packing pressure | B | 1.5 to 3.5 | MPa |
| Filling time | C | 4 to 7 | s |
| Wax injection temperature | D | 55 to 65 | °C |
| Packing time | E | 20 to 60 | s |
4.2 Taguchi Screening
I used a two-level Taguchi design to screen the five parameters. The signal-to-noise ratio for a smaller-is-better response is:
$$S/N=-10\log\left(\frac{1}{n}\sum_{i=1}^{n}y_i^2\right)$$
Table 8 shows the Taguchi design and the simulated responses. Table 9 shows the mean response for shrinkage, and Table 10 shows the mean response for deformation. The delta value is the difference between the maximum and minimum mean response for each factor. A larger delta means a stronger effect.
| Run | A | B | C | D | E | Shrinkage (%) | Deformation (mm) |
|---|---|---|---|---|---|---|---|
| 1 | 1 | 1 | 1 | 1 | 1 | 6.5056 | 1.2923 |
| 2 | 1 | 1 | 1 | 2 | 2 | 7.2122 | 1.3189 |
| 3 | 1 | 2 | 2 | 1 | 1 | 6.2556 | 1.2522 |
| 4 | 1 | 2 | 2 | 2 | 2 | 6.6905 | 1.2833 |
| 5 | 2 | 1 | 2 | 1 | 2 | 7.0792 | 1.2970 |
| 6 | 2 | 1 | 2 | 2 | 1 | 8.2306 | 1.3483 |
| 7 | 2 | 2 | 1 | 1 | 2 | 6.9728 | 1.2569 |
| 8 | 2 | 2 | 1 | 2 | 1 | 8.2096 | 1.3509 |
| Level | A | B | C | D | E |
|---|---|---|---|---|---|
| 1 | 6.666 | 7.257 | 7.225 | 6.703 | 7.300 |
| 2 | 7.623 | 7.032 | 7.064 | 7.586 | 6.989 |
| Delta | 0.957 | 0.225 | 0.161 | 0.882 | 0.312 |
| Rank | 1 | 4 | 5 | 2 | 3 |
| Level | A | B | C | D | E |
|---|---|---|---|---|---|
| 1 | 1.287 | 1.314 | 1.305 | 1.275 | 1.311 |
| 2 | 1.313 | 1.286 | 1.295 | 1.325 | 1.289 |
| Delta | 0.027 | 0.028 | 0.010 | 0.051 | 0.022 |
| Rank | 3 | 2 | 5 | 1 | 4 |
The Taguchi analysis shows that filling time has the smallest effect on both volumetric shrinkage and deformation. For shrinkage, the order of significance is mold temperature, wax injection temperature, packing time, packing pressure, and filling time. For deformation, the order is wax injection temperature, packing pressure, mold temperature, packing time, and filling time. Because filling time is consistently the least significant factor, I removed it from the subsequent response surface study and fixed it at a practical value of 6 s.
I also performed a separate study on filling time from 2 s to 9 s. The results are given in Table 11. The shrinkage first decreases and then increases with filling time. The sink mark depth also has a minimum in the middle range. The clamping force generally increases as filling time increases. The deformation does not show a strong monotonic trend with filling time. This confirms that within the practical range, filling time is a secondary factor for dimensional deformation, although it remains important for filling quality and process stability.
| Filling time (s) | Clamping force (t) | Sink mark depth (mm) | Shrinkage (%) | Deformation (mm) |
|---|---|---|---|---|
| 2 | 2.36 | 0.7374 | 6.7426 | 1.2936 |
| 3 | 4.89 | 0.7702 | 6.9522 | 1.2975 |
| 4 | 2.61 | 0.7433 | 6.7334 | 1.2955 |
| 5 | 3.40 | 0.7379 | 6.6977 | 1.2973 |
| 6 | 4.84 | 0.7592 | 6.8992 | 1.2979 |
| 7 | 5.98 | 0.7651 | 6.8919 | 1.2966 |
| 8 | 7.68 | 0.8203 | 6.9193 | 1.2973 |
| 9 | 7.69 | 0.7940 | 6.9158 | 1.2966 |
4.3 Response Surface Modeling
After removing filling time, I used a central composite surface design for the remaining four factors: mold temperature A, packing pressure B, wax injection temperature C, and packing time D. The factor levels are given in Table 12. I fitted a second-order response surface model of the form:
$$y=a_0+\sum_{i=1}^{n}a_i x_i+\sum_{i<j}a_{ij}x_i
where \(y\) is the response, \(x_i\) are the coded factors, \(a_0\) is the constant term, \(a_i\) are linear coefficients, \(a_{ij}\) are interaction coefficients, \(a_{ii}\) are quadratic coefficients, and \(\epsilon\) is the error. I fitted separate models for the average volumetric shrinkage \(\phi\) and the maximum deformation \(\delta\).
| Level | A (°C) | B (MPa) | C (°C) | D (s) |
|---|---|---|---|---|
| -1 | 19 | 1.5 | 55 | 20 |
| 0 | 22 | 2.5 | 60 | 40 |
| 1 | 25 | 3.5 | 65 | 60 |
The full shrinkage model contained linear, quadratic, and interaction terms. The analysis of variance showed that the linear terms for mold temperature, packing pressure, wax injection temperature, and packing time were significant. The interaction between wax injection temperature and packing time was also significant. The quadratic term for packing time was significant, which indicates that the effect of packing time on shrinkage is not purely linear. This is physically reasonable because once the gate freezes, additional packing time cannot compensate for further shrinkage. After removing the insignificant terms, the reduced model became:
$$\phi = -3.314 + 0.11631 A – 0.1048 B + 0.1483 C + 0.0554 D + 0.000326 D^2 – 0.001499 C D$$
Table 13 gives the analysis of variance for the reduced shrinkage model. The adjusted coefficient of determination is 0.9504, and the predicted coefficient of determination is 0.9286. These values indicate that the reduced response surface model is accurate and has good predictive capability within the studied range.
| Source | DF | Adj SS | Adj MS | F value | P value |
|---|---|---|---|---|---|
| Model | 6 | 6.86218 | 1.1437 | 77.70 | 0.000 |
| A | 1 | 2.19144 | 2.19144 | 148.89 | 0.000 |
| B | 1 | 0.19778 | 0.19778 | 13.44 | 0.002 |
| C | 1 | 3.51461 | 3.51461 | 238.78 | 0.000 |
| D | 1 | 0.51302 | 0.51302 | 34.85 | 0.000 |
| D*D | 1 | 0.08584 | 0.08584 | 5.83 | 0.027 |
| C*D | 1 | 0.35949 | 0.35949 | 24.42 | 0.000 |
| Error | 18 | 0.26494 | 0.01472 | ||
| Total | 24 | 7.12712 |
The deformation model also contained significant linear and interaction terms. The linear effects of wax injection temperature, packing pressure, packing time, and mold temperature were significant. The interaction between packing pressure and wax injection temperature and the interaction between wax injection temperature and packing time were significant. After removing insignificant terms, the reduced deformation model became:
$$\delta = 1.0185 + 0.001394 A – 0.0883 B + 0.00505 C + 0.00484 D + 0.001207 B C – 0.000088 C D$$
Table 14 gives the analysis of variance for the reduced deformation model. The adjusted coefficient of determination is 0.9186, and the predicted coefficient of determination is 0.8773. The model is therefore slightly less accurate than the shrinkage model, but it still captures the main effects and interactions well enough for process optimization.
| Source | DF | Adj SS | Adj MS | F value | P value |
|---|---|---|---|---|---|
| Model | 6 | 0.017414 | 0.002902 | 46.15 | 0.000 |
| A | 1 | 0.000315 | 0.000315 | 5.01 | 0.038 |
| B | 1 | 0.004534 | 0.004534 | 72.08 | 0.000 |
| C | 1 | 0.009329 | 0.009329 | 148.33 | 0.000 |
| D | 1 | 0.001415 | 0.001415 | 22.49 | 0.000 |
| B*C | 1 | 0.000583 | 0.000583 | 9.27 | 0.007 |
| C*D | 1 | 0.001239 | 0.001239 | 19.70 | 0.000 |
| Error | 18 | 0.001132 | 0.000063 | ||
| Total | 24 | 0.018546 |
4.4 Interpretation of Parameter Effects
The response surface results show that wax injection temperature and mold temperature have strong effects on both shrinkage and deformation. Lower temperatures reduce the total thermal shrinkage and improve dimensional stability. However, lower temperatures also increase viscosity and reduce flowability. This trade-off is central to lost wax casting wax injection. The optimal condition is not simply the lowest possible temperature. It is the lowest temperature that still guarantees complete filling and stable packing.
Packing pressure has a strong effect on deformation. A higher packing pressure reduces shrinkage and warpage because it compresses the wax and compensates for volumetric contraction. However, if the packing pressure is too high, the pattern may flash, and demolding may become difficult. The interaction between packing pressure and wax injection temperature is significant for deformation. This interaction occurs because the packing pressure can only be effective while the gate remains open; the gate freeze time depends on the injection temperature and mold temperature.
Packing time has a nonlinear effect on shrinkage. At short packing times, increasing packing time reduces shrinkage because more material is fed into the cavity. After the gate freezes, additional packing time has little effect. The interaction between wax injection temperature and packing time is significant. At higher injection temperature, the gate freezes later, so the useful packing time window is longer. At lower injection temperature, the gate freezes earlier, so the benefit of extended packing time is reduced.
5. Multi-Objective Optimization for Lost Wax Casting
The optimization problem has two objectives: minimize volumetric shrinkage and minimize deformation. These objectives are not always aligned. I therefore formulated the problem as:
$$
\begin{aligned}
&\text{Minimize } F(x)=[f_1(x), f_2(x)],\\
&\text{subject to}\\
&19 \leq A \leq 25,\\
&1.5 \leq B \leq 3.5,\\
&55 \leq C \leq 65,\\
&20 \leq D \leq 60.
\end{aligned}
$$
I used the NSGA-II multi-objective genetic algorithm. The algorithm uses fast non-dominated sorting, crowding distance, and elitist preservation. It is well suited for this problem because the response surface models are nonlinear, and the objectives are competing. The Pareto front obtained from the optimization is given in Table 15. The deformation varies only slightly along the Pareto front, while the shrinkage varies more strongly. Therefore, I selected the solution that gives the lowest shrinkage among the solutions with near-minimum deformation.
| Solution | A (°C) | B (MPa) | C (°C) | D (s) | Shrinkage (%) | Deformation (mm) |
|---|---|---|---|---|---|---|
| Pareto 1 | 19.0 | 3.5 | 55.0 | 41.5 | 6.1248 | 1.246 |
| Pareto 2 | 19.2 | 3.4 | 55.3 | 42.0 | 6.150 | 1.247 |
| Pareto 3 | 19.5 | 3.5 | 55.8 | 43.0 | 6.205 | 1.249 |
The selected optimal parameter combination is mold temperature 19 °C, packing pressure 3.5 MPa, wax injection temperature 55 °C, and packing time 41.5 s. The predicted shrinkage is 6.1248%, and the predicted deformation is 1.246 mm. I validated this result with a direct numerical simulation. The simulation gave a shrinkage of 6.1661% and a deformation of 1.264 mm. The relative errors are 1.33% and 1.42%, respectively. This agreement confirms that the response surface model combined with the genetic algorithm is reliable for lost wax casting process optimization.
| Response | Genetic algorithm prediction | Direct simulation | Relative error |
|---|---|---|---|
| Shrinkage (%) | 6.1248 | 6.1661 | 1.33% |
| Deformation (mm) | 1.246 | 1.264 | 1.42% |
6. Discussion
The results show that a full-process simulation of wax injection molding in lost wax casting must include viscoelasticity. If the wax is treated as elastic during in-mold cooling, the residual stress is overestimated, and the demolding warpage is overestimated by about 19%. If the storage stage is ignored, a significant part of the final dimensional change is missed. For the pattern studied here, about one quarter of the total deformation occurs after demolding and during storage. The first several hours after demolding are especially important because more than 98% of the final deformation occurs within 9 h. This has practical implications for lost wax casting: the pattern should be stored under controlled conditions for a sufficient time before inspection or shell building.
The process parameter study shows that wax injection temperature and mold temperature dominate shrinkage, while wax injection temperature and packing pressure dominate deformation. Packing time has a nonlinear effect because it is limited by gate freeze-off. Filling time is the least significant factor for the final dimensional deformation within the practical range, but it remains important for filling completeness and defect avoidance. The interaction between wax injection temperature and packing time is significant because the gate freeze time depends on thermal conditions. The interaction between packing pressure and wax injection temperature is significant for deformation because packing effectiveness depends on the viscosity and solidification state of the wax.
The multi-objective optimization provides a systematic way to select injection parameters for lost wax casting. Rather than relying on trial-and-error, I can predict the shrinkage and deformation, identify the Pareto front, and choose a parameter set that satisfies the production requirements. This is particularly useful for complex patterns where the cost of mold modification is high and the lead time is long.
7. Conclusions
I have developed and validated a combined numerical route for the stress and deformation history of wax patterns in lost wax casting. The route includes filling and packing, in-mold cooling, demolding, and external storage. The main conclusions are as follows.
First, the Cross-WLF viscosity model and the modified dual-domain Tait equation accurately describe the rheological and pressure-volume-temperature behavior of the K512-type wax used in lost wax casting. The generalized Maxwell model with a fifteen-branch relaxation spectrum captures the viscoelastic response during cooling, demolding, and storage.
Second, the combined simulation shows that in-mold cooling, demolding, and storage contribute approximately 35%, 40%, and 25% of the total deformation, respectively. More than 98% of the final deformation occurs within 9 h after demolding. The predicted key dimensions agree with experimental measurements within 0.30 mm, which validates the model for lost wax casting wax patterns.
Third, viscoelastic relaxation reduces the residual stress before demolding and lowers the subsequent warpage. An elastic in-mold cooling model overestimates the demolding deformation by about 19% compared with the viscoelastic model.
Fourth, Taguchi screening shows that filling time has the smallest effect on the final shrinkage and deformation within the studied range. Wax injection temperature and mold temperature are the most influential factors for shrinkage, while wax injection temperature and packing pressure are the most influential factors for deformation.
Fifth, response surface models for shrinkage and deformation were fitted and reduced by removing insignificant terms. The reduced models have adjusted coefficients of determination of 0.9504 and 0.9186, respectively, and predicted coefficients of determination of 0.9286 and 0.8773.
Sixth, NSGA-II optimization gives an optimal parameter set of mold temperature 19 °C, packing pressure 3.5 MPa, wax injection temperature 55 °C, and packing time 41.5 s. The predicted shrinkage is 6.1248%, and the predicted deformation is 1.246 mm. Direct simulation gives 6.1661% and 1.264 mm, with relative errors below 1.5%.
8. Future Work
Future work should extend the present lost wax casting simulation to larger and more complex wax patterns. The storage stage should include more realistic support conditions, fixtures, and possible constraints, because industrial wax patterns are often stored on special trays or in correcting dies. The current model assumes a simple horizontal support. A more general contact and constraint model would improve the prediction of storage deformation.
Another direction is to build a dimensional error control model for the entire lost wax casting chain. The wax pattern is only the first link. The shell expansion, dewaxing, firing, pouring, solidification, and heat treatment stages also contribute to the final casting dimensions. If the error transfer from wax to shell to metal can be modeled together with the wax injection simulation, then the mold cavity can be designed with a compensation strategy. This would allow inverse design of the wax injection die and improve the dimensional accuracy of lost wax casting products.
I also plan to include more detailed crystallization or solidification behavior of the wax, especially near the transition temperature. The current viscoelastic model uses a single relaxation spectrum and assumes that the bulk modulus is nearly constant. In reality, the transition from melt to solid may involve a rapid change in modulus and relaxation time. A temperature-dependent spectrum and a more detailed phase transition model could further improve the accuracy of lost wax casting wax pattern simulation.
Finally, the optimization framework can be extended to include more objectives, such as sink mark depth, surface roughness, cycle time, and clamping force. A multi-objective optimization that includes both dimensional quality and production efficiency would be more useful for industrial lost wax casting. The response surface and genetic algorithm approach used here can be adapted to that larger problem, and the numerical route can be coupled with experimental validation at each stage.
In summary, my work shows that full-process viscoelastic simulation is a practical and accurate tool for understanding and controlling wax pattern deformation in lost wax casting. It connects material characterization, mold-filling analysis, finite element stress analysis, statistical design of experiments, and multi-objective optimization into a single framework. This framework can support the design of wax injection processes, reduce trial-and-error mold modification, and improve the dimensional precision of lost wax casting products.