
In our foundry, I have focused on the production of an A16 wheel hub used in agricultural and industrial machinery, especially in the transmission systems of track-type combined wheels. The component weighs approximately 64 kg, and its specified grade is QT450-10. I treat this material as a ferritic ductile iron casting grade that must provide both adequate strength and good elongation. The maximum outline dimension of the hub is between about 322 mm and 285 mm. The geometry includes an outer running section and an inner connecting section, and these two regions are joined by relatively thin ribs. At the same time, the top and side walls are thicker than the ribs. This mixed wall-thickness design makes lost foam ductile iron casting quality control particularly difficult, because thin ribs and thick walls require different local cooling and feeding behavior. The internal and external quality requirements are high, so any systematic defect such as shrinkage or graphite flotation can quickly create unacceptable rejection rates.
I have observed that in lost foam ductile iron casting, the foam pattern, the coating, the sand, the vacuum, the gating design, the nodularization treatment, and the pouring practice all interact. A change in one variable can alter the solidification path and the final graphite morphology. For the A16 wheel hub, the two most important defects in our early production were shrinkage porosity and graphite flotation. Shrinkage appeared as internal cavities or surface-connected porosity after machining, while graphite flotation appeared as dark graphite-rich zones and exploded graphite in the thicker sections. Because both defects affect the same ductile iron casting, I decided to investigate their root causes together rather than treating them as isolated quality problems.
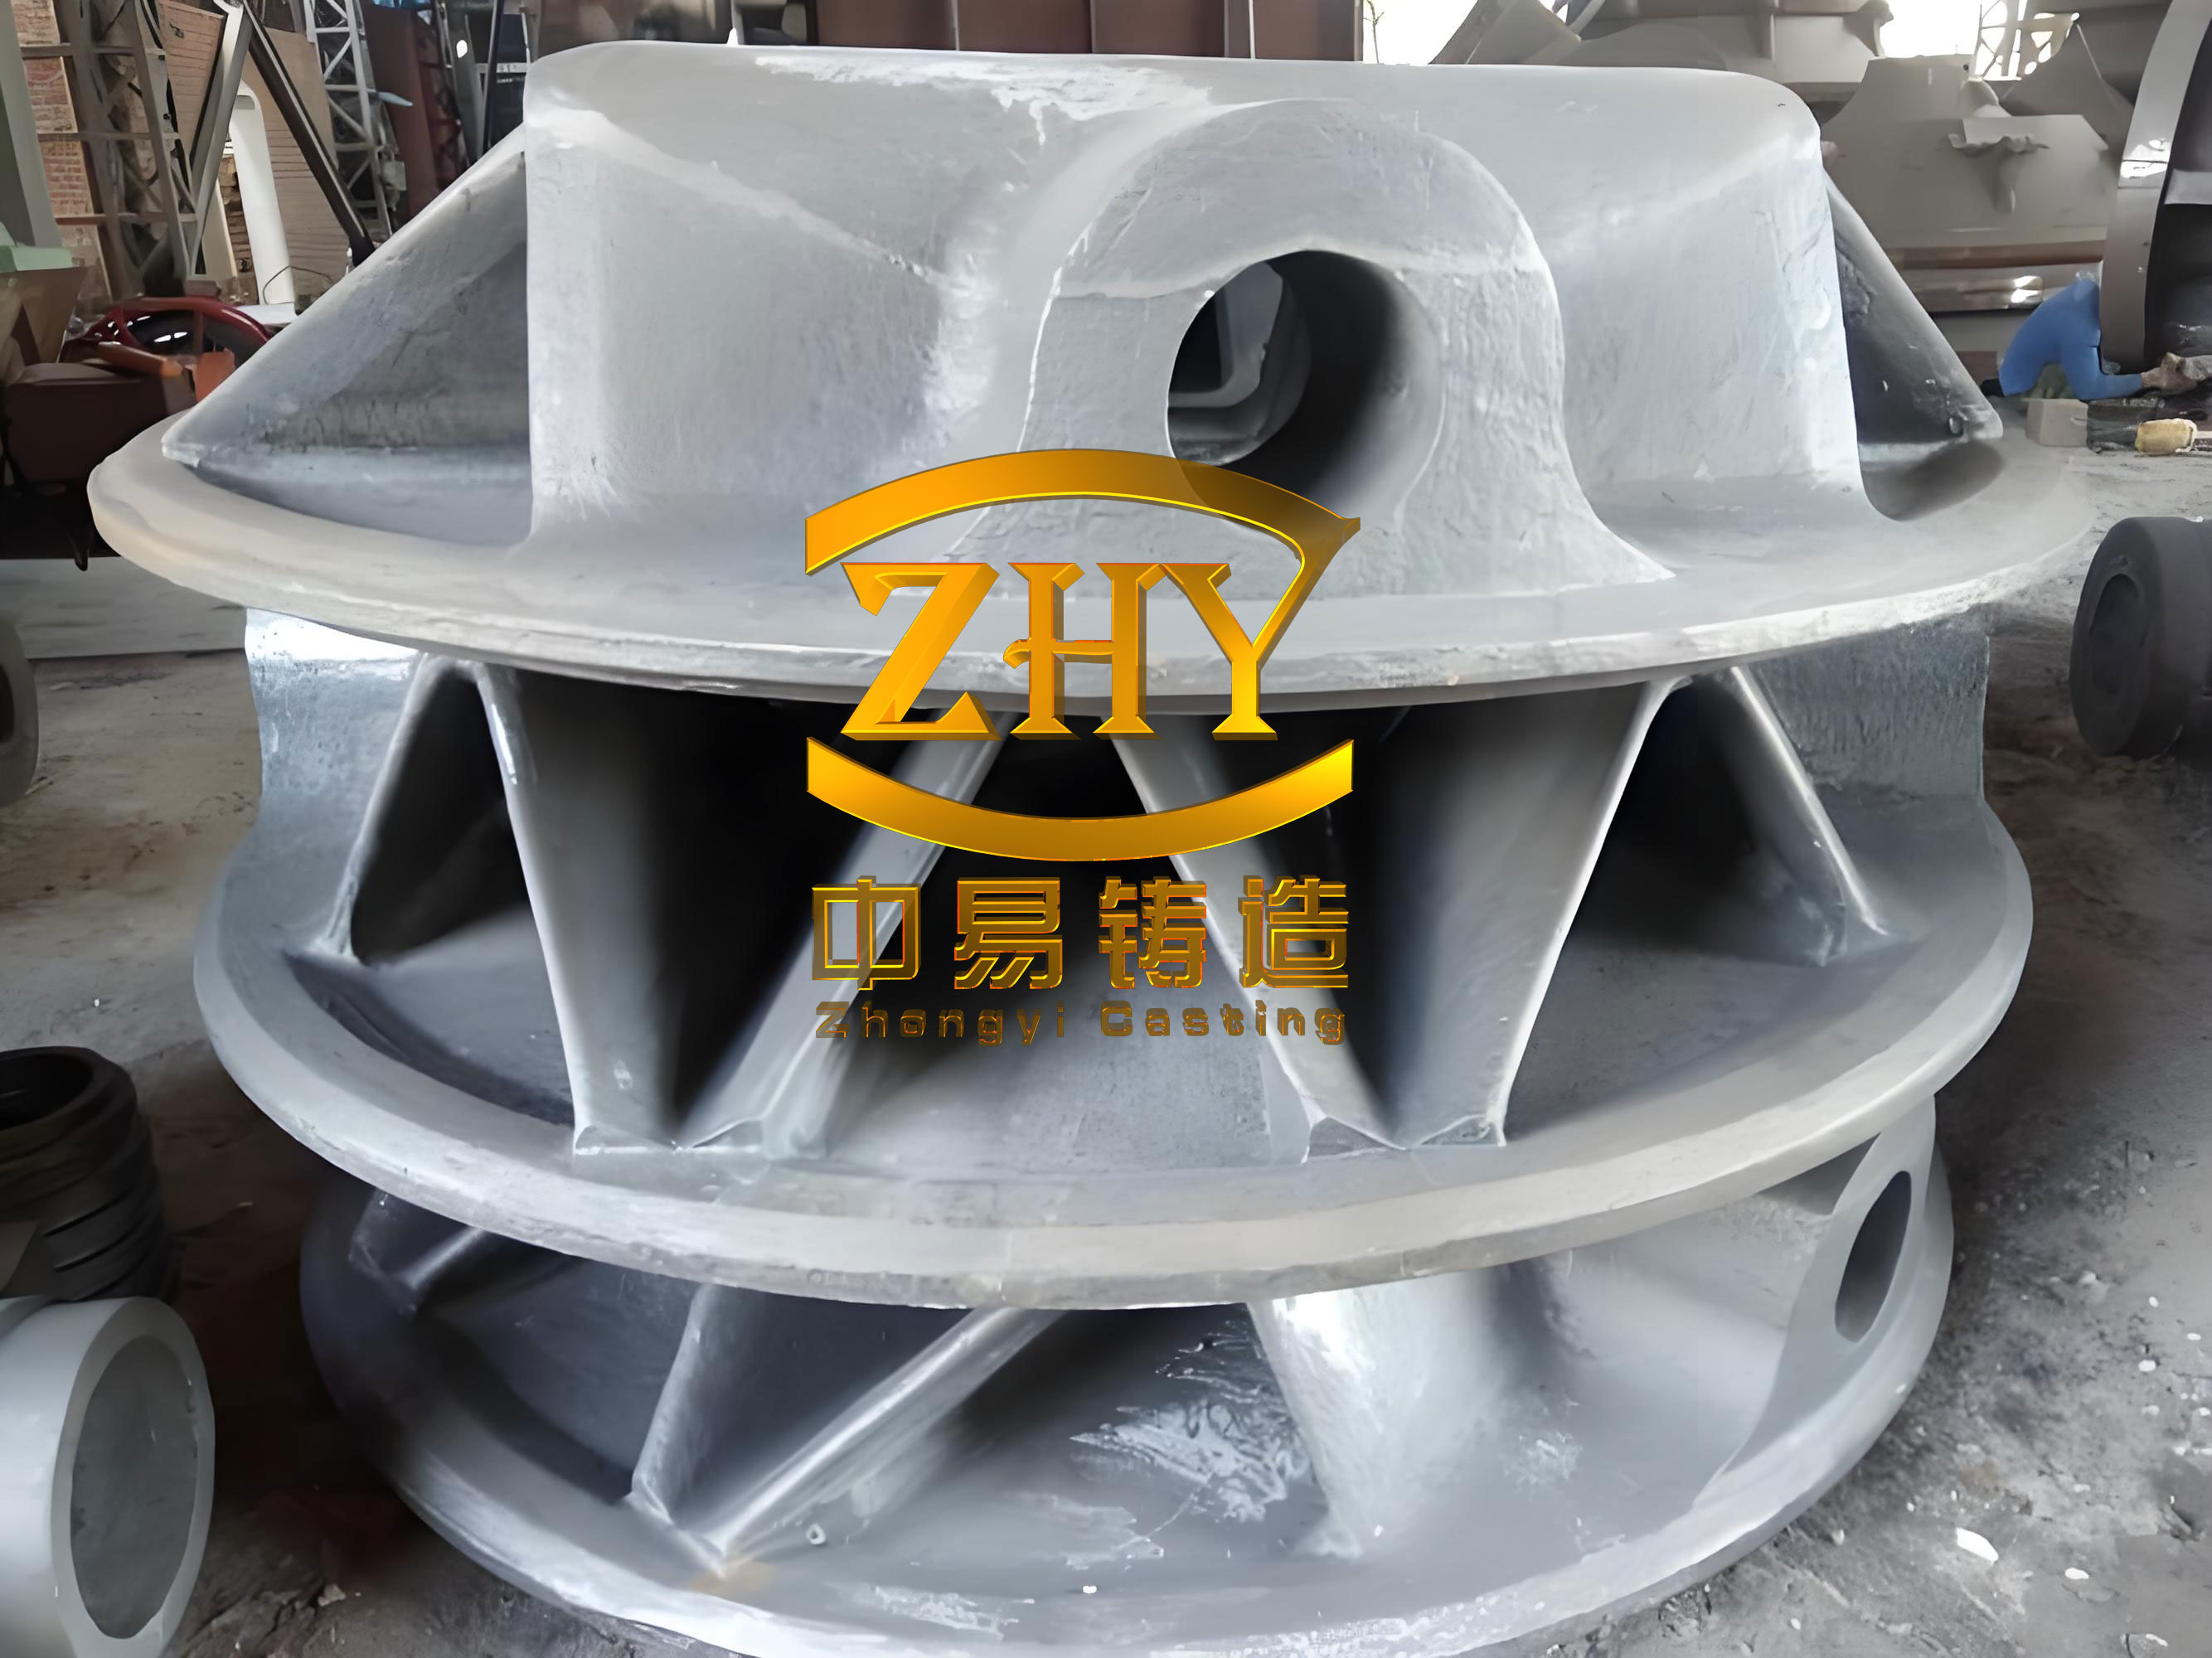
Production Baseline and Initial Process Window
At the start of the study, our production route for this ductile iron casting used lost foam casting with a top gating system. The melting equipment was a medium-frequency induction furnace. The baseline process window was set as follows: tapping temperature between 1520 °C and 1540 °C, pouring temperature between 1440 °C and 1480 °C, vacuum during pouring between −0.065 MPa and −0.075 MPa, and holding time after pouring between 4 min and 5 min. The chemical composition was controlled within the ranges shown in Table 1. These ranges were originally selected to ensure nodularization and to avoid poor graphite shape, but I later found that they allowed both residual magnesium and carbon equivalent to remain at levels that increased defect risk.
| Element | C | Si | Mn | P | S | Mg | RE |
|---|---|---|---|---|---|---|---|
| Baseline range, wt% | 3.65–3.85 | 2.65–2.85 | 0.20–0.60 | 0.07 max | 0.02 max | 0.030–0.065 | 0.020–0.040 |
During a six-month statistical period, we produced 2100 wheel hub castings. I reviewed dimensional inspection, surface quality, and metallographic results. The dimensions were acceptable, which told me that the pattern and tooling were not the primary source of scrap. However, the rejection rate caused by shrinkage cavities and shrinkage porosity was 7.95%, and the rejection rate caused by unacceptable metallography was 5.38%. The main metallographic problem was poor nodularization associated with graphite flotation. The total rejection rate was therefore too high for stable ductile iron casting production. I used the following definitions to separate and track the losses:
$$R_{\mathrm{shrinkage}} = \frac{N_{\mathrm{shrinkage}}}{N_{\mathrm{total}}} \times 100\%$$
$$R_{\mathrm{metallographic}} = \frac{N_{\mathrm{metallographic}}}{N_{\mathrm{total}}} \times 100\%$$
$$R_{\mathrm{total}} = \frac{N_{\mathrm{defective}}}{N_{\mathrm{total}}} \times 100\%$$
where \(N_{\mathrm{shrinkage}}\) is the number of castings rejected for shrinkage, \(N_{\mathrm{metallographic}}\) is the number rejected for metallographic defects, \(N_{\mathrm{defective}}\) is the total number of defective castings, and \(N_{\mathrm{total}}\) is the total number of castings produced. These simple formulas allowed me to compare the effect of process changes on each defect category. I also recorded the monthly variation in rejection rate so that I could distinguish random variation from real process improvement. The initial monthly losses are summarized in Table 2.
| Month | Poor nodularization rejection, % | Shrinkage rejection, % |
|---|---|---|
| 3 | 4.00 | 8.27 |
| 4 | 5.64 | 8.00 |
| 5 | 5.86 | 7.67 |
| 6 | 6.48 | 8.93 |
The data in Table 2 show that both defects were persistent, not accidental. The shrinkage rejection rate remained near 8%, and the poor nodularization rate increased from 4.00% to 6.48% over the first four months. I therefore began a detailed root-cause analysis of the lost foam ductile iron casting process, focusing first on shrinkage and then on graphite flotation. I wanted to identify the process variables that could be controlled in daily production without compromising the fundamental requirements of the ductile iron casting grade.
Shrinkage Formation in the Ductile Iron Casting
During trial production, we used a ladle addition method for nodularization. In this method, the nodulizer is added into the ladle, and the molten iron is poured over it. I found that the recovery of the nodulizer was unstable, and the loss of active magnesium was relatively fast. To avoid the risk of poor nodularization, the operators initially increased the nodulizer addition. This practice did improve the apparent nodularity in some heats, but it also increased the residual magnesium content in the liquid iron. In our early production, residual magnesium was often controlled between 0.045% and 0.065%, which I later identified as too high for this thick-section ductile iron casting. The result was a high shrinkage rejection rate, as shown in the monthly data and in the experimental heats summarized below.
To isolate the effect of nodulizer addition, I arranged two trial heats under otherwise similar conditions. Each heat produced four ladles, and each ladle produced five wheel hubs, giving 40 castings in total. All castings were surface machined, and selected castings were sectioned for internal inspection. The chemical composition, nodulizer addition, residual magnesium, rare earth content, and shrinkage rejection rate are given in Table 3. The first heat used 1.76% nodulizer, while the second heat used 1.18% nodulizer. The difference in residual magnesium was clear, and the difference in shrinkage rejection was even clearer.
| Heat | C | Si | Mn | P | S | Mg | RE | Nodulizer addition, % | Shrinkage rejection, % |
|---|---|---|---|---|---|---|---|---|---|
| 1 | 3.74 | 2.85 | 0.45 | 0.035 | 0.018 | 0.060 | 0.030 | 1.76 | 8.0 |
| 1 | 3.76 | 2.80 | 0.46 | 0.036 | 0.016 | 0.058 | 0.027 | 1.76 | 8.0 |
| 1 | 3.76 | 2.79 | 0.48 | 0.040 | 0.016 | 0.058 | 0.024 | 1.76 | 8.0 |
| 1 | 3.70 | 2.79 | 0.48 | 0.040 | 0.016 | 0.056 | 0.025 | 1.76 | 8.0 |
| 2 | 3.69 | 2.66 | 0.45 | 0.032 | 0.015 | 0.041 | 0.021 | 1.18 | 3.0 |
| 2 | 3.72 | 2.66 | 0.46 | 0.035 | 0.018 | 0.041 | 0.019 | 1.18 | 3.0 |
| 2 | 3.67 | 2.63 | 0.46 | 0.036 | 0.017 | 0.039 | 0.021 | 1.18 | 3.0 |
| 2 | 3.66 | 2.63 | 0.46 | 0.033 | 0.018 | 0.039 | 0.020 | 1.18 | 3.0 |
The trial data confirmed that increasing nodulizer addition raises residual magnesium and that high residual magnesium increases the shrinkage tendency of the ductile iron casting. I expressed the relationship in a simplified form as follows:
$$Mg_{\mathrm{res}} = \eta_{\mathrm{Mg}} \, w_{\mathrm{nodulizer}} \, C_{\mathrm{Mg}} – L_{\mathrm{Mg}}$$
where \(Mg_{\mathrm{res}}\) is the residual magnesium content, \(\eta_{\mathrm{Mg}}\) is the magnesium recovery efficiency, \(w_{\mathrm{nodulizer}}\) is the nodulizer addition, \(C_{\mathrm{Mg}}\) is the magnesium content in the nodulizer, and \(L_{\mathrm{Mg}}\) is the magnesium loss through oxidation, slag, and reaction with sulfur and oxygen. When \(w_{\mathrm{nodulizer}}\) is increased without improving \(\eta_{\mathrm{Mg}}\), the residual magnesium can rise quickly. In our case, the high residual magnesium changed the solidification path and increased shrinkage.
The mechanism I observed and confirmed from solidification theory is that magnesium and other nodulizing elements react with sulfur, oxygen, hydrogen, and nitrogen in the liquid iron. These elements can act as graphite nucleation substrates when present in suitable forms. When they are consumed by nodulizing elements, the iron loses some of its graphite nucleation potential. The loss of nucleation sites increases the undercooling of the eutectic reaction and promotes carbide eutectic formation. Carbide eutectic has a greater contraction than graphite eutectic, so the total solidification contraction of the ductile iron casting increases. I summarized this balance as follows:
$$\Delta V_{\mathrm{total}} = \Delta V_{\mathrm{carbide}} + \Delta V_{\mathrm{graphite}} + \Delta V_{\mathrm{austenite}}$$
$$\Delta V_{\mathrm{carbide}} > \Delta V_{\mathrm{graphite}}$$
where \(\Delta V_{\mathrm{total}}\) is the total volume change during solidification, \(\Delta V_{\mathrm{carbide}}\) is the contraction associated with carbide eutectic, \(\Delta V_{\mathrm{graphite}}\) is the expansion associated with graphite precipitation, and \(\Delta V_{\mathrm{austenite}}\) is the contraction associated with austenite formation. When carbide eutectic increases, the expansion from graphite cannot compensate for the contraction, and shrinkage cavities become more likely. In a thick-section ductile iron casting, this effect is amplified because the last liquid regions remain isolated for a longer time and cannot be fed effectively.
High residual magnesium also promotes the formation of primary austenite at a higher temperature. This gives the austenite more time to develop into coarse dendrites. These coarse dendrites can block the channels through which liquid iron would otherwise feed the shrinking regions. In addition, magnesium-containing inclusions can accumulate in the remaining liquid and create weak zones where shrinkage porosity forms. I therefore concluded that residual magnesium should not be controlled only by adding more nodulizer. Instead, the nodulizer addition, the treatment method, the sulfur content, the treatment temperature, and the waiting time before pouring all need to be controlled together. For this ductile iron casting, the objective was to achieve sufficient nodularization while keeping residual magnesium as low as practically possible.
Graphite Flotation in Thick Sections
Graphite flotation is a defect specific to ductile iron casting. It is a density segregation phenomenon in which graphite particles rise through the liquid iron and accumulate in the upper or slowly cooled parts of the casting. In the A16 wheel hub, the top and side walls are relatively thick, so these regions remained liquid longer than the thin ribs. The graphite nodules had more time to float, and the final casting showed graphite-rich zones near the upper surfaces. After machining, these zones appeared as dark gray graphite clusters. The mechanical properties in those regions were lower, and the metallographic examination often showed exploded graphite rather than well-shaped nodules. The normal and exploded graphite forms are both consequences of the same family of solidification conditions, but exploded graphite indicates that the local carbon and silicon levels are too high or that cooling is too slow.
I found that graphite flotation in this lost foam ductile iron casting was influenced by several interacting factors. The first factor was carbon equivalent. The density of graphite is about 2.2 g/cm³, while the density of liquid iron is about 7.0 g/cm³. When carbon equivalent is high, more graphite forms in the liquid, and the density difference provides a driving force for flotation. I used the following carbon equivalent expression:
$$CE = C + \frac{Si}{3} + \frac{P}{3}$$
where \(CE\) is the carbon equivalent, \(C\) is the carbon content, \(Si\) is the silicon content, and \(P\) is the phosphorus content. In our early production, \(CE\) was often controlled between 4.65% and 4.80%. This range was chosen to improve fluidity and reduce shrinkage, but it also increased graphite flotation risk. Silicon is a strong graphitizing element, and it participates in the nucleation and growth of graphite. Therefore, a high silicon level combined with a high carbon level made the flotation problem worse.
The second factor was wall thickness. When a local section is thick, the solidification time is long. I used the Chvorinov relationship to describe this effect:
$$t_{\mathrm{solidification}} = B \left(\frac{V}{A}\right)^2$$
$$M = \frac{V}{A}$$
$$t_{\mathrm{solidification}} = B M^2$$
where \(t_{\mathrm{solidification}}\) is the local solidification time, \(B\) is a mold constant related to the heat extraction capacity, \(V\) is the volume of the section, \(A\) is the heat-transfer surface area, and \(M\) is the section modulus. For the thick top and side walls of the wheel hub, \(M\) is large, so \(t_{\mathrm{solidification}}\) is long. A long solidification time allows graphite to float before the matrix becomes rigid.
The upward velocity of a graphite particle can be estimated by Stokes’ law:
$$v_{\mathrm{float}} = \frac{2 g r^{2} (\rho_{\mathrm{liquid}} – \rho_{\mathrm{graphite}})}{9 \eta}$$
where \(v_{\mathrm{float}}\) is the flotation velocity, \(g\) is gravitational acceleration, \(r\) is the effective graphite particle radius, \(\rho_{\mathrm{liquid}}\) is the density of liquid iron, \(\rho_{\mathrm{graphite}}\) is the density of graphite, and \(\eta\) is the apparent viscosity of the liquid iron. Because \(\rho_{\mathrm{liquid}} > \rho_{\mathrm{graphite}}\), the velocity is positive in the upward direction. The time required for a particle to float a characteristic distance \(h\) is:
$$t_{\mathrm{float}} = \frac{h}{v_{\mathrm{float}}}$$
Graphite flotation becomes likely when:
$$t_{\mathrm{solidification}} > t_{\mathrm{float}} \Rightarrow \text{graphite flotation risk}$$
In the thick sections of the A16 wheel hub, \(t_{\mathrm{solidification}}\) was sufficiently long to allow flotation. In the thin ribs, the solidification time was shorter, so flotation was less likely. This explains why the defect was localized rather than uniform throughout the ductile iron casting.
The third factor was the lost foam process itself. The foam pattern was made from an STMMA copolymer with a carbon content of about 69.6%. When the molten iron contacted the pattern, the polymer decomposed and produced a large amount of carbon-bearing gas and free carbon. Some of this free carbon was absorbed by the liquid iron, increasing the local carbon concentration. I represented this local enrichment as:
$$C_{\mathrm{local}} = C_{\mathrm{bulk}} + \Delta C_{\mathrm{foam}} + \Delta C_{\mathrm{carburizer}}$$
where \(C_{\mathrm{local}}\) is the local carbon content, \(C_{\mathrm{bulk}}\) is the bulk carbon content before filling, \(\Delta C_{\mathrm{foam}}\) is the carbon increase from foam decomposition, and \(\Delta C_{\mathrm{carburizer}}\) is the carbon increase from incomplete carburizer dissolution. In lost foam ductile iron casting, the foam decomposition contribution can be significant, especially when the pattern density is high or when the pouring temperature is high. This makes graphite flotation more likely than in conventional sand casting for the same base iron composition.
The fourth factor was charge preparation and carburizer addition. When pig iron content in the charge was high, graphite flotation tended to occur more easily. The timing of carburizer addition also mattered. If carburizer was added after the iron had already melted, the holding time was too short for complete dissolution and absorption. Undissolved carburizer could remain as high-carbon regions, and the effective carbon content became uneven. This uneven carbon distribution promoted local graphite flotation. The sequence of charging, the batch size of carburizer, and the mixing time all influenced the final carbon and silicon contents.
The fifth factor was process control. Pouring temperature, sand temperature, vacuum level, holding time, and the waiting time between nodularization and pouring all affected cooling rate and graphite flotation. A high pouring temperature extended the time during which the iron remained liquid, reduced the resistance to graphite movement, and gave graphite more time to float. The lost foam process also introduced a vacuum that influenced gas removal and heat transfer. If the sand temperature or vacuum level varied, the cooling rate changed, and the flotation tendency changed. I summarized the graphite flotation risk as a qualitative index:
$$GFI = \alpha (CE – CE_{\mathrm{opt}}) + \beta M + \delta T_{\mathrm{pour}} – \gamma R_{\mathrm{cool}}$$
where \(GFI\) is a graphite flotation index, \(CE_{\mathrm{opt}}\) is the optimized carbon equivalent, \(T_{\mathrm{pour}}\) is the pouring temperature, \(R_{\mathrm{cool}}\) is the local cooling rate, and \(\alpha\), \(\beta\), \(\delta\), and \(\gamma\) are positive coefficients. This index is not a precise thermodynamic model, but it helped me rank the process variables. The largest contributions came from high \(CE\), large section modulus \(M\), and high pouring temperature. Reducing these variables became the core of the improvement plan.
Systematic Optimization Measures
After identifying the main causes, I developed a systematic optimization plan for the lost foam ductile iron casting process. The plan covered chemical composition, pouring temperature, charge preparation, carburizer addition, ladle practice, foam pattern control, and general process discipline. I did not rely on a single change. Instead, I adjusted several variables together because shrinkage and graphite flotation have opposite responses to some process settings. For example, increasing carbon equivalent can improve fluidity and reduce shrinkage, but it also increases graphite flotation. Conversely, lowering carbon equivalent can reduce flotation, but it may increase shrinkage if the iron becomes too cold or too undercooled. The solution was to keep carbon equivalent in a narrower window and to improve feeding and cooling control at the same time.
The first measure was to adjust the chemical composition. I reduced the nodulizer addition while maintaining acceptable nodularization. Residual magnesium was controlled to 0.035%–0.060%. Carbon equivalent was controlled to 4.5%–4.7%. The base iron silicon content was controlled to 1.5%–1.7%. In the final iron, carbon was kept at 3.8% or below, and silicon was kept at 2.7% or below. These targets are summarized in Table 4. The purpose was to reduce both the residual magnesium-driven shrinkage tendency and the high-carbon-equivalent-driven graphite flotation tendency.
| Parameter | Baseline | Optimized | Main purpose |
|---|---|---|---|
| Nodulizer addition | Up to 1.76% in trial | Reduced according to treatment response | Lower residual magnesium |
| Residual Mg, wt% | 0.045–0.065 | 0.035–0.060 | Reduce shrinkage tendency |
| Carbon equivalent, % | 4.65–4.80 | 4.50–4.70 | Suppress graphite flotation |
| Base Si, wt% | Not tightly fixed | 1.5–1.7 | Control graphitization |
| Final C, wt% | 3.65–3.85 | 3.80 max | Lower carbon equivalent |
| Final Si, wt% | 2.65–2.85 | 2.70 max | Lower carbon equivalent |
The optimized carbon equivalent target was defined as:
$$CE_{\mathrm{target}} = C + \frac{Si}{3} + \frac{P}{3} \in [4.5, 4.7]$$
$$Mg_{\mathrm{target}} \in [0.035, 0.060]$$
$$C_{\mathrm{final}} \leq 3.8$$
$$Si_{\mathrm{final}} \leq 2.7$$
These equations express the core chemistry window. I paid particular attention to silicon because it strongly promotes graphite growth. By keeping final silicon at or below 2.7%, I reduced the amount of graphite that could form and float in the thick sections. I also kept residual magnesium within a narrower range. The lower bound ensured that nodularization was still adequate, while the upper bound limited the shrinkage tendency. In practice, this required better control of the nodulizer particle size, the ladle shape, the treatment temperature, and the reaction time.
The second measure was to reduce pouring temperature and improve ladle practice. We preheated the ladle and the ladle cover by baking and by passing molten iron through them before the actual treatment. The pouring temperature was reduced to 1440–1460 °C. This reduced the superheat and shortened the time during which graphite could float. It also reduced the burning loss of nodulizer and inoculant. Before tapping, the molten iron was held at 1520–1540 °C for about 10 min. Then the furnace temperature was lowered before tapping. This sequence allowed the iron to homogenize while avoiding an excessively high pouring temperature. The cooling rate was estimated as:
$$R_{\mathrm{cool}} = \frac{T_{\mathrm{pour}} – T_{\mathrm{solidus}}}{t_{\mathrm{solidification}}}$$
where \(T_{\mathrm{pour}}\) is the pouring temperature and \(T_{\mathrm{solidus}}\) is the solidus temperature. By lowering \(T_{\mathrm{pour}}\), I increased \(R_{\mathrm{cool}}\) for a given solidification time, which reduced the flotation time. At the same time, I avoided pouring too cold, because excessively low temperature can cause misruns, cold shuts, and poor feeding in the thin ribs.
The third measure was to control charge quality and charging order. Before the iron melted, I added carburizer in batches. I avoided adding carburizer directly to already molten iron. This improved carburizer dissolution and absorption. The carbon recovery can be expressed as:
$$\eta_{C} = \frac{\Delta C_{\mathrm{iron}}}{m_{C}/m_{\mathrm{iron}}} \times 100\%$$
$$C_{\mathrm{final}} = C_{\mathrm{charge}} + \eta_{C} \frac{m_{C}}{m_{\mathrm{iron}}}$$
where \(\eta_{C}\) is the carbon absorption efficiency, \(\Delta C_{\mathrm{iron}}\) is the change in iron carbon content, \(m_{C}\) is the mass of carburizer added, and \(m_{\mathrm{iron}}\) is the mass of iron. When carburizer is added too late, \(\eta_{C}\) is low, and the actual carbon content is uncertain. By adding carburizer before melting and in batches, I increased \(\eta_{C}\), reduced local high-carbon regions, and made the final carbon content more predictable. This helped keep carbon equivalent within the optimized window and reduced the risk of graphite flotation in the ductile iron casting.
The fourth measure was to improve process control and operator discipline. I organized theoretical and practical training so that operators understood the importance of treatment time, pouring time, ladle preparation, and sand conditions. The time from nodularization to pouring was shortened to reduce magnesium fade and inoculation fade. The vacuum system was checked regularly, and the vacuum line was cleaned to maintain stable negative pressure. Sand temperature was measured and controlled. The holding time after pouring was controlled within the required range. These actions reduced unplanned variation in cooling rate and solidification behavior.
The fifth measure was to control the foam pattern. I required daily weighing of the foam pattern to ensure that the pattern density remained within the specified range. A heavier pattern produces more gas and more free carbon during decomposition, which increases the local carbon content and promotes graphite flotation. By keeping the pattern density stable, I reduced the foam-derived carbon contribution. I also controlled the carbon content of the pattern material and the coating quality. The coating must allow controlled gas removal without causing collapse or metal penetration. These details are important in lost foam ductile iron casting because the pattern is not just a shape former; it is also a temporary carbon-bearing mold component.
The optimized process window is summarized in Table 5. This table combines the chemistry and process changes that I applied together.
| Process variable | Baseline | Optimized | Expected effect |
|---|---|---|---|
| Tapping temperature | 1520–1540 °C | 1520–1540 °C, with controlled holding | Homogenization without overheating |
| Pouring temperature | 1440–1480 °C | 1440–1460 °C | Shorter flotation time |
| Vacuum during pouring | −0.065 to −0.075 MPa | Stable within validated range | Consistent gas removal |
| Holding time after pouring | 4–5 min | 4–5 min, controlled | Stable solidification |
| Ladle condition | Variable | Preheated and cleaned | Lower thermal loss and Mg fade |
| Carburizer addition | Sometimes after melting | Before melting, in batches | Higher carbon recovery |
| Foam pattern density | Not checked daily | Weighed daily | Lower gas and free carbon |
| Sand temperature | Variable | Measured and controlled | Stable cooling rate |
| Vacuum line | Periodic cleaning | Routine cleaning and testing | Stable vacuum |
Results After Implementation
I implemented the optimized measures in August and continued to monitor the results through December. The rejection rates for poor nodularization and shrinkage decreased significantly. The monthly results are given in Table 6. The poor nodularization rejection rate fell from 4.00%–6.48% before the improvement to 2.00% in August, 1.25% in September, 0.35% in October, and zero in November and December. The shrinkage rejection rate fell from 7.67%–8.93% before the improvement to 4.46% in August, 3.29% in September, 2.88% in October, 2.30% in November, and 2.48% in December. These numbers show that the systematic changes were effective and sustained.
| Month | Poor nodularization rejection, % | Shrinkage rejection, % |
|---|---|---|
| 3 | 4.00 | 8.27 |
| 4 | 5.64 | 8.00 |
| 5 | 5.86 | 7.67 |
| 6 | 6.48 | 8.93 |
| 8 | 2.00 | 4.46 |
| 9 | 1.25 | 3.29 |
| 10 | 0.35 | 2.88 |
| 11 | 0 | 2.30 |
| 12 | 0 | 2.48 |
To quantify the improvement, I calculated the average rejection rate before and after the change. The pre-improvement period was March through June, and the post-improvement period was August through December. The average rejection rate is:
$$\bar{R}_{\mathrm{pre}} = \frac{1}{n} \sum_{i=1}^{n} R_{i}$$
$$\bar{R}_{\mathrm{post}} = \frac{1}{m} \sum_{j=1}^{m} R_{j}$$
$$\eta_{\mathrm{reduction}} = \frac{\bar{R}_{\mathrm{pre}} – \bar{R}_{\mathrm{post}}}{\bar{R}_{\mathrm{pre}}} \times 100\%$$
The calculated averages and reductions are shown in Table 7. The average poor nodularization rejection rate decreased from 5.495% to 0.720%, a reduction of about 86.9%. The average shrinkage rejection rate decreased from 8.2175% to 3.082%, a reduction of about 62.5%. These reductions were achieved without changing the fundamental grade of the ductile iron casting or sacrificing dimensional conformance.
| Defect category | Pre-improvement average, % | Post-improvement average, % | Reduction, % |
|---|---|---|---|
| Poor nodularization | 5.495 | 0.720 | 86.9 |
| Shrinkage | 8.2175 | 3.082 | 62.5 |
I also observed that the process became more stable after the changes. The monthly variation in rejection rate decreased, which is important for lost foam ductile iron casting because the process has many interacting variables. When the chemistry window, pouring temperature, carburizer addition, and foam pattern density are all controlled, the solidification path becomes more repeatable. This repeatability reduces the probability that a local thick section will remain liquid long enough for graphite to float or that a local hot spot will form a shrinkage cavity. The improved results also showed that the operators could maintain the new practice in daily production, not only under trial conditions.
Discussion of the Control Strategy
The most important lesson I learned from this study is that residual magnesium and carbon equivalent must be controlled together in ductile iron casting. In our early practice, the operators increased nodulizer addition to avoid poor nodularization. This reduced the risk of one defect but increased the risk of shrinkage. The high residual magnesium consumed nucleation substrates, increased undercooling, promoted carbide eutectic, and encouraged coarse austenite dendrites. These effects all made feeding more difficult. When I reduced the nodulizer addition and improved the treatment method, residual magnesium decreased, and the shrinkage rejection rate fell. At the same time, I had to ensure that nodularization remained acceptable. This required better control of sulfur, treatment temperature, ladle condition, and reaction time. The result was a narrower and more robust process window.
The second lesson is that graphite flotation in a thick-section ductile iron casting cannot be controlled by chemistry alone. The lost foam process adds carbon through pattern decomposition, and the thick walls provide a long solidification time. Therefore, chemistry, pouring temperature, pattern density, and cooling rate must be managed together. The optimized carbon equivalent range of 4.5%–4.7% reduced the amount of graphite in the liquid, while the lower pouring temperature shortened the flotation time. The improved carburizer practice made the carbon content more predictable and reduced local high-carbon regions. The daily weighing of the foam pattern reduced the foam-derived carbon contribution. These measures attacked the flotation problem from several directions.
The third lesson is that process control is not a secondary issue in lost foam ductile iron casting. The vacuum level, sand temperature, holding time, and waiting time before pouring all affect the thermal history. If these variables drift, the best chemistry window will not guarantee good results. I found that routine cleaning of the vacuum line, regular sand temperature measurement, and strict control of the time from nodularization to pouring were essential. These actions are simple, but they require discipline. Training and daily feedback helped the operators understand why each step mattered. The improvement in rejection rate was therefore not the result of one clever change but of a series of small, connected controls.
The fourth lesson is that the geometry of the A16 wheel hub makes it a difficult ductile iron casting. The thin ribs and thick top and side walls create a wide range of section moduli. The thin ribs cool quickly, while the thick walls cool slowly. This means that the iron must have enough fluidity to fill the thin ribs but not so much superheat that the thick walls remain liquid for too long. The optimized pouring temperature of 1440–1460 °C was a compromise. It provided adequate fillability while limiting graphite flotation. The optimized carbon equivalent of 4.5%–4.7% was also a compromise. It maintained feeding ability while reducing the graphite load. In mixed-wall-thickness ductile iron casting, these compromises are necessary, and they must be validated by production data.
The fifth lesson is that the nodulizer addition should be based on the actual treatment response, not on a fixed high value. In our trial, 1.76% nodulizer produced residual magnesium around 0.056%–0.060% and a shrinkage rejection rate of 8%. In contrast, 1.18% nodulizer produced residual magnesium around 0.039%–0.041% and a shrinkage rejection rate of 3%. This does not mean that 1.18% is always the correct value. It means that the nodulizer addition must be matched to the sulfur content, the treatment temperature, the ladle design, and the target residual magnesium. The optimized residual magnesium range of 0.035%–0.060% gave the operators a clear target. Within this range, the iron can be nodularized without excessive shrinkage tendency.
I also considered the relationship between carbon equivalent and shrinkage. In principle, a higher carbon equivalent can reduce shrinkage because graphite precipitation expands and partially compensates for contraction. However, in this thick-section lost foam ductile iron casting, a high carbon equivalent increased graphite flotation. I therefore could not simply raise carbon equivalent to solve shrinkage. Instead, I lowered residual magnesium, improved feeding, and controlled cooling. The optimized carbon equivalent of 4.5%–4.7% was high enough to promote graphitization but low enough to limit flotation. This balance was confirmed by the reduction in both defect categories.
The results also showed that the poor nodularization rate was more sensitive to the changes than the shrinkage rate. Poor nodularization fell to zero in November and December, while shrinkage remained around 2.3%–2.5%. This suggests that some shrinkage risk is inherent in the geometry and the lost foam process. The remaining shrinkage may be related to local hot spots, gate design, or the last-to-solidify regions in the thick walls. Further improvement could focus on gating and feeding design, local cooling, or pattern assembly. However, the reduction from about 8.2% to about 3.1% is already significant for production. It reduced scrap, improved delivery reliability, and lowered rework and machining losses.
From a metallurgical point of view, the prevention of graphite flotation requires keeping the local carbon equivalent below a critical value for the local cooling rate. The critical value is not a single number; it depends on section modulus, pouring temperature, and the amount of carbon introduced by the foam pattern. I used the graphite flotation index as a qualitative tool to remind the team that several variables add together. The index can be written as:
$$GFI = \alpha (CE – CE_{\mathrm{opt}}) + \beta M + \delta T_{\mathrm{pour}} – \gamma R_{\mathrm{cool}}$$
When \(GFI\) is positive, the risk of graphite flotation increases. When \(GFI\) is negative, the risk decreases. The coefficients \(\alpha\), \(\beta\), \(\delta\), and \(\gamma\) are determined by experience and by the specific process. In our plant, the most practical way to lower \(GFI\) was to reduce \(CE\), reduce \(T_{\mathrm{pour}}\), and increase \(R_{\mathrm{cool}}\) through better process control. The section modulus \(M\) is fixed by the casting design, but local cooling can be influenced by sand temperature, vacuum, and pattern density. This is why the optimization plan included both chemistry and process variables.
For shrinkage, the critical control variable was residual magnesium. The relationship can be summarized as follows:
$$Mg_{\mathrm{res}} \uparrow \Rightarrow \text{graphite nucleation} \downarrow \Rightarrow \text{undercooling} \uparrow \Rightarrow \text{carbide eutectic} \uparrow \Rightarrow \text{shrinkage} \uparrow$$
This chain reaction explains why simply adding more nodulizer can be counterproductive. The correct approach is to improve the nodulizer recovery and to reduce the residual magnesium to the minimum level that still provides acceptable nodularity. In our case, that level was 0.035%–0.060%. The lower part of the range was used when sulfur was low and treatment conditions were well controlled. The upper part of the range was used only when necessary. This flexible control helped reduce the average residual magnesium without risking poor nodularization.
Practical Control Rules for Replication
Based on the results, I established several practical control rules for this ductile iron casting. These rules are listed in Table 8. They are not intended to replace engineering judgment, but they provide a stable starting point for daily production.
| Control area | Rule | Reason |
|---|---|---|
| Residual magnesium | Keep between 0.035% and 0.060% | Balance nodularization and shrinkage resistance |
| Carbon equivalent | Keep between 4.50% and 4.70% | Reduce graphite flotation risk |
| Final carbon | Keep at 3.80% max | Limit graphite load |
| Final silicon | Keep at 2.70% max | Limit graphitization |
| Base silicon | Keep between 1.50% and 1.70% | Allow controlled inoculation |
| Pouring temperature | Keep between 1440 °C and 1460 °C | Reduce flotation time while maintaining fill |
| Carburizer | Add before melting and in batches | Improve absorption and uniformity |
| Ladle | Preheat and clean before use | Reduce thermal loss and Mg fade |
| Foam pattern | Weigh daily and control density | Reduce gas and free carbon |
| Vacuum system | Clean and test routinely | Maintain stable gas removal |
| Sand temperature | Measure and control | Stabilize cooling rate |
| Treatment-to-pour time | Shorten and standardize | Reduce Mg fade and inoculation fade |
I also used a simple daily checklist to verify that the key variables were within the target ranges. The checklist included the measured residual magnesium, carbon equivalent, pouring temperature, vacuum level, sand temperature, foam pattern weight, and treatment time. When any variable moved outside the target, the team recorded the deviation and adjusted the process before the next heat. This feedback loop was important because lost foam ductile iron casting is sensitive to small changes. A deviation that seems minor in one heat can become a defect in a thick section when it combines with high carbon equivalent or slow cooling.
In addition to the daily checks, I reviewed the monthly rejection data with the production and quality teams. The monthly review helped us see whether the process was drifting. For example, if the poor nodularization rate began to rise, we checked residual magnesium, nodulizer quality, and treatment time. If the shrinkage rate began to rise, we checked pouring temperature, carbon equivalent, and ladle condition. If graphite flotation appeared, we checked carbon equivalent, final silicon, foam pattern density, and pouring temperature. This systematic response prevented the process from returning to the old high-nodulizer, high-carbon-equivalent practice.
Economic and Quality Effects
The reduction in rejection rate had a direct economic effect. A lower rejection rate means less remelting, less machining of defective castings, less inspection time, and fewer delays. For a 64 kg ductile iron casting, each rejected piece represents not only lost metal but also lost melting energy, lost labor, lost machining capacity, and lost order fulfillment. The improvement from about 8.2% shrinkage rejection to about 3.1% shrinkage rejection, and from about 5.5% poor nodularization rejection to about 0.7%, reduced the total scrap burden substantially. I did not need to add expensive alloying elements or complicated equipment. The main investment was in process discipline, training, and routine measurement.
The quality effect was also important. The optimized process produced a more uniform microstructure in the thick sections. The graphite shape improved, and the amount of exploded graphite decreased. The shrinkage cavities were reduced, especially in the machined surfaces and in the internal sections that had previously required repair or rejection. The dimensional quality remained acceptable because the pattern and gating design were not changed in a way that affected shrinkage allowance. The casting continued to meet the QT450-10 requirements, and the improved process reduced the risk of hidden defects that could cause field failure.
I also noted that the optimized process improved the confidence of the operators. In the early period, the operators added more nodulizer because they were afraid of poor nodularization. After the trials, they understood that excess nodulizer could cause shrinkage. They also understood that graphite flotation was related to carbon equivalent, pouring temperature, and foam pattern density. This understanding helped them make better decisions when a heat deviated from the standard. In ductile iron casting, operator behavior is part of the process. A technically correct procedure must be understood and followed consistently to produce stable results.
Further Considerations for Lost Foam Ductile Iron Casting
The A16 wheel hub experience showed me that lost foam ductile iron casting requires a different mindset from conventional sand casting. In lost foam, the pattern decomposes and interacts with the liquid iron. The decomposition products include gases and carbon, and the coating and sand must allow the gases to escape while maintaining the mold cavity. If the pattern density is too high or the pouring temperature is too high, the amount of decomposition product increases. This can raise the local carbon content and promote graphite flotation. If the vacuum is too low, gas removal may be insufficient, and defects such as blowholes or incomplete filling may occur. If the vacuum is too high, the sand may compact too strongly, and the coating may crack. Therefore, the vacuum must be stable and optimized, not simply maximized.
For thick-section ductile iron casting, the cooling rate is another critical variable. The thick top and side walls of the wheel hub act as hot spots. These hot spots remain liquid longer and require effective feeding. At the same time, they are the regions where graphite flotation is most likely. The process must therefore provide enough feeding to prevent shrinkage without creating a long flotation window. This is a difficult balance. In our case, lowering the pouring temperature and reducing carbon equivalent helped reduce the flotation risk, while controlling residual magnesium and improving ladle practice helped reduce the shrinkage risk. The two measures worked together because they addressed different parts of the solidification process.
Another consideration is inoculation. Inoculation promotes graphite nucleation and reduces undercooling. However, if inoculation is too strong or if the inoculant is added too early, the graphite may grow excessively and float. If inoculation is too weak, carbide may form and shrinkage may increase. The inoculation practice must therefore be matched to the base silicon, the final silicon, the sulfur content, and the cooling rate. In our optimized process, the base silicon was controlled to 1.5%–1.7%, and the final silicon was kept at 2.7% or below. This gave enough graphitization potential without excessive graphite growth. The time from inoculation to pouring was also shortened to reduce fade.
Sulfur control is also important. Sulfur reacts with magnesium and other nodulizing elements. If sulfur is high, more nodulizer is needed to achieve the same residual magnesium. If sulfur is low, the nodulizer addition can be reduced. Therefore, controlling the sulfur content of the charge and the base iron is a direct way to reduce residual magnesium and shrinkage risk. In our process, sulfur was kept at 0.02% or below. This helped reduce the required nodulizer addition and made the residual magnesium target easier to achieve. Phosphorus was also kept low because it affects carbon equivalent and can contribute to embrittlement. The baseline specification allowed phosphorus up to 0.07%, but in practice we aimed for lower values to maintain ductility.
Manganese was controlled within 0.20%–0.60%. Manganese affects hardenability and can form carbides if segregation occurs. In a thick-section ductile iron casting, manganese segregation can create local hard areas and reduce machinability. Although manganese was not the main cause of the defects in this study, it remains a variable to monitor. The optimized process focused on carbon, silicon, magnesium, sulfur, and phosphorus because these elements had the strongest effect on shrinkage and graphite flotation. In future work, I would also consider the effect of trace elements and nodulizer rare earth content on nucleation and flotation.
The rare earth content in the nodulizer was kept within 0.020%–0.040%. Rare earth elements can help counteract harmful trace elements and improve nodularization, but excess rare earth can also affect graphite morphology and increase slag. In our trials, the rare earth content was slightly higher in the high-nodulizer heat, but the main difference was residual magnesium. This suggests that magnesium control was the dominant factor for shrinkage. I therefore focused on reducing nodulizer addition and improving magnesium recovery rather than increasing rare earth addition.
Conclusion
In our lost foam ductile iron casting production of the A16 wheel hub, I found that shrinkage and graphite flotation were the two main causes of scrap. The shrinkage problem was driven by excessive nodulizer addition and high residual magnesium. The high residual magnesium consumed nucleation substrates, increased undercooling, promoted carbide eutectic, and encouraged coarse austenite dendrites, all of which increased the solidification contraction and reduced feeding efficiency. The graphite flotation problem was driven by high carbon equivalent, thick sections, slow cooling, and extra carbon from the lost foam pattern. The combination of high carbon equivalent and long solidification time allowed graphite to float and accumulate in the upper and thicker regions of the casting.
I implemented a systematic optimization plan that included lowering residual magnesium to 0.035%–0.060%, controlling carbon equivalent to 4.5%–4.7%, keeping final carbon at 3.8% or below, keeping final silicon at 2.7% or below, reducing pouring temperature to 1440–1460 °C, preheating the ladle, adding carburizer before melting in batches, controlling foam pattern density, and improving process discipline. After these changes, the poor nodularization rejection rate fell from an average of about 5.5% to about 0.7%, and the shrinkage rejection rate fell from an average of about 8.2% to about 3.1%. The process became more stable, and the quality of the ductile iron casting improved.
The main conclusion is that quality control in lost foam ductile iron casting must be based on the interaction of chemistry, treatment, pouring, and cooling. Residual magnesium and carbon equivalent should not be treated as independent variables. They must be controlled together with pouring temperature, carburizer practice, foam pattern density, and vacuum. When these variables are kept within a validated window, shrinkage and graphite flotation can be greatly reduced. I will continue to use the same data-driven approach for future ductile iron casting projects, because stable production depends on understanding the process rather than reacting to individual defects after they appear.