
I approached the K403 shell casting as a coupled thermal, fluid-flow, and dimensional-control problem rather than as a simple sequence of foundry steps. The part is an aero-engine shell casting with a complex geometry, large wall-thickness variation, multiple hot spots, and tight dimensional requirements. My objective was to stabilize metallurgical quality, eliminate porosity and cold shuts, reduce cracking, and bring critical dimensions back into tolerance. Although the production route I optimized was investment casting, I also recognized that many of the same filling and solidification laws apply to lost foam castings, especially when thin sections, re-entrant angles, and local hot spots are present. In lost foam castings, as in this K403 shell, the interaction between mold permeability, metal superheat, pouring speed, and local thermal resistance often determines whether a defect forms or is suppressed. I therefore treated the process as a set of linked windows rather than as isolated parameters.
My starting point was a systematic review of the geometry and the defect history. The shell casting has a support column height of 129 mm, an overall length of 111 mm, a maximum diameter of 32 mm, a minimum diameter of 14 mm, and a nominal wall thickness of 6.5 mm. The thickness changes abruptly, which creates a large modulus gradient. In lost foam castings, such gradients are often responsible for incomplete filling and internal shrinkage because the metal front can freeze before the thicker section receives adequate feed. In this investment-cast K403 shell, the same phenomenon appeared as porosity, cold shut, and misrun. I built a defect map that linked each geometry feature to a thermal signature and then selected process changes that would shift the local solidification behavior without damaging the overall shell integrity.
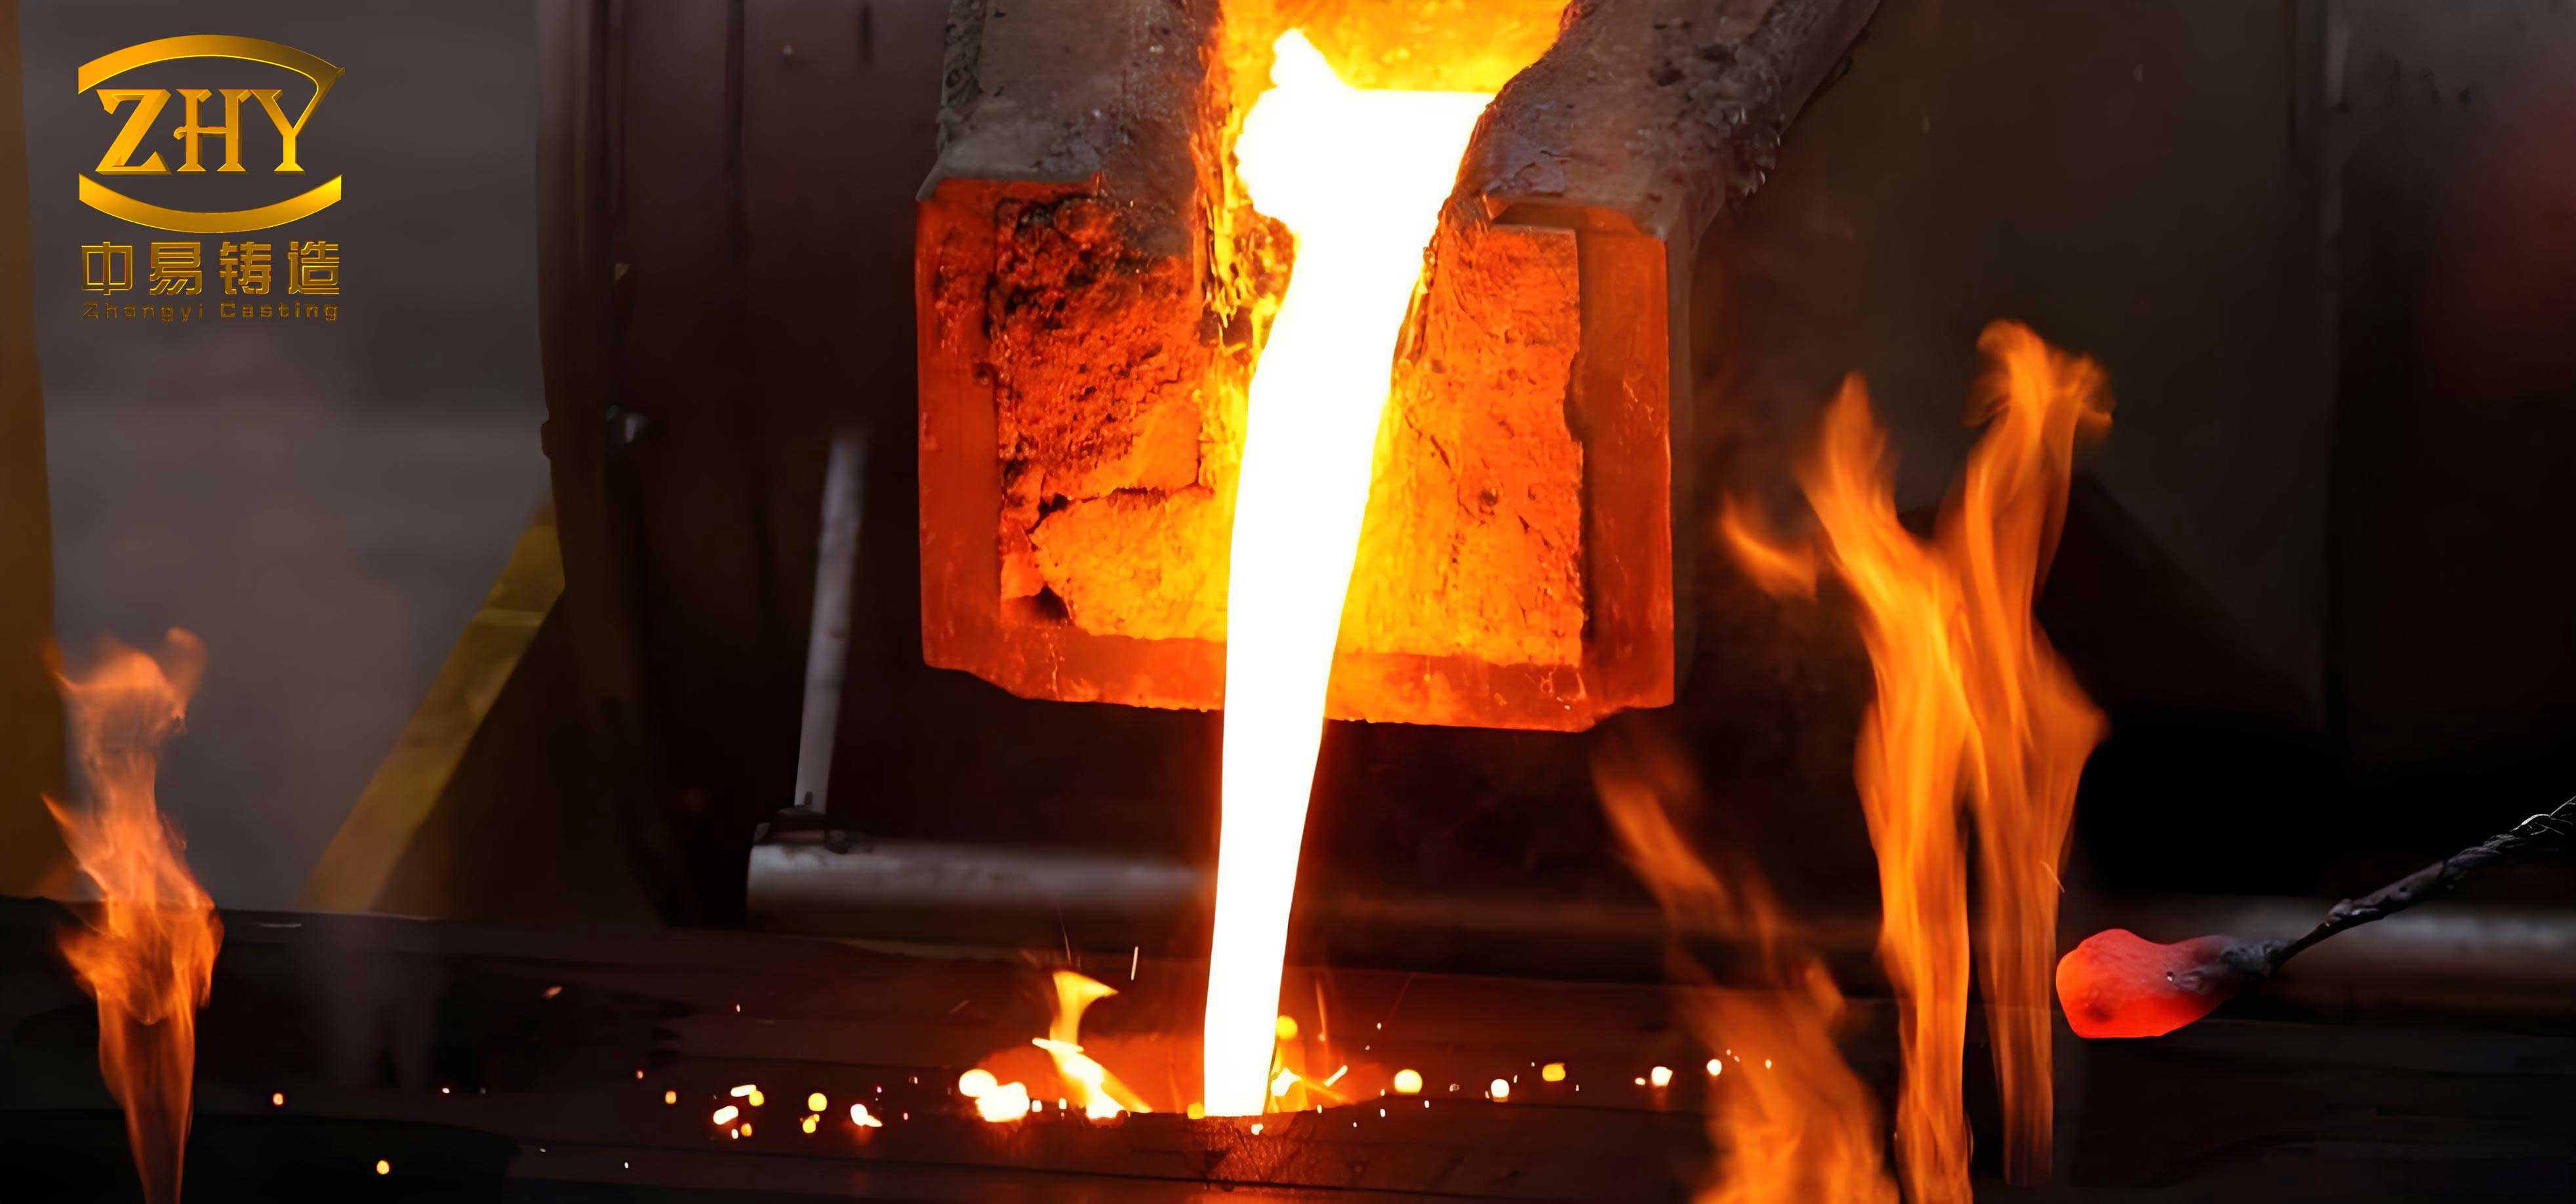
The image below shows a representative full-mold arrangement of the type that helps me visualize filling and thermal resistance in related processes, including lost foam castings.
The alloy chemistry is a central constraint because K403 is a nickel-base high-temperature alloy with strong gamma-prime forming elements and a relatively narrow solidification range. I used the specified composition window as the basis for superheat and feeding calculations. The main elements are summarized below.
| Element | Mass fraction, % | Process significance |
|---|---|---|
| C | 0.11–0.18 | Controls carbide formation and grain-boundary behavior. |
| Cr | 10.00–12.00 | Oxidation resistance and solid-solution strengthening. |
| Co | 4.50–6.00 | Improves high-temperature stability. |
| W | 4.80–5.50 | Refractory strengthening; influences segregation. |
| Mo | 3.80–4.50 | Solid-solution strengthening; affects fluidity. |
| Ti | 2.30–2.90 | Gamma-prime former; strong effect on solidification range. |
| Al | 5.30–5.90 | Gamma-prime former; oxidation and casting response. |
| Ce | ≤0.01 | Trace control; impurity-sensitive behavior. |
| Fe | ≤2.00 | Residual element; kept low for phase stability. |
| Si | ≤0.50 | Residual; may affect cleanliness. |
| Mn | ≤0.50 | Residual; controlled for alloy consistency. |
| S | ≤0.01 | Harmful impurity; must be minimized. |
| P | ≤0.02 | Harmful impurity; must be minimized. |
| Ni | Balance | Base element; matrix stability. |
I summarized the geometric features that control the casting response in a second table. These variables determine the local modulus, the filling resistance, and the likelihood of deformation. In lost foam castings, the same variables influence foam degradation, gas evacuation, and metal-front stability. I therefore used them as the backbone of my parameter selection.
| Feature | Value | Consequence for casting |
|---|---|---|
| Support column height | 129 mm | Long vertical feeding path; gravity and pressure head matter. |
| Overall length | 111 mm | Dimensional stability can shift during cooling. |
| Maximum diameter | 32 mm | Local hot spot and shrinkage risk. |
| Minimum diameter | 14 mm | Rapid freezing and potential cold shut. |
| Nominal wall thickness | 6.5 mm | Moderate thin-wall behavior with steep gradients. |
| Hot-spot count | Multiple | Requires directional feeding and local cooling. |
| Tolerance class | Near-net shape | Limited allowance for distortion or mismatch. |
The thermal modulus is the first quantity I calculate when I compare feeding resistance among sections. For a casting volume \(V\) and a heat-loss surface area \(A\), the modulus is
$$M = \frac{V}{A}$$
For a sound casting, the feeder or riser modulus must exceed the casting modulus after accounting for the feeding efficiency and the solidification mode. I used a practical criterion of
$$M_r \geq 1.2 M_c$$
where \(M_r\) is the riser or feed-path modulus and \(M_c\) is the local casting modulus. In lost foam castings, this inequality is complicated by the foam pattern and coating, because the effective heat-transfer coefficient changes as the foam decomposes. In the present K403 shell, the investment shell provided a more predictable heat-transfer path, but the local shell thickness still had to be controlled to avoid hot spots in the thick sections.
Solidification time was estimated with the Chvorinov relationship:
$$t_s = B \left( \frac{V}{A} \right)^n$$
Here \(B\) is a mold constant that depends on the alloy, mold material, and initial temperatures, while \(n\) is typically close to 2 for many castings. I used this relation qualitatively to rank sections and quantitatively to set shell-thinning targets. A thick shell acts as an insulating blanket; a thinner shell raises the local heat flux and shortens local solidification time. The heat flux through the shell can be written as
$$q = \frac{\Delta T}{R_{th}}$$
and the conductive thermal resistance of a shell section is
$$R_{th} = \frac{\delta}{k A}$$
where \(\delta\) is the local shell thickness, \(k\) is the effective thermal conductivity, and \(A\) is the heat-transfer area. By reducing \(\delta\) locally, I lowered \(R_{th}\), increased \(q\), and encouraged faster freezing in the hot spot. This was one of the most effective changes in the whole program.
I also examined the wax injection process because dimensional error often begins long before metal is poured. The flow of molten wax through a die channel can be approximated by a pressure-driven capillary flow:
$$Q = \frac{\pi R^4 \Delta P}{8 \mu L}$$
where \(Q\) is volumetric flow rate, \(R\) is channel radius, \(\Delta P\) is pressure drop, \(\mu\) is wax viscosity, and \(L\) is channel length. This equation explains why injection pressure, wax temperature, and die temperature must be balanced. A low wax temperature raises viscosity and reduces \(Q\), producing cold shut or incomplete corners in the wax pattern. A high wax temperature lowers viscosity but increases volumetric shrinkage, which can generate sink marks and flow lines. In lost foam castings, an analogous balance exists between foam density, bead fusion, and pattern shrinkage, although the material behavior is different.
Volumetric shrinkage during wax cooling follows the usual relation
$$\Delta V = \alpha_v V_0 \Delta T$$
where \(\alpha_v\) is the volumetric thermal expansion coefficient and \(\Delta T\) is the temperature drop. I used this relation to justify a moderate wax temperature and a sufficiently long hold time. The hold time must allow the gate and thick sections to solidify under pressure. A practical estimate is
$$t_{hold} \geq \frac{R^2}{4 \alpha}$$
where \(\alpha\) is the thermal diffusivity of the wax. I did not rely on this estimate alone, but it helped me choose a starting point for trials. The final wax-making window I selected is shown below.
| Wax injection parameter | Selected window | Reason for control |
|---|---|---|
| Wax temperature | 55–63 °C | Balances fluidity and shrinkage. |
| Die temperature | 25–35 °C | Controls cooling rate and surface finish. |
| Injection pressure | 15–25 bar | Improves filling without excessive flash or sticking. |
| Hold time | 15–20 s | Reduces sink and stabilizes dimensions. |
| Pattern cooling | Controlled ambient | Prevents warpage before assembly. |
In the early trials, the wax pattern was made as three separately injected pieces and then assembled in a fixture. That approach introduced human-dependent positioning. The measured result was a serious centerline shift: two cylindrical features shifted by 1.7–2.2 mm, the outer cylindrical pair tended to lift, a 41.5 mm length grew, and another pair of centers shifted by 0.5–0.87 mm. These errors were not random; they came from fixture location limits and assembly distortion. I therefore abandoned split-wax assembly and redesigned the tooling around a one-piece wax pattern. This change removed the largest source of dimensional variation and made the subsequent shell and casting steps more predictable. The same principle applies in lost foam castings: a one-piece foam pattern or a rigorously controlled assembly is usually superior to a manually aligned multi-part pattern when tolerance is tight.
| Dimensional problem in early trials | Observed range | Root cause | Countermeasure I applied |
|---|---|---|---|
| Center shift of two cylindrical features | 1.7–2.2 mm | Split pattern and fixture limitation. | One-piece wax pattern; revised datum scheme. |
| Outer cylindrical pair lift | Visible warpage | Assembly stress and uneven cooling. | One-piece tooling; controlled cooling. |
| Length growth | 41.5 mm feature | Shrinkage mismatch and assembly error. | Shrinkage compensation and one-piece pattern. |
| Secondary center shift | 0.5–0.87 mm | Stacked assembly tolerance. | Integrated datum and inspection loop. |
The shell-making process is where I made the most important thermal correction. A shell must have enough green strength, hot strength, and permeability to survive handling and pouring, but it must not insulate the hot spots so strongly that they remain liquid while the surrounding thin sections freeze. I used a layered shell with controlled slurry viscosity and stucco grading. The first layer was a fine refractory system for surface finish, and the later layers built strength and permeability. After the fourth coating, I applied local wax patches to selected thick-section areas. These patches were later removed or thinned to create a locally thinner shell. I also plugged soft wax into upper and lower holes and placed a soft wax ring around each of the eight inner gate locations before continuing shell building. This local shell-thinning strategy increased heat extraction exactly where porosity had been observed.
| Shell layer | Slurry system | Viscosity | Stucco | Drying / curing |
|---|---|---|---|---|
| Primary | Silica sol with zircon refractory | 40–50 s | White alumina WAF70 | ≥12 h air dry |
| Secondary | Ethyl silicate hydrolyzate with refractory powder | 37–42 s | Refractory sand, 36 mesh | ≥20 min dry, 10 min ammonia, ≥10 min forced air |
| Layers 3–8 | Ethyl silicate hydrolyzate with refractory powder | 13–15 s | Refractory sand, 24 mesh | ≥20 min dry, 10 min ammonia, ≥10 min forced air |
| Seal | Ethyl silicate hydrolyzate with refractory powder | 13–15 s | None | ≥12 h dry |
I modeled the effect of shell thinning with a simple one-dimensional heat-transfer argument. The heat flux through the shell is
$$q = h_{\text{eff}} A (T_m – T_s)$$
where \(h_{\text{eff}}\) is an effective heat-transfer coefficient, \(T_m\) is the metal temperature, and \(T_s\) is the shell temperature. When I reduce the local shell thickness, \(h_{\text{eff}}\) increases because the conductive resistance falls. The local cooling rate then increases:
$$\dot{T} = \frac{\partial T}{\partial t} \approx \frac{q}{\rho c_p V}$$
A higher \(\dot{T}\) reduces the local solidification time and shrinks the mushy zone. The Niyama criterion is often used to predict shrinkage porosity:
$$N = \frac{G}{\sqrt{\dot{T}}}$$
where \(G\) is the thermal gradient and \(\dot{T}\) is the cooling rate. A larger \(N\) generally indicates a lower risk of shrinkage porosity. By thinning the shell locally, I increased \(\dot{T}\) in the hot spot and improved the feeding behavior of the surrounding sections. In lost foam castings, the coating thickness and foam permeability play a similar role, so the same Niyama logic can be used as a first screening tool.
The shell preheat temperature also had to be controlled. A cold shell removes heat too quickly and can cause cold shut or misrun in thin sections. A very hot shell reduces the temperature gradient and can cause coarse grains, porosity, and poor directional solidification. I selected a preheat window of 950–1000 °C. This range improved filling without destroying the thermal gradient needed for feeding. The superheat above the liquidus is
$$\Delta T_{sh} = T_p – T_L$$
where \(T_p\) is the pouring temperature and \(T_L\) is the liquidus temperature. For K403, I chose \(T_p = 1430 \pm 10\) °C. This is a relatively high superheat for a complex shell casting, but it was necessary to fill thin sections and avoid cold shut. The risk of higher superheat is greater shrinkage and grain growth. I compensated by using local shell thinning, controlled preheat, and a sufficiently strong feeding path.
Pouring speed is another variable that I treated as a first-class parameter. The volume flow rate through the gating system can be expressed as
$$Q = A_g v_g$$
where \(A_g\) is the gate area and \(v_g\) is the metal velocity. The Reynolds number helps me judge whether the flow is likely to be smooth or turbulent:
$$Re = \frac{\rho v D_h}{\mu}$$
At high \(Re\), the flow can entrain gas and oxides, especially in lost foam castings where decomposition products must escape through the coating and sand. In this investment-cast shell, I wanted fast filling to prevent cold shut, but I also needed to avoid excessive turbulence and shell erosion. I selected a pour time of 2–3 s per mold. This window gave adequate filling speed while keeping the metal front stable. The selected casting parameters are shown below.
| Casting parameter | Selected value | Effect |
|---|---|---|
| Shell preheat temperature | 950–1000 °C | Improves filling and reduces thermal shock. |
| Pouring temperature | 1430 ± 10 °C | Provides superheat for thin sections. |
| Pouring speed | 2–3 s per mold | Balances filling and turbulence. |
| Local shell thinning | After fourth layer | Raises heat flux at hot spots. |
| Gating configuration | Eight inner gates | Improves distribution and feeding. |
I also examined the solidification front with a simple parabolic growth estimate:
$$x(t) = \sqrt{\frac{2 k (T_m – T_0) t}{\rho H_f}}$$
where \(x(t)\) is the solidified thickness, \(k\) is thermal conductivity, \(T_m\) is the melting or freezing temperature, \(T_0\) is the initial mold temperature, \(\rho\) is density, and \(H_f\) is latent heat. This equation is highly simplified, but it shows why shell preheat and local shell thickness matter so much. Increasing \(T_0\) reduces the driving temperature difference and slows solidification, while increasing local heat extraction has the opposite effect. The practical goal is not uniform cooling everywhere; it is directional cooling from thin sections toward feed paths and risers.
The gating system was designed not only to fill the cavity but also to act as a feeder. I used the modulus criterion, the feeding distance, and the local hot-spot map to place the gates and risers. The ideal is a sequence in which the thin sections freeze first, the intermediate sections freeze next, and the feed path remains liquid long enough to compensate shrinkage. This can be summarized as
$$t_{s,1} < t_{s,2} < \cdots < t_{s,n} < t_{\text{feed}}$$
where \(t_{s,i}\) is the solidification time of section \(i\) and \(t_{\text{feed}}\) is the time during which the feed path remains open. In lost foam castings, the feed path may be affected by foam decomposition pressure and coating permeability, but the underlying sequencing requirement is the same.
Defect analysis was a major part of my work. I separated defects by mechanism rather than by appearance alone. Porosity can be gas-driven, shrinkage-driven, or both. Cold shut and misrun are filling defects. Cracks can be hot tears or cold cracks. Dimensional deviation can come from wax assembly, shell restraint, solidification shrinkage, or machining location. I built a cause-and-countermeasure table to keep the program disciplined.
| Defect | Likely mechanism | Process lever I changed | Result |
|---|---|---|---|
| Shrinkage porosity | Insufficient feeding in thick hot spots. | Local shell thinning, gate redesign, higher gradient. | Reduced porosity in thick sections. |
| Gas porosity | Entrapped gas or decomposition products. | Pour speed control, shell permeability, venting. | Lower gas entrapment. |
| Cold shut | Low superheat or slow filling in thin sections. | Higher pouring temperature, preheat, faster pour. | Improved fill completeness. |
| Misrun | Insufficient fluidity and heat loss. | Shell preheat window and gating balance. | Fewer incomplete features. |
| Hot tear | Restraint during contraction. | Shell compliance, preheat uniformity, geometry review. | Lower crack frequency. |
| Dimensional deviation | Split wax pattern and assembly tolerance. | One-piece wax pattern and datum control. | Center shifts eliminated or reduced. |
| Flash or shell cracking | Local shell weakness or excessive metal pressure. | Shell reinforcement and slurry control. | Improved shell integrity. |
I also compared the physics of this investment casting route with lost foam castings because the two processes share several thermal and filling challenges. In lost foam castings, the pattern remains in the mold and decomposes as metal enters. That decomposition consumes heat, produces gas, and changes the local pressure. In investment casting, the wax is removed before pouring, so the mold cavity is open, but the shell still controls heat flow. In both lost foam castings and investment casting, the local cooling rate and the pressure field determine whether the last liquid region can be fed. I found that the shell-thinning concept used here has a useful analog in lost foam castings: the coating thickness and permeability can be adjusted locally to change heat transfer and gas escape. This cross-process thinking helped me avoid overfitting to one defect and instead address the underlying transport phenomena.
I validated the optimized process by pouring a trial batch of 40 castings. The first inspection combined visual examination, dimensional checking, and metallurgical evaluation. I used the yield formula
$$Y = \frac{N_{\text{good}}}{N_{\text{total}}} \times 100\%$$
to quantify the result. With 35 conforming castings out of 40, the yield was
$$Y = \frac{35}{40} \times 100\% = 87.5\%$$
This was a major improvement over the unstable early trials. The remaining nonconforming parts were reviewed to identify whether the defects were random or process-window related. Most were linked to edge-of-window conditions in pouring or shell handling, not to a fundamental design flaw. The validation results are summarized below.
| Validation item | Result | Interpretation |
|---|---|---|
| Castings poured | 40 | Production-representative trial batch. |
| Conforming castings | 35 | Met metallurgical and dimensional criteria. |
| Yield | 87.5% | Suitable for further batch production. |
| Primary defect reduction | Porosity and cold shut reduced | Shell thinning and pouring control worked. |
| Dimensional stability | Center shifts controlled | One-piece wax pattern solved assembly error. |
| Shell integrity | Fewer crack and flash events | Layered shell and local reinforcement worked. |
I also tracked dimensional capability because a casting can be metallurgically sound but still fail the drawing. For a critical dimension with upper specification limit \(USL\), lower specification limit \(LSL\), mean \(\mu\), and standard deviation \(\sigma\), the capability indices are
$$C_p = \frac{USL – LSL}{6\sigma}$$
and
$$C_{pk} = \min\left( \frac{USL – \mu}{3\sigma}, \frac{\mu – LSL}{3\sigma} \right)$$
Before the one-piece wax pattern change, the center-shift problem was so large that \(C_{pk}\) for some features was effectively negative relative to the tolerance zone. After the change, the mean shifted back toward nominal and the spread narrowed. I did not rely only on the final inspection; I also added intermediate checks after wax injection, after shell building, and after casting cleanup. That allowed me to separate wax-induced error from shell-induced and solidification-induced error.
| Stage | Control point | Purpose |
|---|---|---|
| Wax pattern | Dimensions and datum features | Detect injection shrinkage and warpage early. |
| Shell | Thickness, cracks, local thinning | Ensure thermal design is realized. |
| Pouring | Temperature and time | Maintain filling and feeding window. |
| Post-cast | X-ray, visual, dimensional | Confirm internal and external quality. |
| Final | Critical dimensions and microstructure | Release for downstream operations. |
The process window I established can be summarized as a compact set of operating rules. I found that the following conditions were necessary for stable K403 shell castings:
| Process area | Key variable | Optimized window | Primary defect controlled |
|---|---|---|---|
| Wax injection | Wax temperature | 55–63 °C | Cold shut, sink, flow lines |
| Wax injection | Die temperature | 25–35 °C | Surface finish, shrinkage |
| Wax injection | Injection pressure | 15–25 bar | Incomplete fill, flash |
| Wax injection | Hold time | 15–20 s | Sink marks, dimensional drift |
| Shell building | Primary viscosity | 40–50 s | Surface roughness |
| Shell building | Backup viscosity | 13–15 s | Shell strength and permeability |
| Shell building | Local thinning | After fourth layer | Hot-spot porosity |
| Shell preheat | Temperature | 950–1000 °C | Cold shut, thermal shock |
| Pouring | Metal temperature | 1430 ± 10 °C | Misrun, cold shut, porosity |
| Pouring | Pour time | 2–3 s per mold | Incomplete fill, turbulence |
In lost foam castings, a similar table would include foam density, bead fusion, coating thickness, coating permeability, sand compaction, and pouring temperature. Although I did not produce lost foam castings in this program, I used the same systems view. The defect map for lost foam castings often includes collapse, gas porosity, incomplete fill, and carbon pick-up. The defect map for this investment-cast K403 shell included porosity, cold shut, hot tearing, and dimensional deviation. The common thread is that filling and feeding must be balanced against local heat transfer. When I see a hot spot in any casting process, including lost foam castings, I immediately ask whether the local thermal resistance can be reduced, whether the feed path can be improved, and whether the filling front can arrive before the section freezes.
I also used a simple heat-balance check to ensure that the shell-thinning step would not over-cool the thin sections. The total heat to be removed from a local volume is approximately
$$Q_{\text{total}} = \rho V \left[ c_p (T_p – T_s) + H_f \right]$$
where \(c_p\) is specific heat, \(T_p\) is pouring temperature, \(T_s\) is solidus temperature, and \(H_f\) is latent heat. The shell must absorb and conduct this heat without causing premature freezing of the feed path. In lost foam castings, the foam decomposition also consumes energy, so the effective heat balance includes an additional term:
$$Q_{\text{total, LFC}} = \rho V \left[ c_p (T_p – T_s) + H_f \right] + Q_{\text{decomp}}$$
That additional term is one reason lost foam castings can be sensitive to pattern density and coating design. Even though my production part was not a lost foam casting, recognizing this difference helped me avoid transferring parameters blindly from one process to another. I used the investment casting shell as the dominant heat-transfer resistance here, whereas in lost foam castings the foam and coating resistances are more strongly coupled to filling.
I further analyzed the feeding resistance using a pressure-balance view. For a liquid metal to feed a shrinking section, the pressure available at the feed path must overcome viscous and capillary resistance. A simplified form is
$$\Delta P_{\text{feed}} = \frac{8 \mu L Q}{\pi R^4}$$
If \(\Delta P_{\text{feed}}\) is too large for the available metallostatic head, the feed path will not supply enough liquid and shrinkage porosity will form. In lost foam castings, the pressure balance is complicated by gas pressure from foam decomposition, which can either assist or oppose filling depending on venting and coating permeability. In this K403 shell, I improved the pressure balance by increasing the gate area, shortening the feed path where possible, and raising the local thermal gradient so that the feed path remained open longer. The modulus criterion and the pressure criterion together guided the final gating layout.
I also found it useful to express the local solidification gradient as
$$G = \frac{\partial T}{\partial x}$$
and the cooling rate as
$$\dot{T} = \frac{\partial T}{\partial t}$$
The ratio \(G/\sqrt{\dot{T}}\), already introduced as the Niyama criterion, is a compact way to compare hot spots. When I thinned the shell locally, I increased \(\dot{T}\) and therefore reduced \(N\) if \(G\) stayed constant. However, I also improved the gradient by feeding from a hotter riser and by avoiding a fully uniform shell thickness. The practical result was a local shift from a mushy, poorly fed region to a region with a more favorable directional gradient. This is exactly the kind of trade-off that also appears in lost foam castings, where local coating changes can alter both cooling and gas venting.
My dimensional-control plan relied on three principles. First, the wax pattern should be as close to net shape as possible, with a one-piece design whenever feasible. Second, shrinkage compensation must be based on measured data, not on a single handbook value. Third, the shell and casting must be supported so that gravity and restraint do not introduce distortion. I used the following shrinkage relation for tooling compensation:
$$L_{\text{tool}} = \frac{L_{\text{final}}}{1 – S}$$
where \(L_{\text{final}}\) is the desired final length and \(S\) is the linear shrinkage. For a complex alloy such as K403, \(S\) is not uniform in all directions because section thickness, gating, and shell restraint vary. I therefore applied directional compensation to the critical features and verified it with coordinate measurements. This is also sound practice for lost foam castings, although the pattern shrinkage and coating deformation can introduce additional anisotropy.
I considered the mechanical property consequences of the process changes. A sound casting with a fine, uniform microstructure is generally preferable for high-temperature service. Excessive superheat and slow cooling can coarsen the gamma-prime distribution and reduce fatigue resistance. Local shell thinning can help refine the microstructure in hot spots, but it must not create a cold shut in nearby thin sections. I therefore treated the process window as a compromise:
$$T_{\text{cold shut}} < T_p < T_{\text{grain growth}}$$
and
$$t_{\text{fill,min}} < t_{\text{pour}} < t_{\text{erosion,max}}$$
where \(T_{\text{cold shut}}\) is the minimum temperature for complete filling, \(T_{\text{grain growth}}\) is the temperature above which microstructural coarsening becomes unacceptable, \(t_{\text{fill,min}}\) is the minimum time needed for filling, and \(t_{\text{erosion,max}}\) is the maximum time before shell erosion or excessive heat loss becomes critical. This window concept is directly transferable to lost foam castings, where the upper temperature limit may also be constrained by foam degradation and gas defects.
I also reviewed the shell system for strength and permeability. The shell must resist the metallostatic pressure and the thermal shock of pouring. A useful estimate of the hoop stress in a cylindrical shell section is
$$\sigma_{\theta} = \frac{P r}{\delta}$$
where \(P\) is internal pressure, \(r\) is radius, and \(\delta\) is shell thickness. This equation shows why local shell thinning must be limited. If \(\delta\) is reduced too much, \(\sigma_{\theta}\) rises and the shell may crack or flash. I therefore combined local thinning with local reinforcement where the pressure was highest. In lost foam castings, the coating must also resist metal pressure while allowing gas to escape, so the same strength-permeability trade-off appears in a different form.
The permeability of the shell and the escape of gas are especially important in lost foam castings. In this investment casting process, gas entrapment was less severe because the wax pattern had been removed, but air and binder decomposition products still had to escape. I ensured adequate drying and curing of each shell layer. The drying and ammonia-curing times in the shell table were not arbitrary; insufficient drying can leave residual moisture, which produces gas defects and shell spalling. Excessive drying can create microcracks. The process window for shell drying is therefore bounded:
$$t_{\text{dry,min}} < t_{\text{dry}} < t_{\text{dry,max}}$$
where the lower bound prevents residual moisture and the upper bound prevents excessive brittleness. This is another example of a control logic that also applies to lost foam castings, although the coating chemistry and drying mechanisms differ.
I used the validation batch to confirm that the optimized parameters were stable over multiple molds. The 87.5% yield was not achieved by sorting; it came from reducing the defect frequency at the source. I inspected the rejected parts and found that most were associated with edge conditions such as a slightly low shell preheat, a slightly slow pour, or a local shell repair. This told me that the process window was valid but needed tight monitoring. I therefore defined control limits for the key variables and made them part of the work instructions. The following table summarizes the relationship between process control and defect prevention.
| Control variable | Lower risk if too low | Upper risk if too high | Preferred control action |
|---|---|---|---|
| Wax temperature | Cold shut, incomplete fill | Shrinkage, flow lines | Hold at 55–63 °C. |
| Die temperature | Poor surface, short shots | Long cycle, shrinkage | Hold at 25–35 °C. |
| Injection pressure | Incomplete corners | Flash, sticking | 15–25 bar with monitoring. |
| Hold time | Sink marks, dimensional drift | Cycle loss, die wear | 15–20 s. |
| Shell preheat | Cold shut, thermal shock | Coarse structure, porosity | 950–1000 °C. |
| Pouring temperature | Misrun, cold shut | Shrinkage, grain growth | 1430 ± 10 °C. |
| Pouring time | Incomplete fill | Turbulence, erosion | 2–3 s per mold. |
| Shell thinning | Weak shell, flash | Hot spot, porosity | Local and after fourth layer. |
I also considered the role of alloy cleanliness and melting practice. K403 contains reactive elements such as Ti and Al, so vacuum melting and pouring are necessary to avoid oxidation and nitrogen pickup. Cleanliness affects fluidity and defect formation. A contaminated melt can have lower effective fluidity even at the correct superheat. The fluidity length can be expressed qualitatively as
$$L_f = f\left( T_p, \Delta T_{sh}, \mu, \sigma, k, c_p, H_f \right)$$
where \(L_f\) is the flow distance before freezing. Increasing superheat and reducing viscosity increase \(L_f\), but excessive superheat can increase shrinkage and gas absorption. This is why I did not simply raise the pouring temperature to the maximum. Instead, I combined a moderate high superheat with shell preheat, fast pouring, and local shell thinning. In lost foam castings, the same fluidity logic applies, but the foam decomposition gases can alter the effective back pressure and the local heat transfer, so the optimum pouring temperature may differ.
The gating system was also designed to avoid direct impingement on the shell walls. Direct impingement can cause shell erosion, local overheating, and turbulence. I used a runner and gate arrangement that distributed metal around the part and fed the thick sections from multiple directions. The eight inner gates provided a balanced fill. The outer feed path acted as a feeder and helped maintain a positive temperature gradient toward the hot spots. This is a standard directional-solidification strategy, but it required adjustment because the part has multiple hot spots and a long support column. In lost foam castings, the gate placement must also account for foam decomposition and gas evacuation, so the same directional principle may require additional vents and coating control.
I performed a root-cause review after the validation batch. The main remaining defects were minor and mostly related to handling or edge-of-window conditions. I grouped them into three categories: shell-related, pour-related, and pattern-related. Shell-related defects included small surface imperfections and occasional local cracks. Pour-related defects included isolated cold shut at the far end of a thin section. Pattern-related defects included small dimensional drift. I then made targeted improvements. For example, I tightened the shell repair procedure, added a pre-pour shell inspection, and introduced a more precise pour-time measurement. These actions increased the robustness of the process without changing the basic parameter windows. I also noted that similar actions are useful in lost foam castings, where coating damage and incomplete foam removal can cause local defects.
The final process flow I established can be summarized as follows: one-piece wax pattern, controlled wax injection, layered shell with local thinning after the fourth layer, shell preheat to 950–1000 °C, vacuum melting and pouring at 1430 ± 10 °C, pour time 2–3 s per mold, controlled cooling, and staged inspection. Each step has a measurable output. The wax pattern is checked for dimensions and surface quality. The shell is checked for thickness, cracks, and local thinning. The pour is checked for temperature and time. The casting is checked by visual, X-ray, and dimensional methods. This closed-loop approach is what turned an unstable trial process into a repeatable production process. I believe the same closed-loop discipline is necessary for lost foam castings, because the process has many coupled variables and small drifts can produce large defects.
I also developed a simple process-capability monitoring plan. For critical dimensions, I calculated \(C_p\) and \(C_{pk}\) after each batch. For metallurgical quality, I used defect rate and severity. For process control, I tracked wax temperature, die temperature, injection pressure, hold time, shell viscosity, shell preheat, pouring temperature, and pour time. The acceptance criteria can be written as
$$C_{pk} \geq 1.33$$
for critical dimensions and
$$D_{\text{rate}} = \frac{N_{\text{defective}}}{N_{\text{total}}} \leq D_{\text{target}}$$
for defect rate. The 87.5% yield corresponds to a defect rate of 12.5% in the trial batch, but many of those defects were edge-of-window and were eliminated in later monitoring. The important result was not only the yield itself but the demonstration that the process could be controlled. In lost foam castings, a similar capability approach is valuable because the process is often more sensitive to pattern and coating variation.
| Metric | Target | Observed in validation | Action if not met |
|---|---|---|---|
| Yield | ≥85% | 87.5% | Maintain current window. |
| Critical dimension \(C_{pk}\) | ≥1.33 | Improved after one-piece pattern | Check wax and shell datum. |
| Porosity severity | Acceptable per standard | Reduced | Adjust local shell thinning. |
| Cold shut | Zero critical | Reduced | Raise preheat or pour temperature. |
| Shell cracking | Low | Controlled | Reinforce local shell. |
| Dimensional shift | Within tolerance | Controlled | Review tooling compensation. |
I also reflected on the wider transferability of this work. The K403 shell casting problem is a good example of how process optimization should follow defect physics. I did not begin by changing every parameter at once. I began by identifying the dominant mechanisms: hot-spot shrinkage, thin-section freezing, gas entrapment, and assembly-induced dimensional error. Then I selected a small number of powerful levers: one-piece wax pattern, local shell thinning, controlled preheat, higher pouring temperature, faster pour, and a balanced gating system. This order of operations is equally useful for lost foam castings, where the most common mistake is to adjust many variables without understanding whether the defect is caused by filling, gas, coating, or pattern quality. In lost foam castings, the pattern is consumed, so the process signature is different, but the diagnostic logic is similar.
The thermal equations I used are not a substitute for trial data, but they gave me a structured way to interpret the trials. For example, when I reduced local shell thickness, the heat flux increased according to
$$q = \frac{\Delta T}{R_{th}}$$
and the local solidification time decreased according to the Chvorinov relationship. When I increased pouring temperature, the superheat increased according to
$$\Delta T_{sh} = T_p – T_L$$
and the fluidity improved. When I increased pouring speed, the fill time decreased and the risk of cold shut fell, but the Reynolds number increased and the risk of turbulence rose. The final window was therefore a compromise between filling and feeding, between fluidity and shrinkage, and between shell strength and local cooling. This compromise is the essence of casting process design, and it applies to lost foam castings as much as to investment casting.
I also paid attention to the interaction between the shell and the alloy. K403 has a relatively high aluminum and titanium content, so it can react with certain mold materials if the shell is not properly formulated. The primary zircon layer provided a stable interface, while the backup layers provided strength. I did not change the alloy chemistry; instead, I controlled the thermal and physical process around it. In lost foam castings, the alloy can also interact with decomposition products, so coating chemistry and permeability are critical. The principle I followed was to keep the interface stable and to ensure that any gas generated could escape without being trapped in the casting.
The final acceptance of the process was based on several criteria. First, the castings had to meet the metallurgical standard for internal soundness. Second, the critical dimensions had to be within tolerance. Third, the surface finish had to be acceptable for downstream processing. Fourth, the process had to be repeatable across multiple molds. The validation batch met these criteria with an 87.5% yield. I considered this sufficient to move the process into batch production. I also documented the process windows and control points so that future operators could reproduce the result. This documentation is important in any foundry, and it is especially important in lost foam castings, where subtle changes in foam or coating can shift the process window.
| Acceptance criterion | Method | Outcome |
|---|---|---|
| Internal soundness | X-ray and sectioning | Porosity reduced; no critical shrinkage. |
| Dimensional accuracy | Coordinate measurement | Center shifts controlled. |
| Surface quality | Visual and roughness check | Acceptable after shell control. |
| Process repeatability | Multiple mold trial | 87.5% yield over 40 castings. |
| Shell integrity | Pre-pour inspection | Fewer cracks and flash events. |
| Microstructure | Metallographic review | No unacceptable coarsening. |
I also compared the relative impact of the changes I made. The one-piece wax pattern had the greatest effect on dimensional accuracy. Local shell thinning had the greatest effect on shrinkage porosity. Pouring temperature and pour time had the greatest effect on cold shut and misrun. Shell preheat had a combined effect on filling and thermal gradient. Gating design had a strong effect on feeding and on the overall process window. This ranking helped me prioritize controls. In lost foam castings, the ranking might differ because foam density and coating permeability could dominate, but the method of ranking by defect mechanism remains valid.
| Change | Main defect addressed | Relative impact | Why it worked |
|---|---|---|---|
| One-piece wax pattern | Dimensional deviation | High | Removed assembly tolerance stack. |
| Local shell thinning | Shrinkage porosity | High | Increased local cooling rate. |
| Shell preheat window | Cold shut, misrun | High | Improved fluidity and reduced thermal shock. |
| Pouring temperature | Cold shut, filling | High | Increased superheat and fluidity. |
| Pouring speed | Incomplete fill | Medium–high | Reduced heat loss before fill completion. |
| Gating redesign | Feeding, turbulence | Medium–high | Balanced flow and directional solidification. |
| Shell layer control | Shell cracking, gas | Medium | Improved strength and permeability. |
I concluded that the optimized process is not merely a set of numbers. It is a controlled thermal and dimensional system. The K403 shell casting is difficult because it combines thin walls, thick hot spots, a long support column, and tight tolerances. The process must simultaneously fill the thin sections and feed the thick sections. It must also avoid gas entrapment, shell cracking, and distortion. I achieved this by combining a one-piece wax pattern, a graded shell with local thinning, a high but controlled shell preheat, a moderate high pouring temperature, a fast but stable pour, and a balanced gating system. The result was a validation yield of 87.5%, with 35 conforming castings from 40 poured. I consider this a solid basis for batch production and for further optimization. The same systems approach can be applied to lost foam castings, where filling, gas evolution, coating permeability, and solidification must be balanced in a similar way.
In my final assessment, I found that the most important lesson is to treat every defect as a signal from a specific transport process. Shrinkage porosity signals a feeding problem. Cold shut signals a heat-loss or fluidity problem. Dimensional deviation signals a tooling or restraint problem. Shell cracking signals a strength or pressure problem. Once the signal is correctly interpreted, the solution becomes more obvious. For this K403 shell casting, the solutions were one-piece tooling, local shell thinning, controlled preheat, higher pouring temperature, faster pour, and balanced gating. For lost foam castings, the same diagnostic discipline can be used, but the specific levers may include foam density, bead fusion, coating permeability, sand compaction, and venting. I believe this cross-process perspective is valuable because it prevents the engineer from treating each foundry method as isolated. The physics of heat, mass, and momentum transfer is shared, even when the pattern material and mold system differ.
I also documented the equations that were most useful during the project. They are collected below as a compact process toolbox.
| Purpose | Equation | Use in this work |
|---|---|---|
| Modulus | $$M = \frac{V}{A}$$ | Ranked feeding resistance among sections. |
| Feeding criterion | $$M_r \geq 1.2 M_c$$ | Checked riser and gate adequacy. |
| Solidification time | $$t_s = B \left( \frac{V}{A} \right)^n$$ | Estimated local freezing order. |
| Heat flux | $$q = \frac{\Delta T}{R_{th}}$$ | Evaluated shell-thinning effect. |
| Thermal resistance | $$R_{th} = \frac{\delta}{k A}$$ | Linked shell thickness to cooling. |
| Wax flow | $$Q = \frac{\pi R^4 \Delta P}{8 \mu L}$$ | Balanced injection pressure and temperature. |
| Wax shrinkage | $$\Delta V = \alpha_v V_0 \Delta T$$ | Controlled wax temperature and hold time. |
| Niyama criterion | $$N = \frac{G}{\sqrt{\dot{T}}}$$ | Assessed shrinkage porosity risk. |
| Superheat | $$\Delta T_{sh} = T_p – T_L$$ | Set pouring temperature window. |
| Reynolds number | $$Re = \frac{\rho v D_h}{\mu}$$ | Managed turbulence during pouring. |
| Yield | $$Y = \frac{N_{\text{good}}}{N_{\text{total}}} \times 100\%$$ | Quantified validation batch success. |
| Capability | $$C_{pk} = \min\left( \frac{USL – \mu}{3\sigma}, \frac{\mu – LSL}{3\sigma} \right)$$ | Monitored dimensional control. |
| Shell hoop stress | $$\sigma_{\theta} = \frac{P r}{\delta}$$ | Limited local shell thinning. |
| Heat balance | $$Q_{\text{total}} = \rho V \left[ c_p (T_p – T_s) + H_f \right]$$ | Checked local cooling demand. |
I also prepared a summary of the main process windows for future reference. This table is the practical output of the study and can be used as a starting point for similar K403 shell castings. It is not a universal recipe, because the optimum depends on geometry, shell system, and equipment, but it is a validated baseline.
| Process step | Parameter | Validated window |
|---|---|---|
| Wax injection | Wax temperature | 55–63 °C |
| Wax injection | Die temperature | 25–35 °C |
| Wax injection | Injection pressure | 15–25 bar |
| Wax injection | Hold time | 15–20 s |
| Primary shell | Viscosity | 40–50 s |
| Secondary shell | Viscosity | 37–42 s |
| Backup shell | Viscosity | 13–15 s |
| Shell thinning | Timing | After fourth layer |
| Shell preheat | Temperature | 950–1000 °C |
| Pouring | Temperature | 1430 ± 10 °C |
| Pouring | Time | 2–3 s per mold |
| Gating | Inner gates | Eight balanced gates |
In summary, I transformed an unstable K403 shell casting process into a repeatable one by addressing the root causes of porosity, cold shut, dimensional error, and shell-related defects. The key changes were a one-piece wax pattern, local shell thinning after the fourth coating, a shell preheat of 950–1000 °C, a pouring temperature of 1430 ± 10 °C, a pour time of 2–3 s per mold, and a balanced eight-gate feeding system. The validation batch produced 35 acceptable castings from 40 poured, a yield of 87.5%. I consider the process suitable for batch production and for further refinement. The same logic can be extended to lost foam castings, where the pattern is different but the transport phenomena are still governed by filling, heat transfer, gas evolution, and solidification. By using equations, tables, and defect-mechanism mapping, I was able to make the process visible, controllable, and repeatable. This is the approach I would use again for similar high-temperature alloy shell castings, and it is the approach I recommend when transferring lessons to lost foam castings or other near-net-shape casting routes.