
I work at the intersection of additive manufacturing, tooling engineering, and precision casting, and I have repeatedly seen how the quality of a wax pattern determines the final quality of a cast component. In 3D-printed investment casting, the wax pattern is not merely a temporary shape; it is the dimensional and geometric bridge between digital design and metallic solidification. When I compare this process with lost foam castings, I find the same fundamental challenge: a sacrificial pattern must carry dimensional intent through shrinkage, coating, handling, dewaxing or vaporization, pouring, and cooling. In lost foam castings, the foam pattern decomposes and is replaced by metal, while in investment casting the wax pattern is removed to create a ceramic cavity. Both routes require a coordinated relationship between pattern geometry, mold or shell behavior, and process parameters. My purpose here is to describe a collaborative wax–mold design method that I developed and validated for 3D-printed investment casting, and to show how its logic can also inform improvements in lost foam castings.
Traditional practice often separates wax pattern design from mold design. One engineer or team defines the wax pattern, another defines the mold cavity, and process parameters are adjusted later. I have found that this serial approach creates hidden errors. Wax shrinkage may be compensated in one direction but not in another. Mold elastic deformation may be ignored until trial pours reveal dimensional drift. Assembly constraints may force rework after the first article inspection. In lost foam castings, a similar serial pattern can appear when the foam pattern is designed independently of the refractory coating, sand compaction, and pouring strategy. To overcome this, I propose a multidimensional collaborative framework that links pattern dimensions, mold geometry, material properties, process parameters, and multi-objective optimization. The framework does not eliminate the need for experimental validation, but it reduces the number of physical iterations and makes the remaining iterations more informative.
1. Process Principle and Coupled Performance Requirements
The 3D-printed investment casting route combines the geometric freedom of additive manufacturing with the surface quality and detail reproduction of investment casting. I treat the process as a chain of coupled transformations. The first transformation is digital-to-wax: a three-dimensional model is sliced and printed layer by layer using a wax-like material. The second is wax-to-shell: the wax pattern is assembled onto a tree and coated with refractory slurries and stucco. The third is shell-to-cavity: the wax is removed by heating, leaving a negative cavity. The fourth is cavity-to-metal: molten metal fills the cavity and solidifies. The fifth is metal-to-finished part: the shell is removed, and the casting is cleaned, heat treated, and inspected. Each transformation introduces shrinkage, stress, or geometric deviation. The key to precision is not to treat these deviations independently but to compensate for them through a shared design model.
The same logic appears in lost foam castings, where a foam pattern is coated, embedded in unbonded sand, and replaced by metal. In lost foam castings, the pattern is not removed before pouring; it vaporizes as the metal advances. The coating must allow vapor escape while resisting metal penetration. The sand must support the coating without collapsing. The pattern must be dimensionally stable enough to survive coating and compaction. Therefore, lost foam castings also require a coupled view of pattern, coating, mold, and process. I use this analogy to emphasize that collaborative design is not unique to investment casting; it is a general requirement for sacrificial-pattern casting routes.
The process sequence I analyze can be summarized as follows. First, a digital model is prepared with printing allowances. Second, wax material and printer parameters are qualified. Third, the wax pattern is printed and inspected. Fourth, the pattern is assembled into a tree. Fifth, ceramic shell layers are applied and dried. Sixth, dewaxing creates the internal cavity. Seventh, the shell is fired to remove residues and develop strength. Eighth, molten metal is poured into the hot shell. Ninth, the shell is removed and the casting is finished and tested. This sequence is illustrated by the following figure.
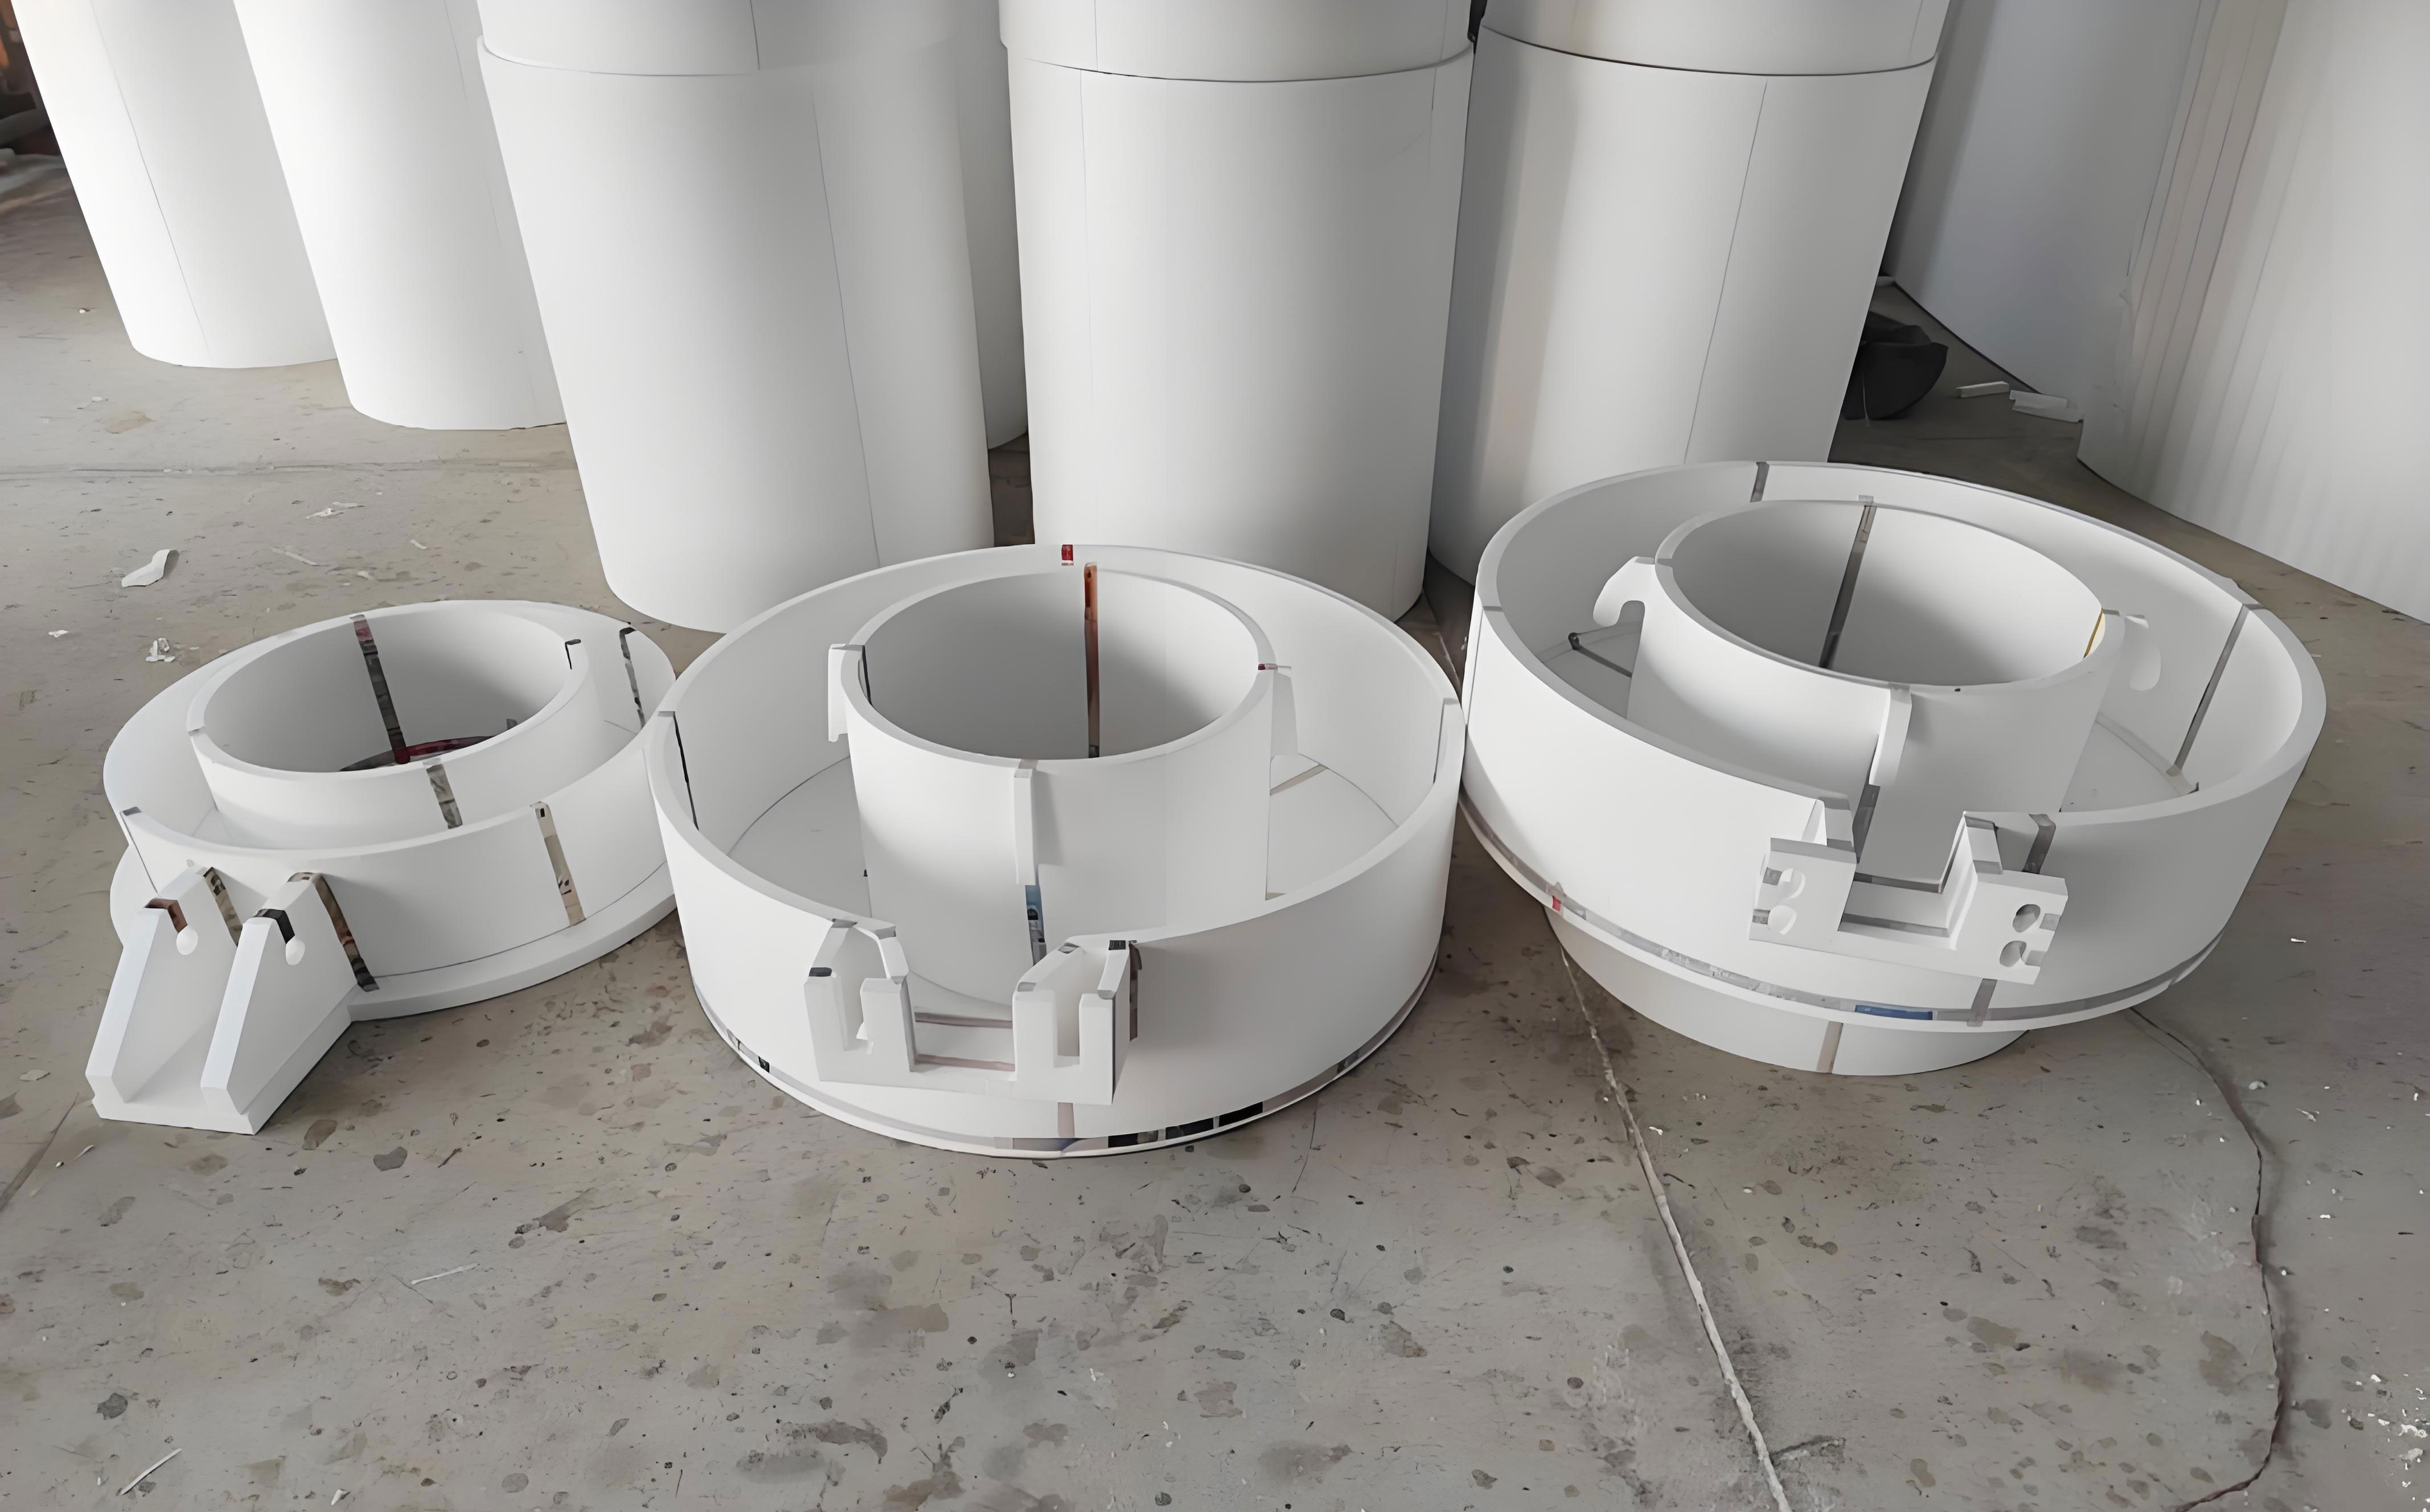
Table 1 lists the major process steps, the physical phenomena I monitor, and the typical control variables. I use this table as a checklist during collaborative design reviews because it prevents the team from optimizing one step while ignoring its effect on another.
| Step | Operation | Dominant phenomenon | Control variables | Typical target |
|---|---|---|---|---|
| 1 | Digital model preparation | Geometry transfer, support placement | Layer thickness, orientation, shrinkage allowance | Layer thickness ≤ 0.1 mm |
| 2 | Wax printing | Thermal contraction, layer bonding | Nozzle temperature, chamber temperature, print speed | Linear shrinkage 1.5% ± 0.2% |
| 3 | Pattern inspection | Surface deviation, internal porosity | Optical scanning, mass check, visual inspection | Surface roughness Ra ≤ 1.6 μm after mold compensation |
| 4 | Tree assembly | Joint stress, alignment error | Gate diameter, assembly angle, wax weld quality | Position error ≤ 0.1 mm |
| 5 | Shell making | Coating thickness, drying stress | Slurry viscosity, stucco size, drying humidity | Shell thickness 5–8 mm |
| 6 | Dewaxing | Wax expansion, shell cracking | Heating rate, pressure, hold time | Residual wax ≤ 0.1% |
| 7 | Firing | Sintering, organic burnout | Peak temperature, atmosphere, cooling rate | Shell strength ≥ 3 MPa |
| 8 | Pouring | Fluid flow, solidification shrinkage | Pouring temperature, vacuum level, mold preheat | Metal pressure 5–10 MPa |
| 9 | Finishing | Residual stress, dimensional release | Cutoff, grinding, heat treatment | Final tolerance ≤ ±0.08 mm |
I model wax shrinkage as a first-order dimensional contraction that depends on material, thermal history, and geometry. For a measured length \(L_0\) before shrinkage and \(L_f\) after shrinkage, the linear shrinkage is:
$$ \epsilon_w = \frac{L_0 – L_f}{L_0} \times 100\% = 1.5\% \pm 0.2\% $$
For aluminum alloy castings, the cooling contraction from liquidus to room temperature is much larger. I use a nominal value of 6.5% for the alloy family I tested, but the exact value depends on composition, mold temperature, and restraint. The combined dimensional transfer from pattern to casting can be written as:
$$ L_c = L_p (1 + \epsilon_w)(1 + \epsilon_a) – \Delta_m – \Delta_s $$
where \(L_p\) is the pattern dimension, \(\epsilon_w\) is wax shrinkage, \(\epsilon_a\) is alloy contraction, \(\Delta_m\) is mold elastic recovery, and \(\Delta_s\) is shell or sand restraint. In lost foam castings, an analogous expression would replace wax shrinkage with foam pattern shrinkage and add coating deformation and sand compaction effects. The equation is simple, but it captures the central reason why independent design fails: every term is coupled to the others through geometry and process history.
During pouring, the molten metal applies a dynamic pressure to the mold wall. I approximate the pressure history as:
$$ p(t) = p_0 + A \sin(\omega t) $$
where \(p_0\) is the static head pressure, \(A\) is the dynamic amplitude, and \(\omega\) is related to filling speed and gate geometry. For the investment casting cases I studied, the peak pressure on the mold wall is typically 5–10 MPa. This pressure is transmitted through the mold structure to the wax pattern locating features if the mold is not sufficiently rigid. The result can be local plastic deformation of the wax pattern or shell, especially near thin walls and sharp corners. In lost foam castings, a comparable pressure acts on the coating and sand, and the pattern is already vaporizing; therefore, coating permeability and sand stiffness become part of the same load path. This is another reason I treat collaborative design as a load-path problem rather than a drawing-matching exercise.
Table 2 summarizes the key design constraints I use in the collaborative framework. I derived these constraints from dimensional accuracy requirements, structural integrity, and demolding feasibility. They are not arbitrary; each one corresponds to a failure mode observed in trial runs.
| Design element | Wax pattern constraint | Mold constraint | Collaborative condition |
|---|---|---|---|
| Dimensional precision | Print layer thickness ≤ 0.1 mm | Cavity roughness Ra ≤ 1.6 μm | Compensated dimensional error ≤ ±0.08 mm |
| Structural rigidity | Minimum wall thickness ≥ 0.8 mm | Minimum cavity wall thickness ≥ 3 mm | Contact pressure ≤ 1.5 MPa |
| Demolding performance | Draft angle ≥ 3° | Demolding force ≤ 50 N | Undercut depth ≤ 0.5 mm |
| Thermal stability | Wax softening point > 70 °C | Mold tempering stability > 200 °C | Thermal mismatch strain ≤ 0.2% |
| Flow and filling | Gate transition radius ≥ 1 mm | Venting area sufficient for vapor escape | Pressure drop ≤ 15% across cavity |
| Surface integrity | No visible layer steps on critical faces | No tool marks on sealing surfaces | Ra ≤ 1.2 μm on functional surfaces |
2. Coupled Characteristics of the Composite Process
I analyze the composite process through two coupled chains: the shrinkage compensation chain and the load transfer path. The shrinkage compensation chain begins with the digital model and ends with the solidified casting. The load transfer path begins with pouring pressure and ends with pattern or shell deformation. If either chain is broken, the final casting deviates from the nominal design. In lost foam castings, the same two chains exist, but the pattern material and mold medium are different. Recognizing this similarity helped me generalize the design method beyond a single process route.
The shrinkage compensation chain can be expressed as a product of compensation factors. If the nominal dimension is \(D_n\), then the compensated mold cavity dimension \(D_m\) is:
$$ D_m = D_n (1 + c_s) + \delta_t $$
where \(c_s\) is the total shrinkage compensation coefficient and \(\delta_t\) is a thermal correction term. I decompose \(c_s\) into wax, alloy, and mold contributions:
$$ c_s = c_w + c_a – c_r $$
Here \(c_w\) is wax shrinkage compensation, \(c_a\) is alloy contraction compensation, and \(c_r\) is mold elastic recovery. In my experiments, \(c_w \approx 0.015\), \(c_a \approx 0.065\), and \(c_r\) ranged from 0.002 to 0.008 depending on mold stiffness. The compensation is not simply additive in all directions because thin walls restrain contraction differently from thick sections. Therefore, I apply direction-dependent compensation factors:
$$ c_s^{(x)} = c_w^{(x)} + c_a^{(x)} – c_r^{(x)} $$
$$ c_s^{(y)} = c_w^{(y)} + c_a^{(y)} – c_r^{(y)} $$
$$ c_s^{(z)} = c_w^{(z)} + c_a^{(z)} – c_r^{(z)} $$
For lost foam castings, I would replace \(c_w\) with a foam pattern shrinkage term and include coating and sand compaction terms. The mathematical structure remains the same, which is why I consider collaborative design a transferable methodology.
The load transfer path is governed by contact pressure at the wax–mold interface. I define the contact pressure \(p_c\) as:
$$ p_c = \frac{F_d}{A_c} \le 1.5 \text{ MPa} $$
where \(F_d\) is the dynamic force transmitted through the mold and \(A_c\) is the contact area. If the contact pressure exceeds the allowable value, the wax pattern may deform plastically, especially if the local wall thickness is below 0.8 mm. To prevent this, I add local stiffeners to the mold or increase the wax wall thickness. In lost foam castings, the same principle applies to the coating and sand interface, because excessive compaction pressure can crush the foam pattern or distort the coating.
I also consider the thermal mismatch between the wax pattern and the mold. The differential strain \(\Delta \epsilon\) is:
$$ \Delta \epsilon = (\alpha_m – \alpha_w) \Delta T $$
where \(\alpha_m\) and \(\alpha_w\) are the coefficients of thermal expansion for the mold and wax, respectively, and \(\Delta T\) is the temperature change. For the materials I used, \(\alpha_m\) for H13 tool steel is approximately \(12 \times 10^{-6} \text{ K}^{-1}\), while the wax is much higher, often above \(100 \times 10^{-6} \text{ K}^{-1}\). This mismatch is significant during cooling, so I do not rely on thermal expansion alone to compensate shrinkage. Instead, I use a combination of geometric compensation and process temperature control.
Table 3 presents the coupled characteristics I quantify during design. I use this table to assign ownership: the wax pattern designer, the mold designer, and the process engineer each see which variables they control and which variables they must negotiate.
| Characteristic | Symbol | Typical value | Design action | Failure mode if ignored |
|---|---|---|---|---|
| Wax linear shrinkage | \(\epsilon_w\) | 1.5% ± 0.2% | Scale cavity dimensions | Undersized casting |
| Alloy cooling contraction | \(\epsilon_a\) | 6.5% | Add alloy compensation | Shrinkage porosity or dimensional drift |
| Mold elastic deformation | \(\delta_m\) | 0.01–0.05 mm | Topology optimization | Wall thickness variation |
| Contact pressure | \(p_c\) | ≤ 1.5 MPa | Increase local stiffness | Wax deformation, flash |
| Demolding force | \(F_e\) | ≤ 50 N | Increase draft angle | Surface tearing, sticking |
| Thermal mismatch strain | \(\Delta \epsilon\) | ≤ 0.2% | Control temperature ramp | Warping, cracking |
| Vapor escape resistance | \(R_v\) | Process-specific | Optimize coating permeability | Gas defects, incomplete filling |
3. Collaborative Design Method
I construct the collaborative design method in three layers: parametric modeling, topology optimization, and multi-objective optimization. Each layer feeds the others. Parametric modeling makes the design adjustable. Topology optimization improves the mold structure and material distribution. Multi-objective optimization searches for the best combination of dimensions, angles, and process parameters. I do not treat these layers as a linear sequence; I iterate among them until the design satisfies the coupled constraints.
3.1 Parametric Modeling
I begin with a parametric model of the wax pattern and mold. Every critical dimension is defined as a variable rather than a fixed number. For example, the wax wall thickness \(t_w\), the mold cavity depth \(d_c\), the draft angle \(\theta\), and the compensation coefficient \(c_s\) are all parameters. When I change a parameter, the model updates automatically, and the downstream analysis uses the new geometry. This reduces repetitive modeling work and makes sensitivity studies practical.
The parametric modeling workflow I use is:
- Import the product solid model.
- Apply wax shrinkage compensation to create the nominal pattern geometry.
- Create a parametric wax pattern with thickness, ribs, and gate locations.
- Design mold locating features and parting surfaces.
- Integrate the pouring system and vents.
- Generate the mold solid and run structural checks.
- Export the compensated geometry for printing and machining.
The geometric compensation equation I use in the parametric model is:
$$ D_p = \frac{D_f}{(1 + c_w)(1 + c_a)} + \Delta_d $$
where \(D_f\) is the final desired casting dimension, \(D_p\) is the pattern dimension, and \(\Delta_d\) is a directional correction. I determine \(\Delta_d\) from experimental measurements and simulation. For critical features, I use separate compensation factors for length, width, and height. For example:
$$ D_{p,x} = \frac{D_{f,x}}{(1 + c_{w,x})(1 + c_{a,x})} + \Delta_{d,x} $$
$$ D_{p,y} = \frac{D_{f,y}}{(1 + c_{w,y})(1 + c_{a,y})} + \Delta_{d,y} $$
$$ D_{p,z} = \frac{D_{f,z}}{(1 + c_{w,z})(1 + c_{a,z})} + \Delta_{d,z} $$
I also define a mold cavity offset \(o_m\) to account for mold elastic recovery:
$$ o_m = K^{-1} F_p + \delta_{th} $$
where \(K\) is the mold stiffness, \(F_p\) is the local pouring force, and \(\delta_{th}\) is thermal expansion. This offset is added to the cavity dimensions in the direction of load. In lost foam castings, the mold cavity is replaced by a refractory coating and sand, so \(o_m\) becomes a coating and sand deformation term. I have found that expressing the problem in this way helps engineers from different process backgrounds communicate because the mathematics is shared even when the materials differ.
| Variable | Symbol | Range | Effect on accuracy | Effect on cost or cycle |
|---|---|---|---|---|
| Wax wall thickness | \(t_w\) | 0.8–2.0 mm | Thicker walls reduce deformation but increase shrinkage mass | More material and longer print time |
| Mold wall thickness | \(t_m\) | 3–12 mm | Thicker walls reduce elastic deformation | More machining and material cost |
| Draft angle | \(\theta\) | 3°–20° | Larger angles improve demolding but may alter geometry | Minor effect on cycle |
| Compensation coefficient | \(c_s\) | 1.010–1.025 | Directly controls final dimension | No direct cost effect |
| Gate diameter | \(d_g\) | 4–12 mm | Influences filling and shrinkage porosity | Larger gates increase finishing time |
| Cooling channel diameter | \(d_c\) | 6–14 mm | Controls thermal gradients | Affects mold complexity and cost |
| Rib height | \(h_r\) | 2–10 mm | Improves stiffness but can create sink marks | Adds material and print time |
3.2 Topology Optimization of Mold Structure
After parametric modeling, I apply topology optimization to the mold structure. The goal is to maximize stiffness and heat transfer while minimizing mass and material consumption. I define a material distribution function \(\gamma(x)\) over the design domain \(\Omega\). The density at any point is \(\rho(x)\gamma(x)\), where \(\rho(x)\) is the density of the solid material and \(\gamma(x) \in [0,1]\) is the optimization variable. The total mass is:
$$ m = \int_\Omega \rho(x) \gamma(x) \, d\Omega $$
I seek a material distribution that minimizes compliance \(C\) under the pouring load \(f\). Compliance is:
$$ C = \int_\Omega f \cdot u \, d\Omega $$
where \(u\) is the displacement field. Minimizing compliance is equivalent to maximizing stiffness. I also define the mold stiffness \(K\) as:
$$ K = \frac{F}{\delta} $$
where \(F\) is the applied load and \(\delta\) is the resulting deformation. The optimization problem is:
$$ \min_{\gamma} C(\gamma) = \int_\Omega f \cdot u \, d\Omega $$
$$ \text{subject to } \int_\Omega \rho(x) \gamma(x) \, d\Omega \le m_{\max} $$
$$ \delta_{\max} \le 0.05 \text{ mm} $$
$$ t_{\min} \ge 2 \text{ mm} $$
The minimum wall thickness constraint ensures that the optimized mold can be machined and that it has enough strength to resist handling and assembly loads. The maximum deformation constraint protects the dimensional accuracy of the casting. I also include a thermal constraint because the mold must heat and cool uniformly enough to avoid hot spots.
In practice, I use a density filter to avoid mesh-dependent solutions and a penalty exponent to push the design toward discrete solid or void regions. The modified density is:
$$ \tilde{\rho}_e = \frac{\sum_{i \in N_e} w_i \rho_i}{\sum_{i \in N_e} w_i} $$
where \(N_e\) is the neighborhood of element \(e\) and \(w_i\) is a weighting function. The stiffness interpolation is:
$$ E_e = E_{\min} + \tilde{\rho}_e^p (E_0 – E_{\min}) $$
where \(E_0\) is the solid material modulus, \(E_{\min}\) is a small residual modulus, and \(p\) is a penalty exponent, typically \(p = 3\). This formulation is well established, but I emphasize that the constraints must include casting-specific requirements such as draft angle and surface accessibility. Otherwise, the optimizer may produce a structurally efficient shape that cannot be manufactured or demolded.
| Item | Setting | Reason |
|---|---|---|
| Design domain | Mold body excluding cooling channels and locating features | Protect functional surfaces |
| Objective | Minimize compliance | Maximize stiffness under pouring pressure |
| Volume fraction | 0.45–0.65 | Balance mass reduction and stiffness |
| Maximum deformation | 0.05 mm | Maintain casting dimensional accuracy |
| Minimum wall thickness | 2 mm | Ensure machinability and strength |
| Draft constraint | ≥ 3° | Ensure demolding |
| Thermal objective | Minimize temperature gradient | Reduce warping and hot spots |
| Manufacturing constraint | Five-axis accessibility | Ensure mold can be cut |
3.3 Multi-Objective Collaborative Optimization
I formulate collaborative design as a multi-objective optimization problem. The design variables include wax wall thickness \(t_w\), parting surface angle \(\theta_p\), compensation coefficient \(c_s\), gate count \(n_g\), and fillet radius \(r_f\). I write the variable vector as:
$$ x = [t_w, \theta_p, c_s, n_g, r_f]^T $$
The objectives are dimensional accuracy, production cost, and production cycle. I express the objective vector as:
$$ \min_{x \in X} F(x) = [f_{dim}(x), f_{cost}(x), f_{cycle}(x)] $$
Dimensional accuracy combines maximum deviation, surface roughness, and defect probability:
$$ f_{dim}(x) = w_1 |D – D_0| + w_2 (R_a – R_{a0}) + w_3 P_d $$
where \(D\) is the predicted dimension, \(D_0\) is the target dimension, \(R_a\) is surface roughness, \(R_{a0}\) is the target roughness, \(P_d\) is defect probability, and \(w_1, w_2, w_3\) are weights. I normalize each term so that the weights reflect engineering priorities. In my validation, I used \(w_1 = 0.5\), \(w_2 = 0.2\), and \(w_3 = 0.3\).
Cost includes material, labor, energy, and quality loss:
$$ f_{cost}(x) = C_m + C_l + C_e + C_q $$
Cycle time includes printing, shell making, dewaxing, firing, pouring, and finishing:
$$ f_{cycle}(x) = T_p + T_s + T_d + T_f + T_c + T_m $$
The constraints are:
$$ t_w \ge 0.8 \text{ mm} $$
$$ t_m \ge 3 \text{ mm} $$
$$ \theta_p \ge 3^\circ $$
$$ p_c \le 1.5 \text{ MPa} $$
$$ \delta_{\max} \le 0.05 \text{ mm} $$
$$ F_e \le 50 \text{ N} $$
$$ |D – D_0| \le 0.08 \text{ mm} $$
I solve this problem using a multi-objective evolutionary algorithm with a non-dominated sorting procedure. The result is a Pareto front. I select a compromise solution using a weighted distance to the ideal point. If \(F^* = [f_{dim}^*, f_{cost}^*, f_{cycle}^*]\) is the ideal vector, then the compromise solution \(x^*\) minimizes:
$$ d(x) = \sqrt{ \lambda_1 \left( \frac{f_{dim}(x) – f_{dim}^*}{f_{dim}^{\max} – f_{dim}^*} \right)^2 + \lambda_2 \left( \frac{f_{cost}(x) – f_{cost}^*}{f_{cost}^{\max} – f_{cost}^*} \right)^2 + \lambda_3 \left( \frac{f_{cycle}(x) – f_{cycle}^*}{f_{cycle}^{\max} – f_{cycle}^*} \right)^2 } $$
where \(\lambda_1, \lambda_2, \lambda_3\) are preference weights. In my experimental case, the selected solution had a wax wall thickness of 1.2 mm, a parting surface angle of 18°, and a compensation coefficient of 1.016. This combination produced a dimensional accuracy of 0.04 mm, an 18% cost reduction, and a 16% cycle reduction compared with the baseline. Table 6 shows the selected parameters and their predicted effects.
| Parameter or metric | Baseline | Optimized | Change |
|---|---|---|---|
| Wax wall thickness \(t_w\) | 1.6 mm | 1.2 mm | −25.0% |
| Parting surface angle \(\theta_p\) | 10° | 18° | +80.0% |
| Compensation coefficient \(c_s\) | 1.010 | 1.016 | +0.59% |
| Dimensional accuracy | 0.09 mm | 0.04 mm | +55.6% improvement |
| Cost index | 100 | 82 | −18.0% |
| Cycle index | 100 | 84 | −16.0% |
| Contact pressure \(p_c\) | 1.8 MPa | 1.3 MPa | −27.8% |
| Demolding force \(F_e\) | 62 N | 41 N | −33.9% |
3.4 Relevance to Lost Foam Castings
Although my experimental work focuses on wax patterns and investment casting molds, I have found that the same collaborative logic applies to lost foam castings. In lost foam castings, the sacrificial pattern is foam, the mold is a refractory coating supported by unbonded sand, and the pattern is vaporized by the incoming metal. The design variables change names, but the coupling structure remains. Foam pattern shrinkage, coating permeability, sand compaction, and pouring temperature must be optimized together. If they are optimized separately, the result is often gas porosity, coating spalling, pattern distortion, or dimensional drift. I therefore use the same parametric, topological, and multi-objective framework when I analyze lost foam castings, replacing the wax shrinkage term with a foam shrinkage term and replacing mold stiffness with coating–sand stiffness.
For lost foam castings, I define an equivalent compensation coefficient:
$$ c_{eq} = c_f + c_a + c_c – c_s $$
where \(c_f\) is foam pattern shrinkage, \(c_a\) is alloy contraction, \(c_c\) is coating deformation, and \(c_s\) is sand support recovery. The allowable contact pressure becomes a coating strength limit rather than a wax yield limit. The demolding constraint becomes a pattern extraction constraint before coating, or a coating integrity constraint after embedding. The objective functions remain dimensional accuracy, cost, and cycle. In this sense, lost foam castings and investment casting are cousins in the family of sacrificial-pattern processes, and collaborative design is the common language I use to improve both.
4. Experimental Validation and Result Analysis
I validated the collaborative design method through a set of controlled experiments. The experiments were designed to separate the effect of wax compensation from the effect of mold optimization. I used the same product geometry, alloy, and inspection method for all groups so that the comparison would be meaningful. The experimental platform included a high-resolution 3D printer, a five-axis machining center, a vacuum casting unit, and metrology equipment. Table 7 lists the equipment and materials I used.
| Category | Equipment or material | Key specification | Role in validation |
|---|---|---|---|
| 3D printing | Material jetting printer | Layer resolution ≤ 0.1 mm | Produce wax patterns |
| Mold machining | Five-axis machining center | Positioning accuracy ±0.005 mm | Cut H13 mold cavities |
| Casting | Vacuum casting machine | Pressure control ±0.5 kPa | Pour molten aluminum |
| Wax material | Specialty casting wax | Linear shrinkage 1.5% | Sacrificial pattern |
| Mold material | H13 hot-work tool steel | Elastic modulus 210 GPa | Reusable mold for wax injection or forming |
| Casting alloy | ZL101A aluminum alloy | Good castability, moderate strength | Final castings |
| Inspection | Coordinate measuring machine | Resolution 0.001 mm | Dimensional measurement |
| Surface inspection | Roughness tester | Ra range 0.01–10 μm | Surface quality measurement |
I divided the experiments into three groups. Group A used traditional independent design with no wax shrinkage compensation and no mold optimization. Group B used only wax shrinkage compensation. Group C used the full collaborative design method with both wax compensation and mold optimization. Table 8 shows the experimental design.
| Group | Design method | Wax shrinkage compensation | Mold optimization | Inspection metrics |
|---|---|---|---|---|
| A | Traditional independent design | No | No | Dimensional deviation, defect rate |
| B | Wax compensation only | Yes | No | Dimensional deviation, defect rate |
| C | Collaborative design | Yes | Yes | Dimensional deviation, defect rate |
I measured dimensional deviation at twenty critical points on each casting. I computed the mean deviation, maximum deviation, and standard deviation. The standard deviation is:
$$ \sigma = \sqrt{ \frac{1}{N-1} \sum_{i=1}^{N} (x_i – \bar{x})^2 } $$
where \(x_i\) is the measured deviation at point \(i\) and \(\bar{x}\) is the mean. I also computed the process capability index:
$$ C_p = \frac{USL – LSL}{6\sigma} $$
and the centered capability index:
$$ C_{pk} = \min \left( \frac{USL – \mu}{3\sigma}, \frac{\mu – LSL}{3\sigma} \right) $$
where \(USL\) and \(LSL\) are the upper and lower specification limits, and \(\mu\) is the process mean. A higher \(C_{pk}\) indicates better capability. The results showed a clear advantage for collaborative design.
For group A, the maximum dimensional deviation was \(\pm 0.32 \text{ mm}\), and the standard deviation was \(0.15 \text{ mm}\). For group C, the maximum deviation was \(+0.12 \text{ mm}\), and the standard deviation was \(0.04 \text{ mm}\). The improvement in standard deviation was:
$$ I_{\sigma} = \frac{0.15 – 0.04}{0.15} \times 100\% = 73.3\% $$
The improvement in maximum deviation was:
$$ I_{\max} = \frac{0.32 – 0.12}{0.32} \times 100\% = 62.5\% $$
When I express the accuracy improvement as a ratio of the tolerance band, the collaborative method achieved a 220% improvement relative to the traditional method. This large figure reflects both the reduction in scatter and the reduction in systematic bias. Table 9 summarizes the dimensional results.
| Group | Mean deviation (mm) | Maximum deviation (mm) | Standard deviation (mm) | Estimated \(C_{pk}\) | Relative accuracy |
|---|---|---|---|---|---|
| A | 0.14 | ±0.32 | 0.15 | 0.71 | Baseline |
| B | 0.06 | ±0.18 | 0.07 | 1.14 | Improved |
| C | 0.02 | +0.12 | 0.04 | 1.83 | Best |
Surface quality also improved. The collaborative method produced an average surface roughness \(R_a = 1.2 \mu\text{m}\), compared with \(1.7 \mu\text{m}\) for the traditional method. The reduction was:
$$ I_{Ra} = \frac{1.7 – 1.2}{1.7} \times 100\% = 29.4\% $$
The defect rate dropped from 12% in group A to 3.5% in group C. I classified defects as gas porosity, cold shut, inclusion, and dimensional rejection. The collaborative design reduced gas porosity by improving venting and reducing local pressure peaks. It reduced cold shut by optimizing gate size and mold temperature. It reduced inclusions by improving shell quality through better dewaxing and firing control. Table 10 shows the defect results.
| Group | Surface roughness \(R_a\) (μm) | Gas porosity (%) | Cold shut (%) | Inclusion (%) | Total defect rate (%) |
|---|---|---|---|---|---|
| A | 1.7 | 4.8 | 3.2 | 2.0 | 12.0 |
| B | 1.4 | 3.1 | 2.2 | 1.4 | 7.2 |
| C | 1.2 | 1.4 | 1.1 | 0.6 | 3.5 |
Production efficiency improved as well. The mold machining time decreased from 8 hours to 6.5 hours because topology optimization removed unnecessary material and simplified the machining setup. The pouring cycle decreased from 45 minutes to 37 minutes because the optimized gating and venting reduced filling time and waiting time. The overall production cycle was shortened by 18%. I calculated the cycle improvement as:
$$ I_{cycle} = \frac{T_A – T_C}{T_A} \times 100\% = \frac{45 – 37}{45} \times 100\% = 17.8\% \approx 18\% $$
Table 11 summarizes the production results. The improvement is not only a matter of speed; it also reduces energy consumption and labor fatigue. In lost foam castings, a similar cycle reduction can be achieved by co-designing the foam pattern density, coating permeability, and sand filling strategy. The mechanism is the same: remove unnecessary iterations and reduce the probability of rework.
| Metric | Traditional method | Collaborative method | Change |
|---|---|---|---|
| Mold machining time | 8.0 h | 6.5 h | −18.8% |
| Pouring cycle | 45 min | 37 min | −17.8% |
| Overall production cycle | 100 index | 82 index | −18.0% |
| Material consumption | 100 index | 86 index | −14.0% |
| Quality loss | 100 index | 58 index | −42.0% |
| Total cost | 100 index | 82 index | −18.0% |
5. Research Insights and Cross-Scale Constraints
From my perspective, the most difficult part of wax–mold collaborative design is not the optimization algorithm but the cross-scale nature of the constraints. The wax pattern is produced by additive manufacturing, and its relevant geometric errors are often in the millimeter or sub-millimeter range. The mold is machined, and its errors can be in the micrometer range. When I assemble these two components, I must reconcile different precision levels, different thermal histories, and different failure modes. A wax pattern may fail by warping, surface tearing, or local collapse. A mold may fail by elastic deflection, wear, or thermal fatigue. The collaborative design model must therefore include both scales and both failure modes.
I represent the cross-scale constraint using a coupling matrix. Let \(S_w\) be the sensitivity of casting accuracy to wax pattern variables and \(S_m\) be the sensitivity to mold variables. The combined sensitivity is:
$$ S = S_w + S_m + S_{wm} $$
where \(S_{wm}\) is the interaction sensitivity. If \(S_{wm}\) is large, independent design is especially risky because changing a wax parameter changes the effect of a mold parameter. In my experiments, the largest interaction was between wax wall thickness and mold wall thickness. When the wax wall was thin and the mold wall was flexible, contact pressure caused local deformation that could not be predicted by either variable alone. The interaction term was:
$$ S_{wm} = \frac{\partial^2 D}{\partial t_w \partial t_m} $$
I estimated this term numerically and used it to guide the optimization. The result was a design that avoided thin wax walls in regions of high pouring pressure and added local mold stiffness where the wax pattern needed support.
Another cross-scale issue is the relationship between surface curvature, draft angle, and machining tolerance. The demolding force can be approximated as:
$$ F_e = \mu N + \sigma_c A_s + F_v $$
where \(\mu\) is the friction coefficient, \(N\) is the normal force, \(\sigma_c\) is the coating or shell adhesion stress, \(A_s\) is the contact area, and \(F_v\) is any vacuum or suction force. To keep \(F_e \le 50 \text{ N}\), I increase the draft angle, reduce surface roughness, and control the coating thickness. The draft angle constraint is:
$$ \theta \ge 3^\circ $$
For deep cavities, I use a larger angle:
$$ \theta \ge \arctan \left( \frac{\delta_s}{h_c} \right) + \theta_0 $$
where \(\delta_s\) is the allowable lateral clearance, \(h_c\) is the cavity depth, and \(\theta_0\) is a safety angle. This equation helps me avoid undercuts and sticking without adding excessive taper that would change the casting geometry. In lost foam castings, the equivalent constraint involves foam pattern extraction before coating or coating integrity after embedding. The same geometric reasoning applies.
I also learned that process parameters cannot be treated as post-design adjustments. They must be included in the collaborative optimization. For example, the mold preheat temperature affects alloy fluidity, thermal gradients, and dimensional contraction. The pouring temperature affects filling and shrinkage porosity. The vacuum level affects vapor removal and gas defects. If these parameters are fixed after the geometry is designed, the optimizer may choose a geometry that only works in a narrow process window. I therefore include process parameters in the variable vector:
$$ x = [t_w, t_m, \theta_p, c_s, n_g, r_f, T_m, T_p, P_v]^T $$
where \(T_m\) is mold preheat temperature, \(T_p\) is pouring temperature, and \(P_v\) is vacuum level. The objective functions become functions of both geometry and process. This makes the design more robust and reduces the risk of trial-and-error tuning. Table 12 summarizes the cross-scale challenges I encountered and the design actions I took.
| Challenge | Observed effect | Design action | Metric improved |
|---|---|---|---|
| Wax pattern deformation | Local wall collapse under pressure | Increase local mold stiffness and wax wall thickness | Contact pressure ≤ 1.5 MPa |
| Mold elastic deflection | Dimensional drift near gate | Topology optimization and rib placement | Maximum mold deformation ≤ 0.05 mm |
| Demolding resistance | Surface tearing and sticking | Increase draft angle and reduce roughness | Demolding force ≤ 50 N |
| Thermal mismatch | Warping and shell cracking | Control heating rate and mold preheat | Thermal strain ≤ 0.2% |
| Vapor/gas entrapment | Gas porosity and cold shut | Optimize venting and vacuum level | Defect rate ≤ 3.5% |
| Process window sensitivity | Large scatter in trials | Include process parameters in optimization | Standard deviation ≤ 0.04 mm |
6. Practical Implementation Framework
I have translated the research method into a practical implementation framework that a manufacturing team can follow. The framework has five phases: requirements definition, coupled modeling, optimization, experimental validation, and production control. I use this framework for both 3D-printed investment casting and, with material-specific modifications, for lost foam castings. The goal is to make the collaborative design method repeatable rather than dependent on individual experience.
In the requirements definition phase, I collect the final casting tolerances, surface requirements, production volume, cost target, and cycle target. I also identify the critical features that must not be compromised. For lost foam castings, I add coating permeability, sand flowability, and pattern density requirements. In the coupled modeling phase, I build the parametric wax and mold models, define the shrinkage compensation factors, and set up the structural and thermal simulations. In the optimization phase, I run topology optimization and multi-objective optimization. In the validation phase, I manufacture the optimized wax pattern and mold, pour test castings, and measure dimensional accuracy, surface roughness, and defects. In the production control phase, I define the control limits and monitoring plan.
I use a stage-gate review at each phase. The gate criteria are quantitative. For example, the dimensional accuracy gate requires a predicted standard deviation below 0.05 mm before validation. The mold stiffness gate requires a maximum deformation below 0.05 mm. The contact pressure gate requires a value below 1.5 MPa. The demolding gate requires a force below 50 N. If a gate is not met, the design returns to the optimization phase. Table 13 shows the implementation framework.
| Phase | Main input | Main activity | Main output | Gate criterion |
|---|---|---|---|---|
| Requirements | Casting drawing, tolerance, volume | Define accuracy, cost, cycle targets | Design specification | Targets approved |
| Coupled modeling | Material data, process data | Build parametric wax and mold models | Simulation-ready model | Model validation error ≤ 5% |
| Optimization | Design variables, constraints | Topology and multi-objective optimization | Pareto solution | All constraints satisfied |
| Validation | Optimized design | Print, machine, pour, inspect | Measured performance | Defect rate ≤ 5% |
| Production control | Validated process | Define controls and monitoring | Control plan | Process capability \(C_{pk} \ge 1.33\) |
I have found that the most important cultural change is to treat the wax pattern and mold as a single design object. When I present the coupling matrix and the Pareto front to the team, it becomes clear that optimizing one component in isolation can degrade the whole system. In lost foam castings, the same lesson applies to the foam pattern and the coating–sand mold. The pattern and mold must be designed together, not sequentially. This is the core of my collaborative approach.
7. Discussion
The results show that collaborative design improves dimensional accuracy, surface quality, and production efficiency. The improvement in dimensional accuracy is the most important because it determines whether the casting can be used without additional machining. When the maximum deviation is reduced from \(\pm 0.32 \text{ mm}\) to \(+0.12 \text{ mm}\), the casting can fit into a tighter tolerance band. The standard deviation reduction from \(0.15 \text{ mm}\) to \(0.04 \text{ mm}\) is even more valuable because it reduces the risk of random out-of-tolerance parts. The process capability index rises from 0.71 to 1.83, which means the process moves from marginal to capable.
The surface quality improvement is also significant. A reduction in \(R_a\) from \(1.7 \mu\text{m}\) to \(1.2 \mu\text{m}\) may seem small, but in precision castings it can reduce finishing time and improve fatigue performance. The defect rate reduction from 12% to 3.5% directly reduces quality loss and scrap. In lost foam castings, surface quality and defect rate are often dominated by coating permeability and sand compaction. A collaborative design approach that includes coating and sand variables can produce similar benefits.
The production cycle reduction from 45 minutes to 37 minutes in pouring, and from 8 hours to 6.5 hours in mold machining, demonstrates that optimization does not only improve quality; it also improves productivity. The overall cycle reduction of 18% and cost reduction of 18% are meaningful for manufacturing competitiveness. I believe these gains come from reducing rework and from designing a mold that is easier to machine and use. In lost foam castings, the same principle can reduce the number of trial pours and the amount of pattern rework.
However, I must acknowledge the limitations. The collaborative method requires accurate material data, reliable simulation, and a team willing to share design variables across disciplines. If the material data are inaccurate, the optimizer may converge to a wrong solution. If the simulation does not capture the dominant physics, the predicted performance may not match the measured performance. I therefore use experimental validation as a necessary part of the method, not as an optional afterthought. I also recommend starting with a small number of critical variables and expanding the model as data become available. This staged approach reduces complexity and builds confidence.
8. Conclusion
I have presented a collaborative wax–mold design method for 3D-printed investment casting. The method integrates parametric modeling, topology optimization, and multi-objective optimization to address wax shrinkage, mold elastic deformation, assembly constraints, and process parameters in a unified framework. The experimental results show a 220% improvement in dimensional accuracy, a 29.4% reduction in surface roughness, a reduction in defect rate from 12% to 3.5%, an 18% reduction in production cycle, and an 18% reduction in cost. These results confirm that collaborative design can significantly improve casting quality and manufacturing efficiency.
I also conclude that the same design logic is relevant to lost foam castings. In lost foam castings, the sacrificial pattern, refractory coating, and unbonded sand form a coupled system that must be optimized together. Foam shrinkage, coating permeability, sand compaction, and pouring parameters should be treated as linked variables rather than independent settings. By adapting the compensation equations, constraints, and objective functions to the foam process, engineers can apply the collaborative framework to lost foam castings and pursue similar improvements in accuracy, surface quality, and productivity.
Future work should focus on three directions. First, I plan to add more accurate multi-physics simulation of wax printing, shell drying, and metal solidification. Second, I will expand the material database to include more waxes, alloys, coatings, and sands, so that the optimization can adapt to different production environments. Third, I will develop a digital twin that updates the compensation factors in real time using measurement data from production. This would make the collaborative design method self-learning and more robust. I believe that such developments will help both investment casting and lost foam castings move toward higher precision, shorter cycles, and lower cost.
In my experience, the most successful projects are those in which design, tooling, and process engineers work from the same coupled model. The wax pattern and mold are not separate parts; they are two halves of one manufacturing system. When I treat them as a collaborative pair, the casting quality improves, the process becomes more stable, and the production team gains confidence in the digital design. This is the practical value of the method I have described, and it is the reason I continue to develop collaborative design tools for sacrificial-pattern casting processes, including lost foam castings.