
In my work on turbocharger components, I treat the turbine volute as a pressure-bearing part whose internal integrity directly controls reliability and service life. The volute operates under high temperature, high pressure, and repeated thermal cycling, so its material must provide strong high-temperature mechanical performance while maintaining structural continuity. Because the geometry is complex and thin-walled, precision casting is the most practical manufacturing route. In particular, investment-based precision casting gives the dimensional accuracy, surface finish, and shape freedom required for such a part. However, the same geometry that makes precision casting attractive also creates serious solidification challenges. The spiral flow channel, inlet flange, and local bosses generate thick hot spots that are difficult to feed. If the gating system, riser design, or cooling arrangement is not properly balanced, shrinkage cavity, shrinkage porosity, and cracks can form. These defects reduce fatigue strength and creep resistance, and they can become crack initiation sites under real operating conditions. For this reason, I combined three-dimensional modeling, thermal-physical calculation, and numerical simulation to optimize the precision casting process for a specific AlSiCuSc alloy turbine volute. My objective was to compare several process schemes, identify the defect formation mechanisms, select the best design, and verify it through production trials.
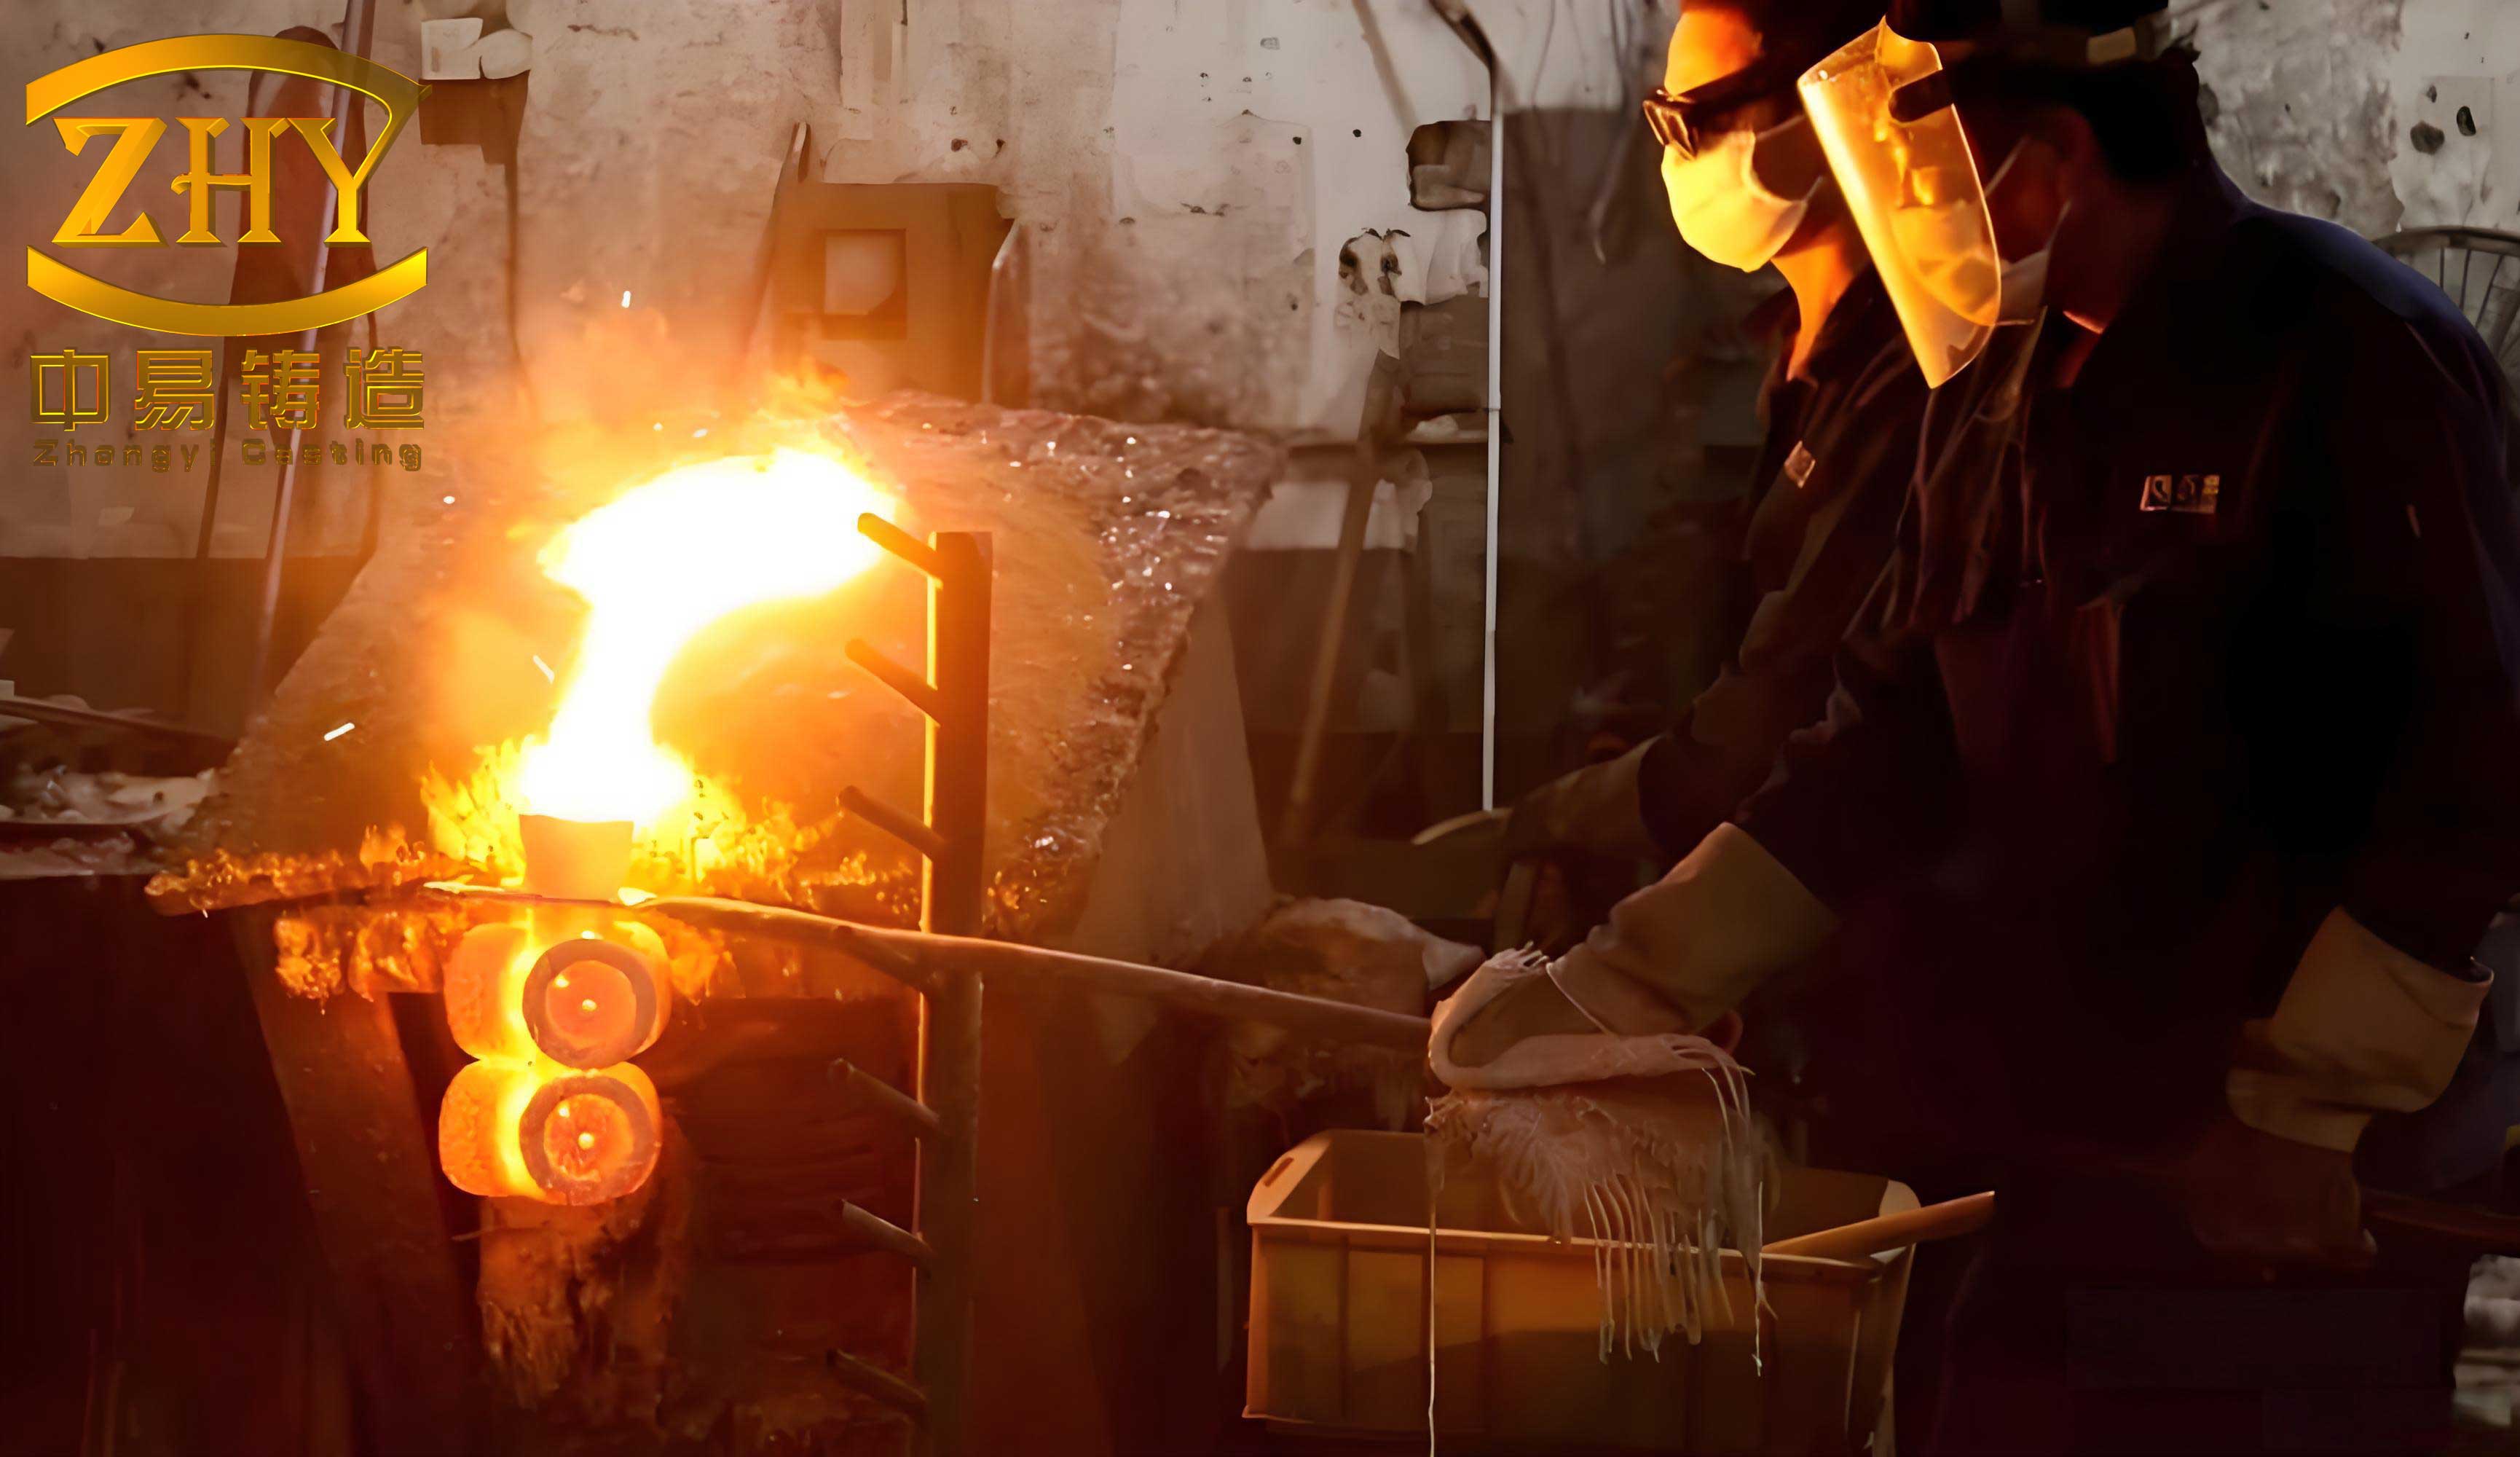
The alloy selected for this volute is an AlSiCuSc composition. I used this material because scandium-bearing aluminum alloys can offer improved elevated-temperature stability and grain structure control when the casting process is carefully managed. The chemical composition I adopted is summarized in Table 1. The balance is aluminum, and the impurity level is kept low to avoid uncontrolled phase formation. In precision casting, small composition changes can alter fluidity, feeding behavior, and hot tearing sensitivity, so I fixed the composition window before simulation.
| Element | Si | Ti | Sc | Mn | Cu | Zn | Mg | Be | Al | Other impurities | Total impurities |
|---|---|---|---|---|---|---|---|---|---|---|---|
| Content, wt.% | 7.5 | 0.15 | 0.6 | 0.1 | 1.7 | 0.1 | 0.4 | 0.07 | Balance | 0.05 | 0.15 |
The volute is a small but geometrically demanding part. Its overall envelope is approximately 134 mm by 129 mm by 104 mm. The computed volume is about 298,738 mm3, and the casting mass is approximately 0.83 kg. The wall thickness is not uniform. The maximum local thickness reaches 16 mm, the average wall thickness is about 5.54 mm, and the spiral tube wall is about 3 mm. This combination produces a large number of thermal gradients and hot spots. The geometric features are summarized in Table 2. In my assessment, the thick flange and boss regions behave as late-solidifying zones, while the thin spiral wall cools quickly. This difference in solidification time is the main reason why precision casting of this volute requires a carefully designed feeding system.
| Feature | Value | Implication for precision casting |
|---|---|---|
| Overall size | 134 mm × 129 mm × 104 mm | Compact part with complex internal channels |
| Volume | 298,738 mm3 | Small casting with local mass concentration |
| Mass | 0.83 kg | Moderate pouring weight, short fill time possible |
| Maximum wall thickness | 16 mm | Hot spot formation and delayed solidification |
| Average wall thickness | 5.54 mm | Mixed thin-thick solidification behavior |
| Spiral tube wall thickness | 3 mm | Rapid cooling, possible misrun if fill is unstable |
To describe the thermal and solidification behavior, I used the heat-transfer and fluid-flow equations solved by the simulation software. The mass conservation equation is:
$$\frac{\partial \rho}{\partial t} + \nabla \cdot (\rho \mathbf{v}) = 0$$
where \(\rho\) is density, \(t\) is time, and \(\mathbf{v}\) is the velocity vector. The momentum conservation equation for the liquid metal is:
$$\rho \left( \frac{\partial \mathbf{v}}{\partial t} + \mathbf{v} \cdot \nabla \mathbf{v} \right) = -\nabla p + \mu \nabla^2 \mathbf{v} + \rho \mathbf{g}$$
where \(p\) is pressure, \(\mu\) is dynamic viscosity, and \(\mathbf{g}\) is gravitational acceleration. The energy equation, including latent heat release, is written as:
$$\rho c_p \left( \frac{\partial T}{\partial t} + \mathbf{v} \cdot \nabla T \right) = \nabla \cdot (k \nabla T) + L \frac{\partial f_s}{\partial t}$$
Here \(c_p\) is specific heat, \(T\) is temperature, \(k\) is thermal conductivity, \(L\) is latent heat, and \(f_s\) is solid fraction. The solid fraction is related to temperature by:
$$f_s = \frac{T_l – T}{T_l – T_s}$$
where \(T_l\) is liquidus temperature and \(T_s\) is solidus temperature. These equations form the basis of the filling and solidification simulation. For defect prediction, I also used the Niyama criterion, which is widely applied in precision casting simulation:
$$N_y = \frac{G}{\sqrt{\dot{T}}}$$
where \(G = |\nabla T|\) is the temperature gradient and \(\dot{T} = \partial T / \partial t\) is the cooling rate. A low Niyama value indicates a high probability of shrinkage porosity. In my analysis, I compared the computed Niyama field with the isolated liquid regions and the final porosity distribution. This combination gives a more reliable interpretation than a single criterion alone.
The thermal-physical properties of the AlSiCuSc alloy were calculated and then imported into the simulation. The property data include thermal conductivity, density, enthalpy, solid fraction, and dynamic viscosity. Table 3 lists representative values used in my model. These properties are temperature-dependent, so the simulation updates them at every time step. The enthalpy curve is especially important because it controls latent heat release during solidification. The solid fraction curve controls the mushy-zone permeability and feeding resistance. The dynamic viscosity influences filling behavior, especially in the thin spiral channel.
| Property | Representative value or range | Role in precision casting simulation |
|---|---|---|
| Thermal conductivity \(k\) | 120–180 W·m−1·K−1 | Controls heat extraction and temperature gradients |
| Density \(\rho\) | 2,650–2,750 kg·m−3 | Affects momentum, pressure, and feeding |
| Enthalpy \(H(T)\) | Temperature-dependent curve | Includes sensible and latent heat |
| Solid fraction \(f_s(T)\) | 0 at liquidus, 1 at solidus | Defines mushy zone and isolated liquid regions |
| Dynamic viscosity \(\mu\) | 1.0–2.0 mPa·s in liquid state | Controls filling velocity and Reynolds number |
| Liquidus temperature \(T_l\) | Approximately 610–620 °C | Start of solidification |
| Solidus temperature \(T_s\) | Approximately 540–555 °C | End of solidification |
I designed three precision casting schemes for the volute. Scheme 1 used a relatively tall gating and feeding arrangement with an overall envelope of 361 mm × 179 mm × 359 mm. Its process yield was 8.6%. Scheme 2 used a more compact arrangement with an overall envelope of 367 mm × 179 mm × 282 mm, and its process yield was 13.1%. Scheme 3 used another compact layout with an overall envelope of 331 mm × 151 mm × 359 mm, and its process yield was 12.6%. The process yield is defined as:
$$Y = \frac{m_{\text{casting}}}{m_{\text{casting}} + m_{\text{gating}} + m_{\text{riser}}} \times 100\%$$
where \(m_{\text{casting}}\) is the casting mass, \(m_{\text{gating}}\) is the gating mass, and \(m_{\text{riser}}\) is the riser mass. Although a higher yield is economically desirable, it cannot be achieved at the expense of feeding. In precision casting, the feeding path must remain open until the hot spots solidify. Therefore, I evaluated each scheme not only by yield but also by filling stability, isolated liquid regions, and predicted porosity. Table 4 summarizes the three schemes.
| Scheme | Overall size | Process yield | Main design intention |
|---|---|---|---|
| Scheme 1 | 361 mm × 179 mm × 359 mm | 8.6% | Large feeding reservoir and tall down-sprue arrangement |
| Scheme 2 | 367 mm × 179 mm × 282 mm | 13.1% | Compact gating with balanced filling and feeding |
| Scheme 3 | 331 mm × 151 mm × 359 mm | 12.6% | Top and bottom filling with reduced overall width |
I set the pouring temperature to 710 °C and the filling time to 15 s for all three schemes. These parameters are typical for thin-walled aluminum precision casting, but the exact values must be checked against filling stability. If the pouring temperature is too low, the thin spiral wall may solidify before filling is complete. If the filling time is too long, the melt may lose superheat and create cold shuts or misruns. If the filling time is too short, the flow may become turbulent, causing gas entrapment and oxide film defects. I therefore examined the filling sequence for each scheme before judging the solidification results.
In Scheme 1, the metal first filled the left side of the casting. After that side was filled, the liquid fell downward and merged with the metal entering from the bottom gate. The free surface then rose steadily until filling was complete. This behavior is not ideal because the falling stream can entrain oxide films and create surface turbulence. In precision casting, such turbulence is dangerous because the oxide film in aluminum alloys is strong and cannot easily be removed after it is trapped. In Scheme 2, the entire filling process was smooth and stable. I did not observe a significant falling stream or a strong confluence of separate flow fronts. The metal advanced in a controlled manner, which is favorable for thin-wall filling and for avoiding cold shuts. In Scheme 3, the metal initially filled the bottom of the casting with a relatively stable surface. As filling continued, metal from the upper gate began to fill the top of the casting. The liquid then fell and merged with the bottom flow. This produced a filling pattern similar to a controlled top-bottom combination, but the merge location still carries a risk of oxide entrapment. Table 5 compares the filling behavior.
| Scheme | Filling sequence | Stability | Potential risk |
|---|---|---|---|
| Scheme 1 | Left side fills, then falls and merges with bottom flow | Moderate | Falling stream, oxide entrainment, surface turbulence |
| Scheme 2 | Smooth progressive filling from bottom to top | High | Low, provided filling time is maintained |
| Scheme 3 | Bottom fills first, then top fills and merges | Moderate | Merge front and possible cold shut in thin wall |
After filling, I analyzed the isolated liquid regions. An isolated liquid region forms when a volume of liquid metal is surrounded by solid or by a mushy zone with very low permeability. Once isolated, it cannot be fed by the riser, and shrinkage porosity becomes almost unavoidable. The isolated liquid fraction can be expressed as:
$$f_{\text{iso}} = f_l – f_{\text{connected}}$$
where \(f_l\) is the liquid fraction and \(f_{\text{connected}}\) is the fraction of liquid still connected to the feeding path. In practice, the simulation identifies isolated liquid regions by tracking the connectivity of cells with \(f_l > 0\). If a liquid cell is not connected to the gate or riser, it is treated as isolated. The feeding resistance in the mushy zone can be described by Darcy’s law:
$$v = -\frac{K}{\mu} \nabla p$$
where \(K\) is permeability. As solid fraction increases, \(K\) decreases rapidly, and the pressure gradient required to feed the liquid increases. When the pressure drop exceeds the available metallostatic pressure, feeding stops. This is the physical reason why isolated liquid regions are so damaging in precision casting.
In Scheme 1 and Scheme 2, my simulation showed no isolated liquid region in the casting. Although the solidification sequence differed between them, both maintained a connected feeding path to the final hot spots. In Scheme 3, however, an isolated liquid region appeared at the bottom of the small flange. This region is a classic hot spot because the flange is thicker than the surrounding wall. During solidification, the thin wall cools first and closes the feeding path, leaving the flange bottom isolated. In actual production, this would produce porosity in the small flange. Table 6 summarizes the isolated liquid region results.
| Scheme | Isolated liquid region | Location | Expected defect if cast as designed |
|---|---|---|---|
| Scheme 1 | None | — | Low risk of isolated shrinkage, but filling turbulence remains |
| Scheme 2 | None | — | Low risk of isolated shrinkage and stable filling |
| Scheme 3 | Present | Bottom of small flange | Local shrinkage porosity in the flange |
I then examined the predicted shrinkage porosity distribution. The simulation used a porosity criterion based on the Niyama value and the local solidification conditions. The critical Niyama value can be written as:
$$N_{y,\text{crit}} = \frac{G_{\text{crit}}}{\sqrt{\dot{T}_{\text{crit}}}}$$
When \(N_y < N_{y,\text{crit}}\), the feeding resistance is too high and microporosity is predicted. In my analysis, the porosity threshold was set to 2%. At this threshold, Scheme 1 and Scheme 3 produced similar porosity locations and volumes. The porosity volume in Scheme 1 was the largest, reaching 0.92 cm3. Scheme 2 produced the smallest porosity volume, only 0.04 cm3. This is a significant difference. A porosity volume of 0.92 cm3 in a casting of 0.83 kg is unacceptable because it represents a large internal void. In contrast, 0.04 cm3 is small and can be considered within the acceptable range for this component after verification. Table 7 compares the porosity results.
| Scheme | Porosity threshold | Predicted porosity volume | Porosity location | Assessment |
|---|---|---|---|---|
| Scheme 1 | 2% | 0.92 cm3 | Thick flange and hot spot regions | Unacceptable risk |
| Scheme 2 | 2% | 0.04 cm3 | Very limited, no critical hot spot | Best scheme |
| Scheme 3 | 2% | Similar to Scheme 1 | Small flange bottom and adjacent hot spot | Unacceptable risk |
Based on these results, I selected Scheme 2 as the optimal precision casting process. The reasons are clear. First, its filling process was smooth and stable, which reduces the risk of oxide entrainment and cold shuts. Second, it produced no isolated liquid region. Third, it had the smallest predicted porosity volume, only 0.04 cm3. Fourth, its process yield was the highest among the three schemes at 13.1%. This combination of stable filling and effective feeding is exactly what precision casting requires. I also considered the thermal modulus of the hot spots. The modulus is defined as:
$$M = \frac{V}{A}$$
where \(V\) is the volume of the hot spot and \(A\) is its cooling surface area. A large modulus means a long solidification time. For a sound casting, the feeding channel must have a larger modulus than the hot spot it feeds. This can be expressed as:
$$M_{\text{feeder}} > M_{\text{hot spot}}$$
In Scheme 2, the gating and feeding design maintained this inequality long enough for the hot spots to be fed. In Scheme 1, the large feeding reservoir increased the modulus of the feeder, but the filling path was not stable. In Scheme 3, the top-bottom filling arrangement did not provide a sufficiently direct feeding path to the small flange bottom. This is why the isolated liquid region appeared there.
I also used the Chvorinov rule to estimate solidification time:
$$t_s = K M^n$$
where \(t_s\) is solidification time, \(K\) is a mold constant, and \(n\) is an exponent typically close to 2 for many castings. This rule explains why the thick flange solidifies much later than the thin spiral wall. The ratio of solidification times between the thick and thin sections can be approximated as:
$$\frac{t_{\text{thick}}}{t_{\text{thin}}} \approx \left( \frac{M_{\text{thick}}}{M_{\text{thin}}} \right)^n$$
For the volute, the maximum wall thickness is 16 mm and the spiral tube wall is 3 mm. Even though the actual cooling conditions are more complex than this simple ratio, the trend is clear. The thick sections need a feeding path that remains open until they solidify. If the thin sections freeze first and isolate the thick sections, shrinkage porosity forms. This is the core challenge in precision casting of thin-thick hybrid components.
After selecting Scheme 2, I carried out production trials. The full process chain included mold design and fabrication, wax pattern production, shell preparation, dewaxing, shell firing, melting and pouring, shell removal and cutting, cleaning and post-processing, inspection, and delivery. To ensure the reliability of the verification, I cast multiple batches using the same Scheme 2 parameters. The castings were inspected by digital radiography (DR). The DR results showed no shrinkage porosity, shrinkage cavity, or other internal casting defects. This was consistent with the simulation prediction. Table 8 summarizes the verification batches and inspection results.
| Batch | Pouring temperature | Filling time | DR inspection result | Simulation agreement |
|---|---|---|---|---|
| Trial 1 | 710 °C | 15 s | No shrinkage porosity or cavity | Consistent |
| Trial 2 | 710 °C | 15 s | No shrinkage porosity or cavity | Consistent |
| Trial 3 | 710 °C | 15 s | No shrinkage porosity or cavity | Consistent |
| Trial 4 | 710 °C | 15 s | No shrinkage porosity or cavity | Consistent |
| Trial 5 | 710 °C | 15 s | No shrinkage porosity or cavity | Consistent |
| Trial 6 | 710 °C | 15 s | No shrinkage porosity or cavity | Consistent |
The agreement between simulation and trial results confirms the feasibility and accuracy of the numerical model. In my view, this is an important outcome for precision casting process development. It means that the simulation can be used not only as a visualization tool but also as a decision-making tool. By comparing filling patterns, isolated liquid regions, and Niyama-based porosity, I was able to reject two schemes and select the best one before cutting metal. This reduces trial cost and shortens development time. It also improves the stability of the precision casting process.
I further analyzed the defect formation mechanisms. Shrinkage cavity and shrinkage porosity in this volute are caused by insufficient liquid feeding during the final stage of solidification. The thick flange and boss regions act as hot spots. The thin spiral wall cools quickly and can block the feeding path. If the feeding path is blocked before the hot spot completes solidification, a pressure drop develops in the mushy zone. When the local pressure falls below the cavitation pressure, pores form. The pressure drop can be estimated from Darcy’s law as:
$$\Delta p = \frac{\mu L}{K} v$$
where \(L\) is the feeding distance and \(v\) is the feeding velocity. This equation shows that a long feeding distance, high viscosity, or low permeability increases the pressure drop. In precision casting, the permeability \(K\) is strongly affected by the mushy-zone morphology. A coarse dendritic structure can reduce permeability, while a finer and more equiaxed structure can improve feeding. The Sc addition in the AlSiCuSc alloy helps refine the grain structure, which can improve feeding to some extent. However, grain refinement alone cannot compensate for a poorly designed gating system. The process must still provide a direct and open feeding path.
Cracks are another concern in this volute. Thermal cracks can form when the solidifying shell is restrained and the local strain exceeds the ductility of the alloy. The thin spiral wall and the thick flange have different cooling rates, so they shrink at different times. This creates thermal stress. If the mold shell has high resistance, the stress can become large. In precision casting, shell preheating and cooling control are therefore important. A uniform shell temperature reduces the temperature gradient between thick and thin sections. A well-designed gating system also reduces hot tearing by promoting directional solidification and avoiding sudden section changes. In my trials, no cracks were observed after the optimized Scheme 2 was used. This suggests that the thermal conditions were acceptable and that the filling and feeding design did not create excessive restraint.
I also considered the effect of filling time on defect formation. The filling time was fixed at 15 s, but the local velocity varies with cross-section. The average velocity in a channel can be written as:
$$v = \frac{Q}{A}$$
where \(Q\) is volumetric flow rate and \(A\) is cross-sectional area. The Reynolds number is:
$$Re = \frac{\rho v D}{\mu}$$
where \(D\) is a characteristic dimension. If \(Re\) is too high, the flow becomes turbulent, and surface oxide films can be folded into the melt. In aluminum precision casting, it is generally desirable to keep the flow smooth and progressive. Scheme 2 achieved this because the metal advanced from the bottom to the top without a large falling stream. This is one reason why its predicted porosity was so low. The smooth filling reduced oxide entrainment and allowed the feeding path to remain clear.
Another important factor is the process yield. A higher yield means less metal is used in the gating and feeding system. However, the feeding system must still be large enough to compensate for shrinkage. The shrinkage volume can be estimated as:
$$V_{\text{shrinkage}} = \beta V_{\text{casting}}$$
where \(\beta\) is the volumetric shrinkage coefficient. For aluminum alloys, \(\beta\) is typically a few percent. The riser must provide at least this volume while maintaining a positive pressure gradient. This can be written as:
$$V_{\text{riser}} \geq \beta V_{\text{casting}} + V_{\text{loss}}$$
where \(V_{\text{loss}}\) accounts for leakage and feeding inefficiency. In Scheme 2, the process yield was 13.1%, which is higher than Scheme 1 but slightly lower than Scheme 3. However, Scheme 3 produced an isolated liquid region and a large porosity risk. Therefore, the slightly lower yield of Scheme 2 is fully justified by its superior internal quality. In precision casting, quality and reliability must take priority over yield when the part is safety-critical.
I also examined the thermal field evolution. The temperature gradient \(G\) and cooling rate \(\dot{T}\) are the two key variables in the Niyama criterion. A high \(G\) and a high \(\dot{T}\) produce a high Niyama value, which means a low risk of shrinkage porosity. A low \(G\) and a low \(\dot{T}\) produce a low Niyama value, which means a high risk. The Niyama criterion can be rewritten in terms of solidification parameters as:
$$N_y = \frac{G}{\sqrt{\dot{T}}} = \frac{|\nabla T|}{\sqrt{|\partial T / \partial t|}}$$
In the thick flange, the cooling rate is low because the local modulus is large. The temperature gradient may also be low if the surrounding sections cool at similar rates. This combination produces a low Niyama value. In the thin spiral wall, the cooling rate is high, so the Niyama value is high. The dangerous region is therefore the thick flange and the transition zones between thick and thin sections. Scheme 2 addressed this by placing the feeding path so that the thick regions solidified last while remaining connected to the riser. This is the essence of directional solidification in precision casting.
I used the simulation to check the final solidification location. Ideally, the last solidifying region should be in the riser or in a controlled feeding zone, not in the casting itself. If the last liquid is in the casting, shrinkage porosity is almost certain. In Scheme 2, the last solidifying region was located in the feeding system, not in the volute. This is a strong indicator of a sound design. In Scheme 3, the last liquid was isolated at the bottom of the small flange, which is inside the casting. This explains the predicted porosity. Table 9 lists the last solidification locations for the three schemes.
| Scheme | Last solidification location | Feeding condition | Predicted outcome |
|---|---|---|---|
| Scheme 1 | Riser and thick flange transition | Partially connected | Porosity volume 0.92 cm3 |
| Scheme 2 | Riser | Fully connected | Porosity volume 0.04 cm3 |
| Scheme 3 | Small flange bottom | Isolated | Porosity similar to Scheme 1 |
The experimental validation was performed with the same alloy and the same pouring parameters. I inspected the castings visually and by DR. The visual inspection showed good surface quality and complete filling of the thin spiral wall. The DR inspection showed no internal shrinkage defects. These results confirmed that the optimized precision casting process is capable of producing a sound volute. I also noted that the casting dimensions were within tolerance and that no cracks were found after cutting and cleaning. This is important because the volute is a pressure-bearing part, and any internal defect could reduce its service life.
I further considered the role of shell preheating. In investment-based precision casting, the shell is usually preheated before pouring to reduce thermal shock and improve filling. If the shell temperature is too low, the melt may freeze before the thin sections are filled. If the shell temperature is too high, the cooling rate decreases, and the solidification time increases. A longer solidification time can improve feeding because the feeding path remains open longer. However, it can also increase grain size and reduce mechanical properties. Therefore, the shell temperature must be optimized together with the pouring temperature and filling time. In my work, the shell preheating condition was kept consistent across the trials, and the simulation used the same thermal boundary condition. This ensured that the comparison between schemes was fair.
The mold shell also affects the thermal gradient. A thick shell has higher thermal resistance, so it slows heat extraction. A thin shell extracts heat faster. In precision casting, the shell thickness is often varied locally to control cooling. For example, a chill can be placed near a thick hot spot to increase the cooling rate and reduce the hot spot size. Alternatively, an insulating sleeve can be placed around a riser to keep it liquid longer. In my simulation, I did not rely on local chills in the final scheme. Instead, I used a balanced gating and feeding design to achieve directional solidification. This is often more robust in production because it reduces the number of process variables. However, local cooling can be useful in future optimization if the hot spot cannot be fed by geometry alone.
I also evaluated the effect of pouring temperature. The pouring temperature was 710 °C. A higher temperature would increase fluidity and improve filling of the thin spiral wall, but it would also increase shrinkage and gas absorption. A lower temperature would reduce shrinkage but could cause misruns and cold shuts. The selected temperature is a compromise. The simulation showed that 710 °C provided sufficient superheat for filling and acceptable solidification behavior. In the trials, the castings filled completely, and no misruns were observed. This confirms that the pouring temperature is appropriate for this precision casting process.
The filling time of 15 s was also validated. A shorter filling time would increase the flow velocity and Reynolds number, raising the risk of turbulence and oxide entrainment. A longer filling time would allow more heat loss and could cause premature solidification in the thin wall. The 15 s filling time produced a smooth and stable filling pattern in Scheme 2. This is consistent with the trial results, which showed complete filling and no surface defects.
I summarized the optimized process window in Table 10. This table can be used as a reference for future production of similar AlSiCuSc alloy volutes. The key parameters include pouring temperature, filling time, shell preheating, and gating design. The table also includes the expected outcome based on simulation and trial verification.
| Parameter | Optimized value | Reason |
|---|---|---|
| Pouring temperature | 710 °C | Balances fluidity and shrinkage |
| Filling time | 15 s | Provides stable progressive filling |
| Gating scheme | Scheme 2 | No isolated liquid region, lowest porosity |
| Process yield | 13.1% | Highest among the three schemes |
| Predicted porosity | 0.04 cm3 | Below the acceptable threshold |
| DR inspection | No shrinkage defects | Confirmed by multiple batches |
In my conclusion, the AlSiCuSc alloy turbine volute can be successfully produced by precision casting when the gating and feeding system is designed with the aid of numerical simulation. The three schemes I compared showed different filling and solidification behaviors. Scheme 1 had unstable filling and a large predicted porosity volume. Scheme 3 had an isolated liquid region at the small flange bottom. Scheme 2 provided smooth filling, no isolated liquid region, and the smallest porosity volume. The experimental trials confirmed the simulation results. The castings produced with Scheme 2 showed no shrinkage porosity or cavity under DR inspection. This validated the feasibility and accuracy of the simulation model. The optimized process provides a reliable theoretical basis and a practical optimization route for high-quality and high-yield precision casting of turbine volutes. I believe that the combination of thermal-physical modeling, Niyama-based defect prediction, and experimental validation is a powerful approach for precision casting process development. It reduces trial-and-error, improves internal quality, and supports the production of safety-critical components with complex thin-thick geometry.