
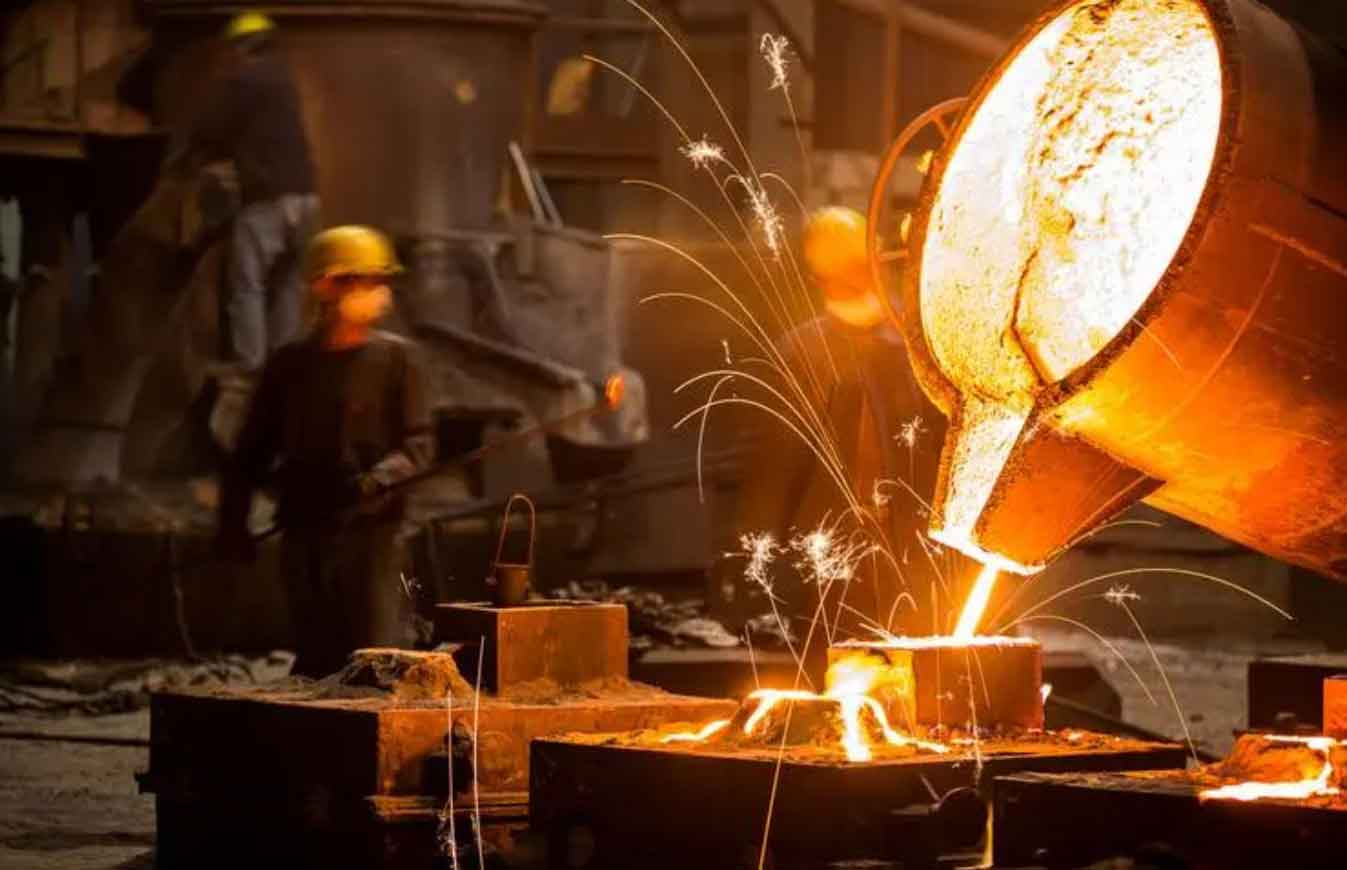
In this study, I investigated how 3D printed sand mould casting can be used to manufacture complex metal components with short lead times, high dimensional accuracy, and reliable mechanical performance. I focused on the interaction between sand mould casting parameters, printing parameters, melt pouring conditions, and the final microstructure and properties of aluminium alloy castings. I then applied the optimized sand mould casting route to a complex automotive engine cylinder block, designed a conformal gating system, validated it by numerical simulation, and produced the component by rapid sand mould casting. The results show that 3D printed sand mould casting is not highly sensitive to part complexity and can integrate the flexibility of additive manufacturing with the productivity and material versatility of conventional sand mould casting.
1. Introduction
Conventional manufacturing technologies are often sensitive to the geometric complexity of parts. When a component contains internal channels, thin walls, integrated ribs, or multiple functional cavities, the tooling cost, assembly error, and development time increase sharply. In contrast, sand mould casting based on 3D printing is much less sensitive to complexity. By combining the design freedom of additive manufacturing with the economic advantages of sand mould casting, it is possible to achieve integrated, short-cycle, high-precision, and high-value production. This route is especially attractive for automotive, shipbuilding, aerospace, and rail transportation components.
Aluminium alloys are increasingly used in lightweight structures because of their high specific strength, good corrosion resistance, and excellent castability. In automotive engines, aluminium cylinder blocks can replace heavier ferrous components while maintaining sufficient stiffness and thermal performance. However, cylinder blocks contain complex water jackets, oil galleries, bearing saddles, and cylinder liners. These features make traditional sand mould casting difficult because multiple cores and mould segments are required. 3D printed sand mould casting offers a way to produce an integrated sand mould with conformal gating, local chilling, and embedded auxiliary features.
In this work, I studied the influence of 3D printing parameters and sand mould casting parameters on the microstructure and mechanical properties of an Al-Si-Mg casting alloy. I compared 3D printed sand moulds with conventional green sand moulds and permanent metal moulds. I then designed a conformal gating system for an engine cylinder block and used casting simulation to evaluate filling, solidification, and defect formation. Finally, I produced the cylinder block by rapid sand mould casting and evaluated its dimensional quality, internal defects, liner bonding, microstructure, and mechanical properties.
2. Materials and Experimental Methods
2.1 Alloy and Melting
The target material was ZL101A, an Al-Si-Mg casting alloy equivalent to AlSi7Mg0.3. The standard composition range and the actual composition used in my experiments are listed in Table 1 and Table 2. I added a small amount of Sr to modify the eutectic silicon and improve melt fluidity. Mg was retained to form Mg2Si during aging, while Fe and Mn were controlled because acicular or plate-like Fe-rich phases can reduce ductility and toughness.
| Element | Si | Mg | Ti | Al |
|---|---|---|---|---|
| Standard range, wt.% | 6.5-7.5 | 0.25-0.45 | 0.08-0.20 | Balance |
| Element | Si | Mg | Ti | Sr | Fe | Zn | V | Al |
|---|---|---|---|---|---|---|---|---|
| Measured, wt.% | 7.223 | 0.322 | 0.106 | 0.041 | 0.109 | 0.017 | 0.015 | Balance |
I melted the alloy in an induction furnace with a capacity of 70 kg and a rated power of 160 kW. The furnace was preheated until the chamber appeared dark red. Alloy ingots were charged in several batches, melted at approximately 740 degrees Celsius, and held for 30 to 40 minutes. After melting, I performed degassing and slag removal using a refining agent and argon gas. A rotary degassing unit was inserted into the melt to remove dissolved gas and inclusions. After refining, I added a Sr-containing modifier and held the melt for approximately 30 minutes before pouring.
2.2 Heat Treatment
I applied T6 heat treatment to selected castings. The treatment consisted of solution treatment at 530 degrees Celsius for 8 to 10 hours, quenching in warm water at approximately 70 degrees Celsius, and artificial aging at 180 degrees Celsius for 6 to 8 hours. The purpose of T6 treatment was to dissolve soluble phases, homogenize the matrix, and precipitate fine strengthening phases. In the as-cast condition, the alloy had lower strength and higher elongation. After T6 treatment, the strength increased, but elongation decreased because of the formation of hard eutectic Si particles and Mg2Si precipitates.
2.3 Sand Mould Printing
I used a binder jetting sand mould printing system. The printer had a maximum building size of 800 mm by 750 mm by 500 mm, two print heads, adjustable layer thickness from 0.2 to 0.5 mm, a typical printing speed of 20 to 25 s per layer, and a building efficiency of approximately 54 L/h. The sand was high-white silica sand with irregular and near-spherical particles. The particle size was mainly between 0.05 and 0.38 mm, with a dominant fraction around 0.15 mm. The binder was furan resin, added at 2.36 wt.% of the sand mixture, and the hardener was a sulfonic acid type, added at 0.4 wt.% of the sand mixture. After printing, the mould was allowed to cure for 60 minutes before handling.
I measured the properties of printed sand specimens using standard sand testing methods. The results are summarized in Table 3. The tensile strength, compressive strength, bending strength, permeability, and gas evolution were all within ranges suitable for gravity sand mould casting.
| Property | Tensile strength | Compressive strength | Bending strength | Permeability | Gas evolution |
|---|---|---|---|---|---|
| Measured value | 0.8-1.5 MPa | > 2 MPa | 1-2.5 MPa | 80-120 | 12-14 |
2.4 Microstructure and Property Testing
I cut 15 mm cubic samples from castings for metallographic analysis. Samples were ground with 800 to 3000 grit SiC paper, polished with diamond suspension, cleaned ultrasonically, and etched with 0.5% HF. Optical microscopy and scanning electron microscopy were used to examine microstructure and fracture surfaces. I measured secondary dendrite arm spacing (SDAS) by the linear intercept method:
$$d = \left( \sum_{i=1}^{m} \frac{l_i}{n_i – 1} \right) / m$$
where d is SDAS, l_i is the intercept length of the i-th dendrite group, n_i is the number of intersections, and m is the number of measured groups. A smaller SDAS indicates a finer microstructure, less segregation, and better response to heat treatment.
I measured density by Archimedes principle:
$$\rho = \frac{m_A \rho_w}{m_A – m_B}$$
where m_A is the mass in air, m_B is the mass in water, and rho_w is the density of water. Tensile tests were performed on cylindrical specimens according to standard procedures. The gauge length was 50 mm, the original diameter was 10 mm, and the crosshead speed was 10 mm/min. I tested three specimens for each condition and averaged the results.
3. Optimization of 3D Printed Sand Mould Casting Parameters
3.1 Comparison of Mould Types
I first compared castings produced in a conventional sand mould, a 3D printed sand mould, and a permanent metal mould. The alloy was ZL101A, the pouring temperature was 720 degrees Celsius, and the sand moulds were dried but not preheated before pouring. Table 4 summarizes the microstructure and properties.
| Mould type | SDAS, micrometre | Tensile strength, MPa | Elongation, % | Density, g/cm3 |
|---|---|---|---|---|
| Conventional sand mould | 63.05 | 127 | 1.9 | 2.6260 |
| 3D printed sand mould | 84.08 | 131 | 2.2 | 2.6300 |
| Permanent metal mould | 25.94 | 184 | 3.4 | 2.6753 |
The permanent metal mould produced the finest microstructure and the highest strength because of rapid heat extraction. The 3D printed sand mould casting had a coarser microstructure than the conventional sand mould casting, but its tensile strength and elongation were slightly higher. I attributed this to the more uniform mould density, controlled printing parameters, and lower inclusion content of the printed sand mould. The conventional sand mould casting showed more gas porosity and local shrinkage. Therefore, in sand mould casting, 3D printed moulds can provide a better balance between mould rigidity and casting quality.
Fracture surfaces showed that the conventional sand mould casting contained many cleavage facets and coarse Si particles. The 3D printed sand mould casting showed a mixed cleavage and dimple fracture mode, which explained its slightly better elongation. The metal mould casting showed more dimples and a more ductile fracture mode.
3.2 Effect of Mould Preheating
I dried the printed sand moulds and then poured at room temperature, 100 degrees Celsius, 150 degrees Celsius, and 200 degrees Celsius. The pouring temperature was 720 degrees Celsius. After T6 treatment, the SDAS values are listed in Table 5. As the preheating temperature increased, the SDAS increased from 57.58 micrometres at room temperature to 90.72 micrometres at 200 degrees Celsius, an increase of about 36.5%. Higher mould preheating reduced the cooling rate, promoted dendrite coarsening, and decreased mechanical properties.
| Mould preheating temperature, degrees Celsius | SDAS, micrometre | Tensile strength, MPa | Elongation, % |
|---|---|---|---|
| Room temperature | 57.58 | 218 | 0.4 |
| 100 | 68.21 | 214 | 0.4 |
| 150 | 78.53 | 210 | 0.3 |
| 200 | 90.72 | 205 | 0.3 |
For sand mould casting without special thermal requirements, I recommend drying the printed mould to remove moisture and volatile binder components, cooling it to room temperature, and then pouring directly. This practice avoids excessive gas evolution, maintains a fast cooling rate, refines the microstructure, and reduces porosity.
3.3 Effect of Pouring Temperature
I also studied pouring temperatures of 700, 710, 720, and 740 degrees Celsius. The printed sand moulds were dried at 150 degrees Celsius for 2 hours and cooled to room temperature before pouring. The results are shown in Table 6. The best combination of microstructure and mechanical properties occurred at 720 degrees Celsius. At lower temperatures, the melt solidified too early, modification was incomplete, and interdendritic porosity increased. At higher temperatures, the cooling rate decreased, eutectic Si coarsened, and Fe-rich phases such as beta-Fe, alpha-Fe, and pi-Fe precipitated.
| Pouring temperature, degrees Celsius | SDAS, micrometre | Tensile strength after T6, MPa | Elongation after T6, % | Observed condition |
|---|---|---|---|---|
| 700 | 74.12 | 211 | 0.4 | Incomplete modification, early solidification |
| 710 | 72.35 | 218 | 0.4 | Some plate-like eutectic Si |
| 720 | 70.69 | 229 | 0.5 | Fine and uniform eutectic Si |
| 740 | 76.84 | 215 | 0.3 | Coarsening and Fe-rich phase precipitation |
The fracture surfaces of T6-treated 3D printed sand mould castings showed brittle fracture characteristics, with tearing ridges, secondary cracks, and cleavage steps. Pores and coarse dendrites acted as crack initiation sites. Fe-rich phases and inclusions promoted crack propagation and reduced elongation. Therefore, careful control of pouring temperature and melt cleanliness is essential for sand mould casting of high-integrity aluminium components.
3.4 Effect of Printing Layer Thickness
I printed sand moulds with layer thicknesses of 0.4 mm and 0.5 mm. The other printing parameters were kept constant. A smaller layer thickness produced more printed layers and therefore a higher total binder content. The results are summarized in Table 7. The 0.5 mm layer thickness gave better overall casting quality. The mould had sufficient strength, lower gas evolution, and lower porosity. The 0.4 mm layer thickness increased mould density and cooling rate, but it also increased binder content and gas defects.
| Printing layer thickness, mm | SDAS after T6, micrometre | Tensile strength after T6, MPa | Elongation after T6, % | Density, g/cm3 |
|---|---|---|---|---|
| 0.4 | 57.60 | 218 | 0.4 | 2.6454 |
| 0.5 | 70.70 | 229 | 0.5 | 2.6503 |
| Conventional sand casting reference | Not measured | Not measured | Not measured | 2.6375 |
The density of the 0.5 mm layer thickness casting was 2.6503 g/cm3, which is close to the theoretical density of the aluminium alloy and slightly higher than the conventional sand mould casting. I therefore selected a printing layer thickness of 0.5 mm, a printing speed of 25 s/layer, single-pass printing, drying at 150 degrees Celsius, and room-temperature pouring for subsequent sand mould casting trials.
4. Design and Simulation of the Gating System for a Cylinder Block
4.1 Component Characteristics
I selected an automotive engine cylinder block as the target complex part. The block was an in-line three-cylinder design with an overall envelope of approximately 500 mm by 500 mm by 500 mm. The wall thickness ranged from 2 mm to 40 mm. The thinnest regions were the gaps between adjacent cylinder liners. To improve wear resistance, three cast iron cylinder liners with an outer diameter of 87.6 mm and a wall thickness of 6 mm were embedded in the aluminium block. The post-casting liner outer diameter had to remain above 83 mm, and the liner had to be fully bonded to the aluminium alloy without gaps.
The cylinder block contained water jackets, oil galleries, bearing saddles, assembly holes, and thin walls. These features made conventional sand mould casting difficult because multiple cores and mould segments would be needed. I therefore used 3D printed sand mould casting to integrate the mould, cores, conformal runners, vents, and local chilling features.
4.2 Gating and Riser Design
I used a step gating system with two levels of conformal runners. The cross-sectional area ratio was selected according to the large-orifice discharge principle:
$$A_{sp} : A_{runner} : A_{ingate} = 1 : (2\sim4) : (2\sim4)$$
The required ingate area was estimated by:
$$A_{ingate} = \frac{G_L}{\rho_L \mu t \sqrt{2 g h_p}}$$
where G_L is the mass of melt passing through the lowest section, rho_L is the melt density, mu is the flow loss coefficient, t is the pouring time, g is gravitational acceleration, and h_p is the pressure head at the ingate. For the four-element gating system, I used:
$$h_p = \frac{k_2^2 H_p}{1 + k_1^2 + k_2^2}$$
where k_1 is the ratio of sprue area to runner area, k_2 is the ratio of sprue area to ingate area, and H_p is the static pressure head:
$$H_p = H_0 – 0.5 h_c$$
Here H_0 is the total sprue height and h_c is the casting height. Based on these calculations, I selected a sprue diameter of 60 mm. The total poured mass was approximately 48 kg, and the pouring time was approximately 16 s. The mass and mass flow rate were calculated by:
$$Mass = Volume \times \left( \frac{Fill\ Limit (\%)}{100} \right) \times Density(F(T))$$
$$Mass\ Flow\ Rate = \frac{Mass}{Fill\ Time}$$
I evaluated three casting process plans, as summarized in Table 8. Plan A placed the block upright. Plan B placed the block on its side. Plan C placed the block upside down so that the cylinder liners were filled first. The process yield and castability differed among the three plans.
| Process plan | A: upright | B: side | C: inverted |
|---|---|---|---|
| Total poured mass, kg | 46.99 | 40.86 | 48.17 |
| Process yield, % | 38.52 | 44.30 | 37.58 |
| Main feature | Thin lower walls filled first | Thick bearing region filled first | Cylinder liners filled first |
4.3 Simulation Model and Boundary Conditions
I imported the three-dimensional models into casting simulation software. The casting, gating system, risers, sand mould, chills, filters, and cylinder liners were meshed with tetrahedral elements. The element size was 4 mm for the casting and gating system and 20 mm for the outer sand mould. The total number of volume elements was approximately 11.7 million. I used the following thermo-physical models for filling and solidification.
The continuity equation for incompressible melt flow was:
$$\frac{\partial u}{\partial x} + \frac{\partial v}{\partial y} + \frac{\partial w}{\partial z} = 0$$
The momentum equations in three directions were:
$$\frac{\partial u}{\partial t} + u\frac{\partial u}{\partial x} + v\frac{\partial u}{\partial y} + w\frac{\partial u}{\partial z} = -\frac{1}{\rho}\frac{\partial p}{\partial x} + g_x + \gamma\left(\frac{\partial^2 u}{\partial x^2} + \frac{\partial^2 u}{\partial y^2} + \frac{\partial^2 u}{\partial z^2}\right)$$
$$\frac{\partial v}{\partial t} + u\frac{\partial v}{\partial x} + v\frac{\partial v}{\partial y} + w\frac{\partial v}{\partial z} = -\frac{1}{\rho}\frac{\partial p}{\partial y} + g_y + \gamma\left(\frac{\partial^2 v}{\partial x^2} + \frac{\partial^2 v}{\partial y^2} + \frac{\partial^2 v}{\partial z^2}\right)$$
$$\frac{\partial w}{\partial t} + u\frac{\partial w}{\partial x} + v\frac{\partial w}{\partial y} + w\frac{\partial w}{\partial z} = -\frac{1}{\rho}\frac{\partial p}{\partial z} + g_z + \gamma\left(\frac{\partial^2 w}{\partial x^2} + \frac{\partial^2 w}{\partial y^2} + \frac{\partial^2 w}{\partial z^2}\right)$$
The energy equation was:
$$\frac{\partial T}{\partial t} + u\frac{\partial T}{\partial x} + v\frac{\partial T}{\partial y} + w\frac{\partial T}{\partial z} = \frac{\lambda}{\rho c}\left(\frac{\partial^2 T}{\partial x^2} + \frac{\partial^2 T}{\partial y^2} + \frac{\partial^2 T}{\partial z^2}\right) + \frac{S}{\rho c}$$
For solidification, I used the heat conduction equation:
$$\rho c_p \frac{\partial T}{\partial t} = \frac{\partial}{\partial x}\left(\lambda \frac{\partial T}{\partial x}\right) + \frac{\partial}{\partial y}\left(\lambda \frac{\partial T}{\partial y}\right) + \frac{\partial}{\partial z}\left(\lambda \frac{\partial T}{\partial z}\right) + Q$$
where the latent heat source term was:
$$Q = \rho L \frac{\partial f_s}{\partial T}$$
Convective heat transfer was described by:
$$q = a(T_f – T_w)$$
and radiative heat transfer by:
$$q = \varepsilon \sigma_0 T_s^4$$
The latent heat released over the solidification interval was approximated by:
$$\frac{\partial L}{\partial t}\Delta t = -\rho L \frac{\Delta T}{T_L – T_S}$$
For shrinkage porosity prediction, I used the Niyama criterion:
$$N = \sqrt{\frac{G}{R}}$$
where G is the temperature gradient:
$$G = \left[ \left(\frac{\partial T}{\partial x}\right)^2 + \left(\frac{\partial T}{\partial y}\right)^2 + \left(\frac{\partial T}{\partial z}\right)^2 \right]^{1/2}$$
and R is the cooling rate:
$$R = \left| \frac{T_L – T_S}{t_L – t_S} \right|$$
I also used the temperature gradient criterion:
$$G = \max\left(\frac{T_1 – T_0}{\Delta L}\right)$$
Boundary conditions included interface heat transfer coefficients of 500 W/(m2 K) between the casting and sand mould, 2000 W/(m2 K) between the casting and cast iron, and 500 W/(m2 K) between the cast iron and sand mould. The sand mould and chills initially were at room temperature. The cylinder liners were heated to 400 degrees Celsius by embedded heating rods. The melt was poured at 730 degrees Celsius with a mass flow rate of approximately 3 kg/s. The casting alloy was AlSi7Mg0.3, and the sand mould was a furan resin bonded sand. The filter was a high-density ceramic filter and did not occupy cavity volume.
4.4 Simulation Results
The filling results showed clear differences among the three plans. In Plan A, the melt entered the main body smoothly, and the upper runner was filled at about 11.20 s. However, the thick bearing region solidified slowly and could form an isolated liquid zone. In Plan B, the side placement caused severe turbulence near the ingate because the local wall was thin. The time difference between the top and bottom runners was large, and the cylinder liners were prone to floating or shifting. In Plan C, the melt first filled the cylinder liner region and then the main body. The main body was filled in about 10.67 s, which was faster than the other plans. The top runner was filled earlier, and the risers supplemented the casting effectively. The solidification front progressed more uniformly.
The solidification results are summarized in Table 9. In Plan A, the main body solidified completely between about 335 s and 440 s, and the isolated liquid zone disappeared at about 608 s, when about 84.7% of the casting had solidified. The last solidified region was the bearing ear hole, which had a large wall thickness. In Plan B, the solidification time difference was about 630 s, and the isolated liquid zone disappeared at about 700 s, when about 95% of the casting had solidified. This reduced the feeding efficiency of the risers. In Plan C, the solidification uniformity was the best. The isolated liquid zone in the main body disappeared at about 680 s, when about 82.8% of the casting had solidified. The cylinder liner region remained at a higher temperature because of the embedded heating rods, which improved bonding between the aluminium alloy and the cast iron liner.
| Process plan | Main body filling time, s | Isolated liquid zone disappearance time, s | Solid fraction at disappearance, % | Porosity volume, cc |
|---|---|---|---|---|
| A | 11.20 | 608 | 84.7 | 0.913 |
| B | Not uniform | 700 | 95.0 | 1.043 |
| C | 10.67 | 680 | 82.8 | 0.899 |
The defect prediction results are summarized in Table 10. Plan A had a porosity volume of 0.913 cc, but some light shrinkage appeared in the water jacket core. Plan B had a porosity volume of 1.043 cc and a large shrinkage region near the assembly hole, which would be unacceptable for a functional component. Plan C had the lowest porosity volume of 0.899 cc. The defects were small and located mostly in non-functional regions. I therefore selected Plan C as the optimal sand mould casting process for the cylinder block.
| Process plan | Average result, % | Porosity volume, cc | Porosity mass, mg | Assessment |
|---|---|---|---|---|
| A | 12.503 | 0.913 | 1.096 | Acceptable but less stable |
| B | 12.620 | 1.043 | 1.251 | Large local shrinkage, unacceptable |
| C | 11.102 | 0.899 | 1.078 | Best overall, acceptable |
5. Rapid Casting of the Cylinder Block
5.1 Sand Mould Printing and Assembly
After simulation optimization, I converted the gating system and cylinder block model into an integrated sand mould design. I split the mould into upper and lower sections for assembly. I set a printing shrinkage compensation of 0.1% to 1% to account for dimensional deviation. The sliced model contained 1215 layers at a layer thickness of 0.5 mm. The printing parameters were a layer thickness of 0.5 mm, single pass, a building area of 1800 mm by 1000 mm, a resolution of 300 dpi, a bit depth of 1 bit, and a printing speed of 25 s/layer. The full sand mould required approximately 10 hours to print.
After printing, I allowed the mould to cure, removed loose sand, and cleaned the cavity surfaces. I sprayed a water-based foundry coating on the mould cavity and dried the mould at 150 degrees Celsius for 2 hours. I then installed chills, filters, cylinder liners, and heating plates. The chills were bonded to the mould with foundry adhesive. The cylinder liners were positioned with the heating rods embedded in the core. The mould segments were assembled and sealed to prevent melt leakage. I used a portable assembly and positioning device to improve alignment accuracy.
5.2 Melting, Pouring, and Post-processing
I melted ZL101A alloy in a 70 kg furnace. The total poured mass was approximately 48 kg. Before pouring, I preheated the pouring tools and brought the cylinder liners to approximately 400 degrees Celsius. The pouring temperature was 730 degrees Celsius. After pouring, I allowed the casting to solidify in the mould for about 10 minutes before shakeout. I then water-cooled the casting, removed the gating and riser system, and performed T6 heat treatment: solution treatment at 530 degrees Celsius for 12 hours and aging at 180 degrees Celsius for 6 hours. After heat treatment, I inspected the casting by X-ray radiography, pressure leak testing, and dimensional measurement.
5.3 Inspection Results
The overall production cycle from design to finished casting was only 3 to 4 days. The cast surface was smooth, and no obvious macroscopic defects were observed. The dimensional accuracy reached CT 7, which is better than conventional sand mould casting. X-ray inspection showed no significant inclusions or large pores in the oil galleries, assembly holes, cooling water channels, main shaft region, or cylinder liner region. The cylinder liner and aluminium alloy were well bonded.
I dissected the cylinder liner region to evaluate bonding. The measured post-casting liner outer diameter was 85.67 mm, which exceeded the minimum requirement of 83 mm. The average penetration or diffusion depth between the aluminium alloy and the cast iron liner was 2 to 3 mm. This indicates good metallurgical and mechanical bonding. Pressure leak testing was performed at 0.3 MPa for 5 to 10 minutes. No bubbles or leakage were observed, confirming that no through-thickness porosity or micro-pinholes were present.
Microstructure analysis showed that the aluminium matrix was fine and uniform. Eutectic Si particles were distributed evenly, and no obvious elemental segregation was observed. The interface between the cast iron liner and the aluminium alloy was continuous and free from cracks or voids. These features are important for the fatigue strength, wear resistance, and pressure tightness of the cylinder block.
The mechanical properties of the cylinder block casting after T6 treatment are listed in Table 11. The tensile strength was 278 MPa, the elongation was 2.3%, and the Brinell hardness was 97 HB. All values exceeded the requirements for automotive cylinder block castings. These results confirm that 3D printed sand mould casting can produce complex, high-integrity components with reliable performance.
| Alloy designation | Casting method | Condition | Tensile strength, MPa | Elongation, % | Brinell hardness, HB |
|---|---|---|---|---|---|
| ZL101 | Sand mould casting | T6 | > 220 | > 2.0 | 80 |
| ZL101 | 3D printed sand mould casting | T6 | 278 | 2.3 | 97 |
6. Discussion
The results of this study show that sand mould casting based on 3D printing is a practical route for complex metal components. The printed sand mould acts as both a mould and a functional core system. Because the mould is built layer by layer, conformal runners, local chills, vent channels, and heating passages can be integrated without additional tooling. This reduces the number of mould segments, eliminates core assembly errors, and shortens the development cycle.
However, the process is not independent of parameter control. The printing layer thickness affects binder content, mould density, permeability, and gas evolution. A smaller layer thickness increases the number of printed layers and the total binder content. During pouring, residual binder can decompose and generate gas. If the gas cannot escape through the mould or vents, it may enter the melt and form porosity. Therefore, a moderate layer thickness such as 0.5 mm provides a good compromise between mould strength and gas evolution.
Mould preheating also plays an important role. Preheating reduces the cooling rate and increases fluidity, which can be beneficial for thin walls. However, excessive preheating coarsens the microstructure and reduces mechanical properties. For the Al-Si-Mg alloy used here, drying the printed mould and pouring at room temperature produced the finest microstructure and the best combination of strength and elongation. This is consistent with the heat transfer behavior of sand mould casting: a lower mould temperature increases the temperature gradient, promotes directional solidification, and shortens the local solidification time.
Pouring temperature is another critical variable. At 720 degrees Celsius, the melt has sufficient fluidity to fill the mould, but it does not overheat the sand mould or cause excessive oxidation. At lower temperatures, the melt may solidify before the cavity is completely filled, especially in thin sections. At higher temperatures, the cooling rate decreases, eutectic Si coarsens, and Fe-rich intermetallics precipitate. These phases can act as stress concentrators and crack initiation sites. Therefore, the pouring temperature should be selected based on alloy composition, wall thickness, and mould thermal properties.
For the cylinder block, the conformal gating system improved filling efficiency and made the melt flow more rational. Plan C, in which the cylinder liners were filled first, produced the best results. The heating rods kept the liner region at approximately 400 degrees Celsius, which promoted bonding between the aluminium alloy and the cast iron liner. The two-level runner system supplied melt to both the lower and upper regions of the casting. The risers compensated for solidification shrinkage. The simulation predicted a total porosity volume of only 0.899 cc, and the actual casting showed no significant defects. This agreement validates the use of simulation for sand mould casting process design.
The final cylinder block casting met the dimensional and mechanical requirements. The tensile strength of 278 MPa, elongation of 2.3%, and hardness of 97 HB are comparable to or better than those of conventional sand mould castings. The cylinder liner bonding depth of 2 to 3 mm is sufficient for engine service. The pressure leak test confirmed that the casting was pressure-tight. These results demonstrate that 3D printed sand mould casting can be used for rapid prototyping and small-batch production of complex automotive components.
7. Conclusions
I studied the process parameters, microstructure, mechanical properties, simulation, and rapid casting of complex parts using 3D printed sand mould casting. The main conclusions are as follows.
First, 3D printed sand mould casting can achieve comprehensive properties comparable to or slightly better than conventional sand mould casting. Under the same gravity casting conditions, the as-cast tensile strength of a 3D printed sand mould casting was 131 MPa with an elongation of 2.2%, while a conventional sand mould casting had a tensile strength of 127 MPa and an elongation of 1.9%. After T6 treatment, the 3D printed sand mould casting reached 229 MPa and 0.5% elongation. The printed mould produced a more uniform microstructure, lower inclusion content, and lower porosity.
Second, printing and casting parameters strongly affect casting quality. A layer thickness of 0.5 mm, a printing speed of 25 s/layer, single-pass printing, drying at 150 degrees Celsius, and pouring at 720 degrees Celsius produced the best results. The density of the casting was 2.6503 g/cm3, which is close to the theoretical density. Mould preheating above room temperature coarsened the microstructure and reduced mechanical properties, so drying followed by room-temperature pouring is recommended for the alloy studied here.
Third, a conformal gating system was designed for an engine cylinder block. Simulation showed that placing the cylinder liners in the lower part, heating them to 400 degrees Celsius, pouring at 730 degrees Celsius, and using a mass flow rate of about 3 kg/s produced complete filling and uniform solidification. The main body was filled in 10.67 s. The total porosity volume was only 0.899 cc, and no significant defects appeared in critical regions. Plan C was selected as the optimal sand mould casting process.
Fourth, the cylinder block was successfully produced by 3D printed sand mould casting in a production cycle of only 3 to 4 days. The casting had no obvious defects, dimensional accuracy reached CT 7, and the cylinder liner bonding depth was 2 to 3 mm. The post-casting liner diameter was 85.67 mm. After T6 treatment, the tensile strength was 278 MPa, the elongation was 2.3%, and the hardness was 97 HB. These values meet the requirements for automotive cylinder block castings. Therefore, sand mould casting with 3D printed moulds is a promising technology for rapid trial production and manufacturing of complex, high-value components.
8. Recommendations for Further Study
Although the results are encouraging, further work is needed. I recommend studying the effect of different sand types and sand blends on mould strength, permeability, and casting surface quality. I also recommend developing low-toxicity or inorganic binders and quantifying the volatilization and residue behavior of chemical binders during pouring. Finally, the collapse performance of printed sand moulds after casting should be investigated to improve shakeout efficiency and sand reclamation. These topics will help expand the industrial application of sand mould casting with 3D printed moulds.