
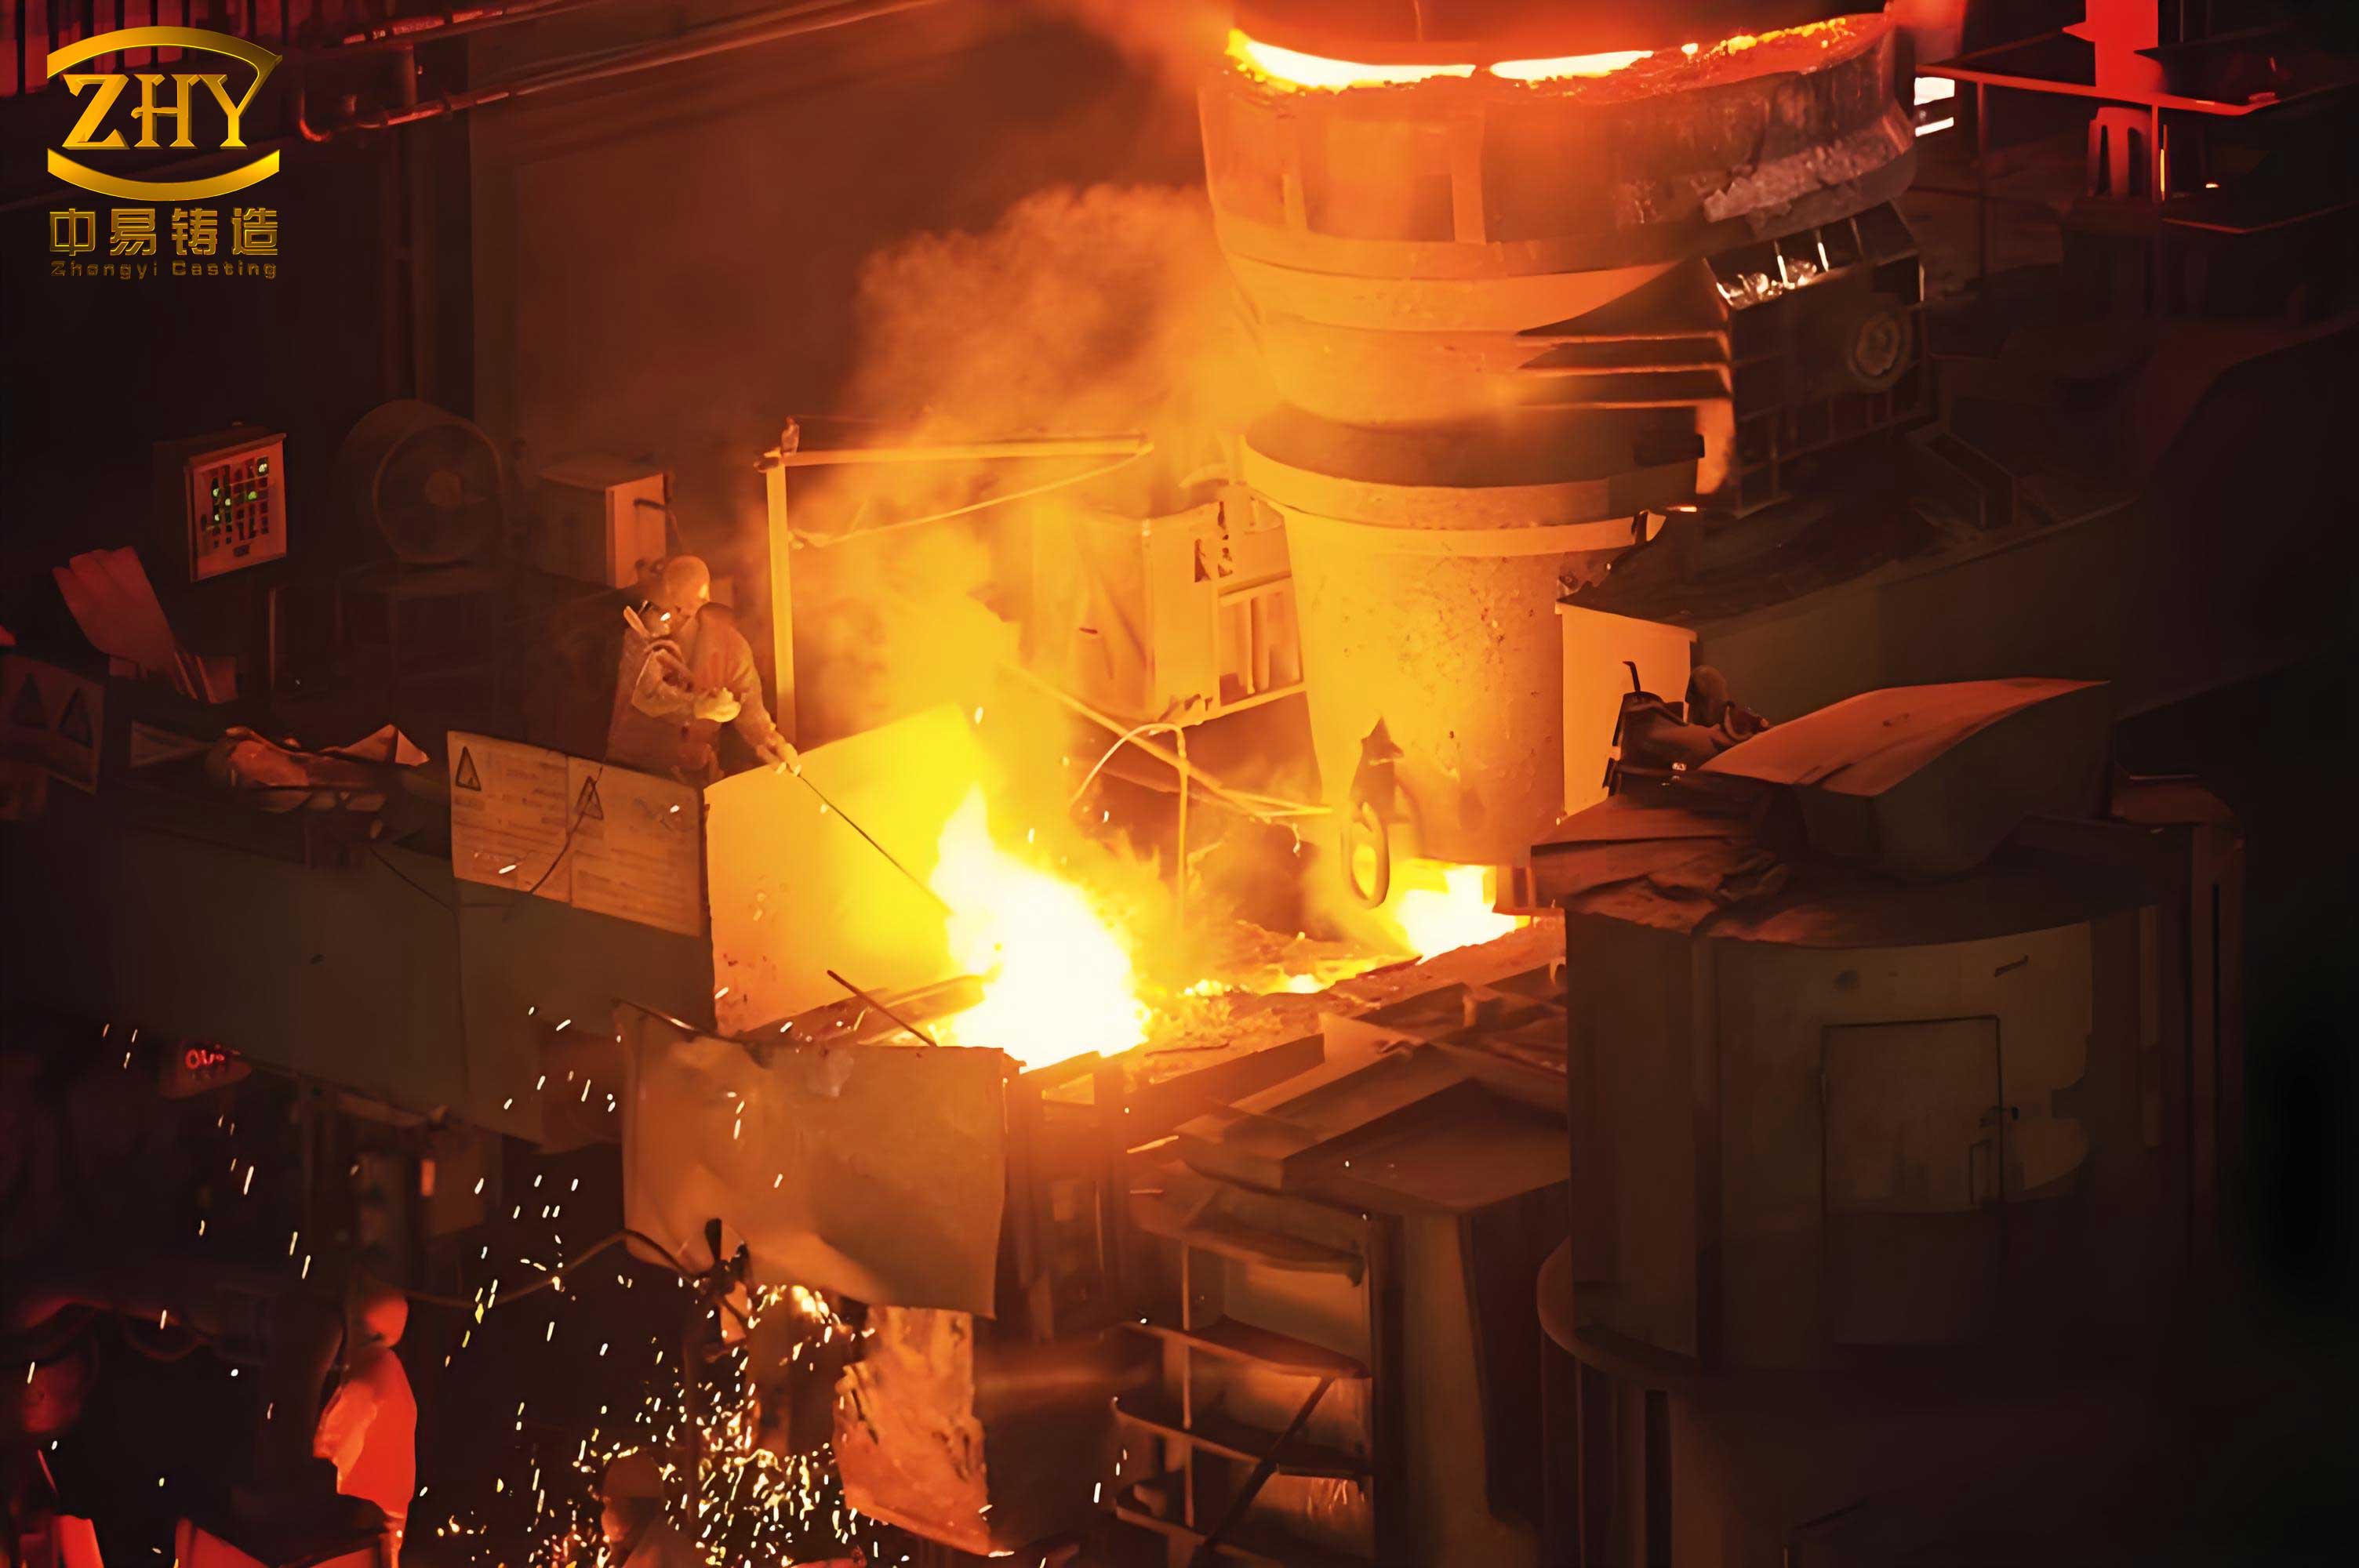
Over the past two decades, the rapid advancement of computer technology has significantly transformed manufacturing industries. Digitalization, networking, and intelligent technologies have become the main drivers of the new industrial revolution, providing novel technical pathways for quality control. Many manufacturing enterprises have implemented information management systems such as Enterprise Resource Planning (ERP) and Manufacturing Execution Systems (MES) to achieve digital management. In the context of a sand casting foundry, which is a critical branch of the casting industry—particularly in the production of engine cylinder heads and blocks for automotive applications—the complexity of the manufacturing process, extended production flow, and high output volumes often lead to significant quality variability and difficulties in defect traceability. In recent years, facing pressures from industrial upgrading, environmental regulations, and evolving customer requirements, sand casting foundry enterprises have been transitioning toward automation and information-driven production. On the shop floor, numerous data acquisition devices have been deployed and integrated with ERP and MES systems. These information systems record a vast amount of real production data—including equipment parameters, process conditions, environmental factors, and quality metrics—representing a rich repository of relationships between production parameters and casting quality. However, in many cases, this “wealth” of data remains untapped or is only partially utilized, leading to a situation often described as “data explosion but knowledge poverty.” If we can perform deep data mining on all collected data based on the existing information management foundation, we can uncover the coupling relationships among various process links and parameters. This would greatly help a sand casting foundry better control quality and trace defects. Therefore, data mining for a sand casting foundry holds great significance.
Data mining is the process of analyzing large volumes of existing data to discover meaningful new relationships, trends, and patterns. It involves extracting potentially valuable information from random, massive, noisy, incomplete, and fuzzy databases. In the artificial intelligence domain, it is often referred to as knowledge discovery in databases (KDD). Data mining is currently in a “chasm” stage of its lifecycle, requiring time and research effort to mature and become widely accepted. It has already been applied in fields such as financial management, insurance, and management system research, while its application in the casting industry is still in its infancy. It is important to note that data mining requires large amounts of data; only when data volumes are sufficiently large can the mining results become stable and approach the real underlying relationships. ERP and MES systems naturally provide the necessary data support. Hence, integrating an ERP system and conducting data mining on top of it represents a crucial development direction for quality control and product quality improvement in a sand casting foundry.
In this work, we propose a data mining methodology based on the Huazhu ERP system and apply it to a real sand casting foundry enterprise for production quality analysis and defect traceability. The goal is to enhance product quality and improve enterprise efficiency. The sand casting foundry we worked with is a subsidiary of a larger state-owned enterprise, primarily producing diesel engine components such as cylinder blocks, cylinder heads, crankshafts, and flywheels. It operates a low-variety, high-volume sand casting production line. Due to stringent quality requirements, the company had previously implemented the Huazhu ERP system and adopted single-piece management for castings. Through on-site investigation and analysis, the business process of the Huazhu ERP system in this sand casting foundry was configured as follows: order entry → routing definition, bill of materials (BOM) creation, casting process assignment → production preparation → planned production release → production processing → sales and shipping. Production preparation includes mold management, raw material management, and procurement management.
The data mining work can be divided into three parts: data collection, data mining model, and result visualization.
Data Collection
Every step in the production process generates data that is entered into the system either through automatic device acquisition or manual input. This provides the data foundation for mining. The following table summarizes the key data collection modules in the Huazhu ERP system used by the sand casting foundry.
| Module | Data Type | Collection Method | Description |
|---|---|---|---|
| Device Data Acquisition | Process parameters (temperature, pressure, cycle time, etc.) | Automatic sensors and PLC | Captures real-time data from molding, pouring, shakeout, and other equipment |
| Order Entry | Customer order details, part numbers, quantities, deadlines | Manual input | Records all sales orders and customer requirements |
| Process Card | Casting process parameters, alloy specifications, core settings, etc. | Manual input | Defines the manufacturing instructions for each casting type |
| Quality Registration | Inspection results, defect types, non-conformance reports | Manual input (operator or QC) | Logs quality data for each single casting or batch |
| Shipping Registration | Shipment quantities, dates, destinations | Manual input | Records outbound logistics and delivery confirmation |
| Production Registration | Production start/end times, operator IDs, machine IDs | Manual or barcode scan | Tracks the progress of each production order |
All these data streams are stored in a SQL Server relational database. The volume of data collected over months and years is substantial, enabling robust data mining.
Data Mining Model
Various data mining techniques exist, including neural networks, decision trees, association analysis, rough sets, fuzzy sets, statistical analysis, covering positive and negative examples, and visualization. The core technology of the Huazhu ERP system is database technology, using SQL Server—a relational database that links different two-dimensional tables through a relational model. This structure is well suited for association analysis. Therefore, our proposed mining model primarily relies on association analysis and neural network methods.
The model is structured as follows. It takes the casting identification number (single-piece ID) as input. At the first level, this ID can be associated with the order, quality record, and production release record. The order further links to customer and shipping management, enabling mining of customer demand patterns. The production release record links to the process card. The quality record, on one hand, can be correlated via date to all process parameters of every production step, and together with the process card allows mining of process–quality relationships. On the other hand, the quality record itself can be analyzed to identify defect causes and bottleneck processes.
According to the model, the key database tables involved include:
- Order Detail Table
- Planned Production Release Table
- Production Quality Inspection Table
- Production Parameter Recording Table
- Shipping Note Table
The relationships among these tables are illustrated by the primary and foreign key constraints, as shown in the following table (the underlined fields represent primary keys).
| Table Name | Primary Key | Foreign Key(s) | Key Fields |
|---|---|---|---|
| Order Detail | OrderID, PartID | CustomerID | Quantity, DueDate, Price |
| Planned Production Release | ReleaseID | OrderID, PartID, ProcessCardID | PlannedQty, StartDate, EndDate |
| Production Quality Inspection | InspectionID | ReleaseID, PartID | DefectType, Severity, InspectionDate, Result (Pass/Fail) |
| Production Parameter Recording | ParamID | ReleaseID, MachineID | Temperature, Pressure, CycleTime, DopantAmount, … |
| Shipping Note | ShippingID | OrderID | ShippedQty, ShippingDate, Destination |
Using SQL joins, we can retrieve complex relationships. For example, to analyze the impact of pouring temperature on defect occurrence for a specific part, we can execute a query that joins the quality inspection table with the parameter recording table on ReleaseID and PartID. The mining model is essentially a star schema centered on the casting ID, allowing us to drill down or roll up across dimensions.
We employ association rule mining to discover frequent patterns. Let us define the set of items I = {i1, i2, …, in} representing distinct process parameter intervals or defect types. A transaction T is a set of items recorded for a single casting (or a production batch). The support of an itemset X is the proportion of transactions containing X:
$$ \text{support}(X) = \frac{ \# \text{transactions containing } X }{ \text{total number of transactions} } $$
The confidence of a rule X → Y is:
$$ \text{confidence}(X \Rightarrow Y) = \frac{ \text{support}(X \cup Y) }{ \text{support}(X) } $$
We apply the Apriori algorithm to generate rules with minimum support (e.g., 0.05) and minimum confidence (e.g., 0.7). The following table shows an example of discovered association rules in the sand casting foundry.
| Rule | Support | Confidence | Lift |
|---|---|---|---|
| {PouringTemp=1420-1440°C, MoldHardness=85-90} → {Defect=Shrinkage} | 0.06 | 0.82 | 2.3 |
| {CarbonEquivalent=3.4-3.6, CoreSettingTime=8-10min} → {Defect=Blowhole} | 0.04 | 0.75 | 1.9 |
| {CycleTime=12-14s, SandMoisture=3.0-3.5%} → {Defect=None} | 0.12 | 0.85 | 1.1 |
Beyond association rules, we also build a neural network model to predict the quality outcome (e.g., pass/fail or defect category) based on a set of input process parameters. The architecture is a multi-layer perceptron (MLP) with one hidden layer. The input vector x consists of normalized continuous variables (pouring temperature, sand moisture, cycle time, etc.) and one-hot encoded categorical variables (alloy type, core type, etc.). The output layer has a single neuron for binary classification (good vs. defective) using a sigmoid activation function. The network is trained using backpropagation with gradient descent, minimizing the cross-entropy loss:
$$ L = – \frac{1}{N} \sum_{i=1}^{N} \left[ y_i \log(\hat{y}_i) + (1-y_i) \log(1-\hat{y}_i) \right] $$
where \(y_i\) is the true label (0 for good, 1 for defective) and \(\hat{y}_i\) is the predicted probability. The hidden layer uses a ReLU activation function:
$$ \text{ReLU}(z) = \max(0, z) $$
The update rule for weight \(w_{jk}\) in layer \(l\) is:
$$ w_{jk}^{(l)} := w_{jk}^{(l)} – \eta \frac{\partial L}{\partial w_{jk}^{(l)}} $$
where \(\eta\) is the learning rate. The following table summarizes the neural network structure used in this sand casting foundry application.
| Layer | Number of Neurons | Activation Function | Input Size |
|---|---|---|---|
| Input | 15 (after encoding) | – | 15 |
| Hidden | 32 | ReLU | 15 |
| Output | 1 | Sigmoid | 32 |
We trained the model on historical data from 12 months of production (approximately 50,000 castings) and validated on a separate test set (10,000 castings). The prediction accuracy reached 89.2%, which is significantly better than a baseline classifier (e.g., logistic regression at 82.5%). The confusion matrix is shown below.
| Actual \ Predicted | Good | Defective |
|---|---|---|
| Good | 7,545 | 455 |
| Defective | 622 | 1,378 |
The model enables the sand casting foundry to simulate the effect of adjusting process parameters on quality. For example, by varying pouring temperature while keeping other parameters fixed, we can plot the predicted defect probability curve, as shown in the figure (conceptually). This provides actionable insights for process optimization.
Result Visualization
The final analysis results from data mining are presented through data tables and statistical charts. These visualizations help decision-makers quickly grasp the underlying patterns. Common visualizations used in the sand casting foundry include:
- Quality statistics data table: summarizing defect counts by type, shift, machine, or product line.
- Scatter plot of daily casting output: revealing production variability and potential bottlenecks.
- Bar chart of defect distribution: showing the frequency of different defect categories (shrinkage, blowhole, sand inclusion, crack, etc.).
- Pie chart of monthly casting output: illustrating the proportion of each product line or part number in total production.
For instance, the quality statistics data table might appear as:
| Defect Type | January | February | March | Total |
|---|---|---|---|---|
| Shrinkage | 42 | 38 | 51 | 131 |
| Blowhole | 29 | 33 | 27 | 89 |
| Sand Inclusion | 18 | 22 | 19 | 59 |
| Crack | 11 | 9 | 14 | 34 |
| Total Defects | 100 | 102 | 111 | 313 |
The scatter plot of daily output may reveal a downward trend on certain days due to maintenance or operator changes, prompting further investigation. The bar chart of defect distribution helps the sand casting foundry prioritize improvement actions—focusing on the most frequent defect type. The pie chart of monthly output by product line highlights which parts consume the most production capacity.
Moreover, by linking the quality records with process parameters through the mining model, we can perform root cause analysis. For example, if shrinkage defects are predominantly associated with a specific pouring temperature range and mold hardness combination, the system can display a heatmap of defect rate vs. these two parameters. This allows engineers to define optimal operating windows.
The neural network prediction results are also integrated into the visualization dashboard. The user can input a set of candidate process parameters and instantly see the predicted defect probability. This capability transforms the historical data into a forward-looking quality control tool. The following hypothetical prediction output illustrates the format:
| Parameter Set ID | Pouring Temp (°C) | Sand Moisture (%) | Cycle Time (s) | Core Setting (min) | Predicted Defect Probability | Confidence Interval |
|---|---|---|---|---|---|---|
| 1 | 1430 | 3.2 | 13 | 9 | 0.12 | [0.09, 0.15] |
| 2 | 1450 | 3.5 | 14 | 10 | 0.34 | [0.28, 0.40] |
| 3 | 1410 | 2.9 | 12 | 8 | 0.07 | [0.05, 0.10] |
These visualizations empower the quality team and production managers to make data-driven decisions, reducing reliance on trial-and-error methods.
Conclusion and Outlook
This work addressed the common problem in sand casting foundry operations: after implementing information management systems like ERP, the collected data is often underutilized, leading to a state of “data explosion but knowledge poverty.” We proposed a data mining model based on the Huazhu ERP system that leverages the relational database structure of SQL Server. The model uses the casting ID as the central hub to connect order, production, quality, and shipping tables, enabling systematic association analysis. With this model, we performed statistical analysis to extract deeper insights about customer behavior, defect distribution, production capacity, and other aspects. Results are presented through data tables, scatter plots, bar charts, pie charts, and other visual formats. Furthermore, we built a neural network model that maps process parameters to quality outcomes, allowing the sand casting foundry to predict the effect of parameter changes on product quality. This predictive capability supports proactive quality control and helps reduce scrap rates.
In the future, we plan to extend the mining model to incorporate real-time streaming data and implement online quality prediction. We also aim to integrate reinforcement learning algorithms to automatically suggest optimal process parameters. Additionally, we will explore graph-based mining to capture more complex dependencies among multiple process steps. The ultimate goal is to transform the sand casting foundry into a fully data-driven smart foundry where quality is continuously monitored, predicted, and optimized. The methodology presented here is generalizable to other similar casting enterprises that have adopted ERP systems, providing a blueprint for unlocking the value hidden in their production data.
Acknowledgments: This work was supported by the National Key Research and Development Program of China (Grant No. 2020YFB1710100). The authors thank the colleagues at the partner foundry for their collaboration and data provision.