
In the manufacturing of railway freight vehicles, the coupler body is a critical component that ensures safe connection and operation. As a casting engineer specializing in sand castings, I have extensive experience in designing and optimizing processes for complex steel castings. This article details my first-person perspective on analyzing and verifying the sand casting process for a Grade E steel coupler body used in railway vehicles. The focus is on utilizing numerical simulation to predict defects and implementing practical improvements to achieve high-quality sand castings.
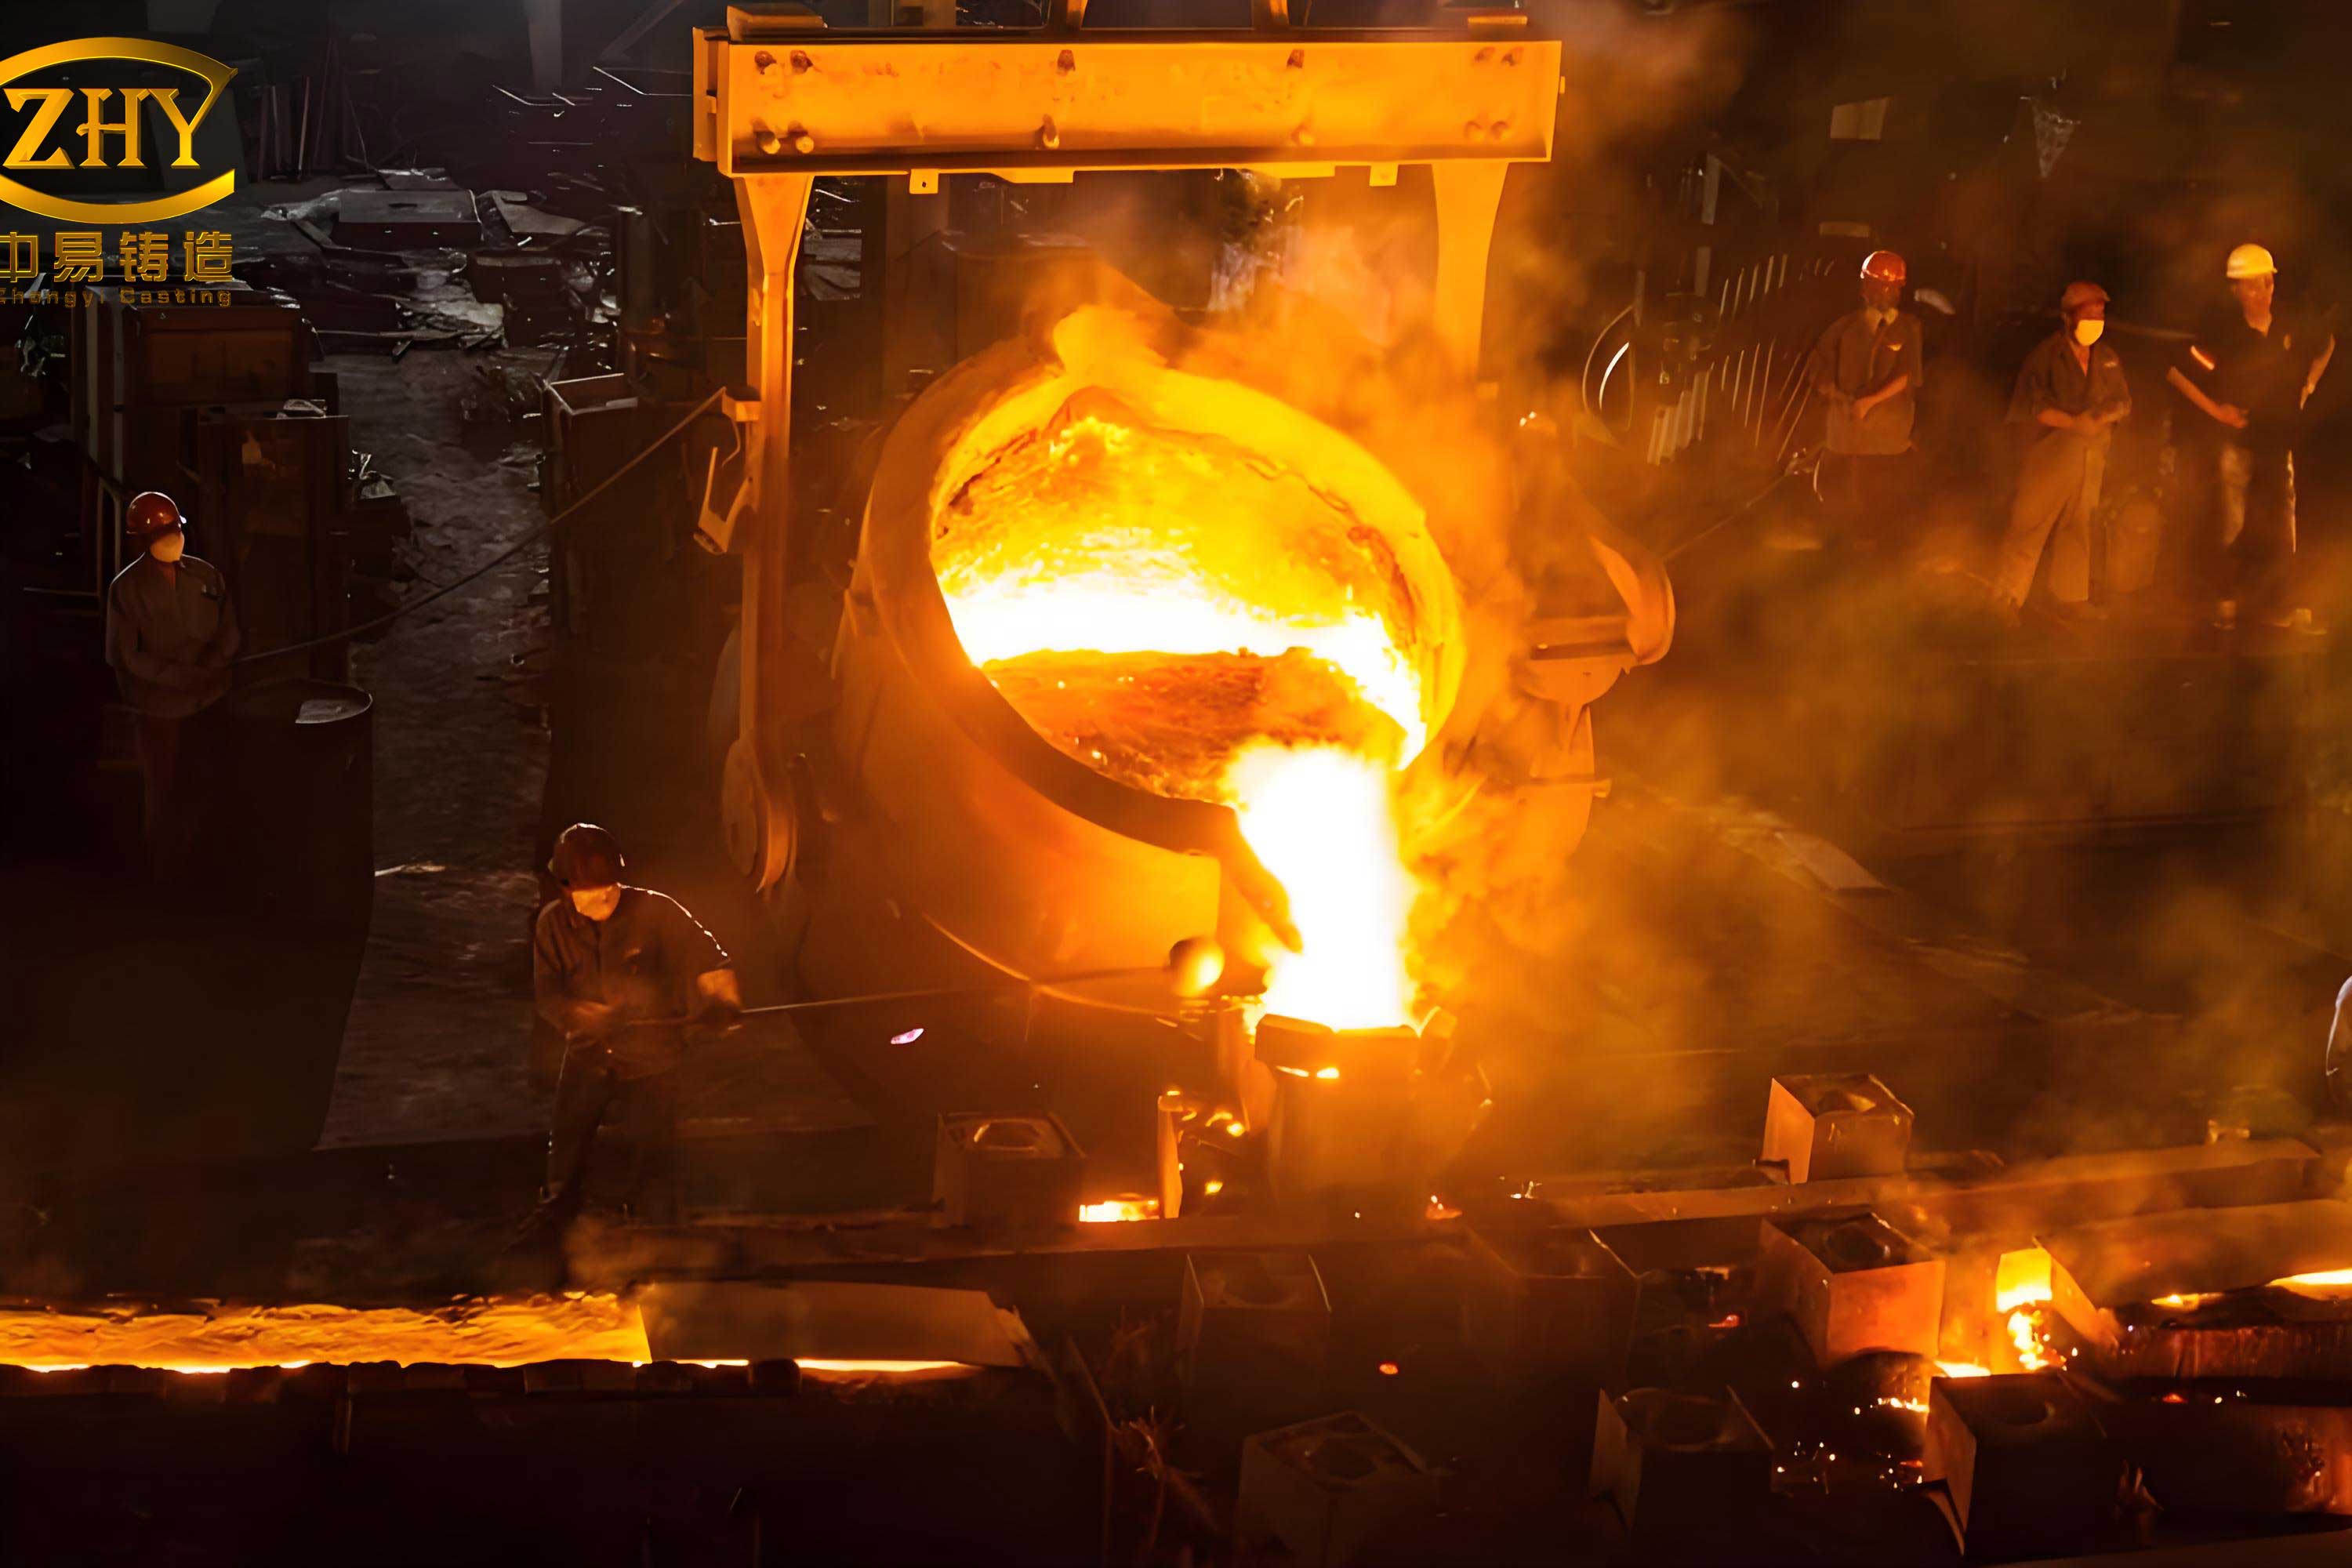
Sand castings are widely employed in heavy industries due to their versatility and cost-effectiveness. However, producing defect-free sand castings for intricate parts like coupler bodies is challenging. The coupler body has a complex box-like structure with varying wall thicknesses ranging from 10 mm to 80 mm, leading to thermal hotspots that can cause shrinkage porosity and cavities. These defects compromise the compactness and mechanical strength, posing safety risks. Therefore, it is essential to rigorously control the casting process. In this study, I applied AnyCasting software to simulate the filling and solidification processes, analyzed potential defects, and validated the results through physical dissection. Based on the findings, I optimized the process to produce qualified sand castings.
The initial sand casting process involved a two-cavity mold arrangement, where two coupler bodies were cast in a single flask. The gating system was designed to introduce molten steel into the hook body section. To minimize post-casting cutting and grinding, the ingate had an upward tilt with an end height of 25 mm. This configuration, while simplifying finishing operations, could lead to turbulent flow during filling. For validation, I produced two castings under these conditions to compare with simulation results. The original layout is described in Table 1, summarizing key parameters.
| Parameter | Value | Description |
|---|---|---|
| Casting Type | Sand Casting | Green sand mold process |
| Material | Grade E Steel (simulated as SM25C) | Carbon content approximately 0.25% |
| Pouring Temperature | 1580 °C | Initial temperature of molten steel |
| Mold Temperature | 25 °C | Ambient temperature of sand mold |
| Ingate Radius | 30 mm | Cross-sectional radius of ingate |
| Pouring Speed | 75 cm/s | Calculated based on 30-second filling time |
| Heat Transfer Coefficient | 0.001 cal/(cm²·s·°C) for air-mold, 0.1 cal/(cm²·s·°C) for casting-mold | Defined for simulation accuracy |
Numerical simulation was conducted using AnyCasting software. I divided the model into seven variable mesh regions to enhance computational efficiency, as shown in Table 2. The mesh counts were allocated to different sections of the coupler and gating system. Since Grade E steel was not directly available in the material library, I selected SM25C with similar carbon content. Key modules like gravity, shrinkage, surface tension, turbulence, and oxide/slag formation were activated. The simulation ended when the solidification fraction reached 100%.
| Region | Mesh Count | Description |
|---|---|---|
| Left Edge | 10 | Peripheral area of mold |
| Left Hook Head | 90 | Front section of coupler |
| Left Hook Body | 55 | Middle section of coupler |
| Gating System and Hook Tail | 70 | Includes sprue, runner, and tail section |
| Right Hook Body | 55 | Symmetrical middle section |
| Right Hook Head | 90 | Symmetrical front section |
| Right Edge | 10 | Peripheral area of mold |
The filling analysis revealed that molten steel first entered the hook body and then spread toward the head and tail. Due to the upward-tilted ingate, the flow encountered resistance, causing turbulence and impinging on the core sand. This could lead to sand inclusion defects, as the turbulent flow erodes the core. The filling sequence indicated that the gating design needed modification to promote laminar flow. In sand castings, controlling flow dynamics is crucial to avoid defects like sand wash and gas entrapment.
Solidification simulation predicted shrinkage defects in thermal hotspots. The “Residual Melt Modulus” function was used to visualize porosity layer by layer. Isolated liquid zones formed in areas like the hook head, hook body, and tail, leading to shrinkage cavities. The defect locations are summarized in Table 3, with corresponding cross-sections. The solidification time can be estimated using Chvorinov’s rule, a fundamental formula in casting:
$$ t = B \left( \frac{V}{A} \right)^n $$
where \( t \) is the solidification time, \( V \) is the volume of the casting section, \( A \) is the surface area, \( B \) is a mold constant, and \( n \) is an exponent typically around 2. For sand castings, this rule helps identify regions with longer solidification times that are prone to shrinkage. In this case, sections with high \( V/A \) ratios, such as thick walls, showed defects.
| Cross-Section | Location in Coupler | Defect Severity (Scale 1-6) | Description |
|---|---|---|---|
| Section 1 | Hook Head Upper Area | 5 | Severe shrinkage porosity |
| Section 2 | Hook Head Lower Area | 5 | Severe shrinkage cavity |
| Section 3 | Hook Body Front | 6 | Critical shrinkage defect |
| Section 4 | Hook Body Rear | 3 | Moderate porosity |
| Section 5 | Tail Upper Area | 3 | Moderate shrinkage |
| Section 6 | Tail Lower Area | 3 | Moderate porosity |
| Section 7 | Edge Region | 2 | Minor defects |
| Section 8 | Central Core Area | 6 | Critical shrinkage cavity |
To verify the simulation accuracy, I dissected two sand castings produced under the initial process. The physical sections matched the predicted defect locations closely, confirming the reliability of AnyCasting for sand castings. The compactness was evaluated on a scale from 1 to 6, where 1 indicates no defects and 6 indicates severe shrinkage. Table 4 compares the simulation predictions with actual observations, showing good correlation.
| Cross-Section | Simulated Defect Level | Actual Defect Level | Deviation |
|---|---|---|---|
| Section 1 | 5 | 5 | 0 |
| Section 2 | 5 | 5 | 0 |
| Section 3 | 6 | 6 | 0 |
| Section 4 | 3 | 3 | 0 |
| Section 5 | 3 | 3 | 0 |
| Section 6 | 3 | 3 | 0 |
| Section 7 | 2 | 2 | 0 |
| Section 8 | 6 | 6 | 0 |
Based on the analysis, I implemented several improvements to the sand casting process. First, I modified the gating system to allow downward sloping flow, reducing turbulence. Second, I added exothermic insulating sleeves to the original vent pins and upper hook lugs to enhance feeding. Third, I placed external chills on the mold at Sections 2, 3, and 6, and internal chills in Sections 2 and 3 to accelerate cooling. Fourth, I replaced the open riser at the tail with a blind riser using exothermic material for better shrinkage compensation. Fifth, I set a blind riser between the upper and lower pull tabs in Section 3’s inner cavity. Sixth, I added external chills on the core in Section 4. These changes aimed to improve temperature distribution and solidification patterns in sand castings.
The feeding distance in sand castings can be estimated using empirical formulas. For steel castings, the effective feeding distance \( L \) is given by:
$$ L = k \sqrt{T} $$
where \( k \) is a constant dependent on mold material and casting geometry, and \( T \) is the section thickness. By adding risers and chills, I increased \( k \) and reduced \( T \) in critical areas, thereby extending the feeding range. The thermal modulus \( M \), defined as \( M = V/A \), was calculated for each section to optimize chill placement. For example, in Section 3, the modulus was high, indicating slow solidification, so chills were used to reduce \( M \) and prevent shrinkage.
After implementing the improvements, I produced new sand castings and dissected them for evaluation. The compactness levels improved significantly, as shown in Table 5. All sections met the technical standards, with defect levels reduced to 1 or 2. This demonstrates the effectiveness of process optimization in sand castings.
| Cross-Section | Defect Level (Scale 1-6) | Assessment |
|---|---|---|
| Hook Head A-A | 1 | No defects |
| Hook Head B-B | 1 | No defects |
| Hook Head C-C | 2 | Minor porosity |
| Hook Head D-D | 2 | Minor porosity |
| Hook Head E-E | 1 | No defects |
| Hook Head F-F | 1 | No defects |
| Hook Head G-G | 2 | Minor porosity |
| Hook Tail A-A | 1 | No defects |
| Hook Tail B-B | 1 | No defects |
| Hook Tail C-C | 2 | Minor porosity |
| Hook Tail D-D | 1 | No defects |
The success of this project highlights the importance of numerical simulation in sand castings. By using AnyCasting, I could visualize filling and solidification, predict defects, and optimize the process before actual production. This reduces trial-and-error, saves costs, and ensures high-quality sand castings. The integration of simulation with physical validation is a robust approach for complex castings like railway coupler bodies.
In conclusion, as a casting engineer, I have shown that through detailed analysis and verification, sand castings can be produced with excellent compactness and mechanical properties. The key lies in understanding thermal behavior, applying appropriate feeding mechanisms, and continuously refining the process. For future work, I plan to explore advanced simulation features and incorporate real-time monitoring to further enhance sand casting quality. The journey of optimizing sand castings is ongoing, but with tools like numerical simulation, we can achieve remarkable results in manufacturing critical components for the railway industry.
Throughout this article, I have emphasized the role of sand castings in industrial applications. The process involves intricate balance of material properties, mold design, and thermal management. By sharing my experience, I hope to contribute to the advancement of sand casting technology, ensuring that sand castings remain a reliable and efficient method for producing high-integrity parts. The use of formulas and tables, as demonstrated, provides a systematic framework for analysis, making sand castings more predictable and controllable.