
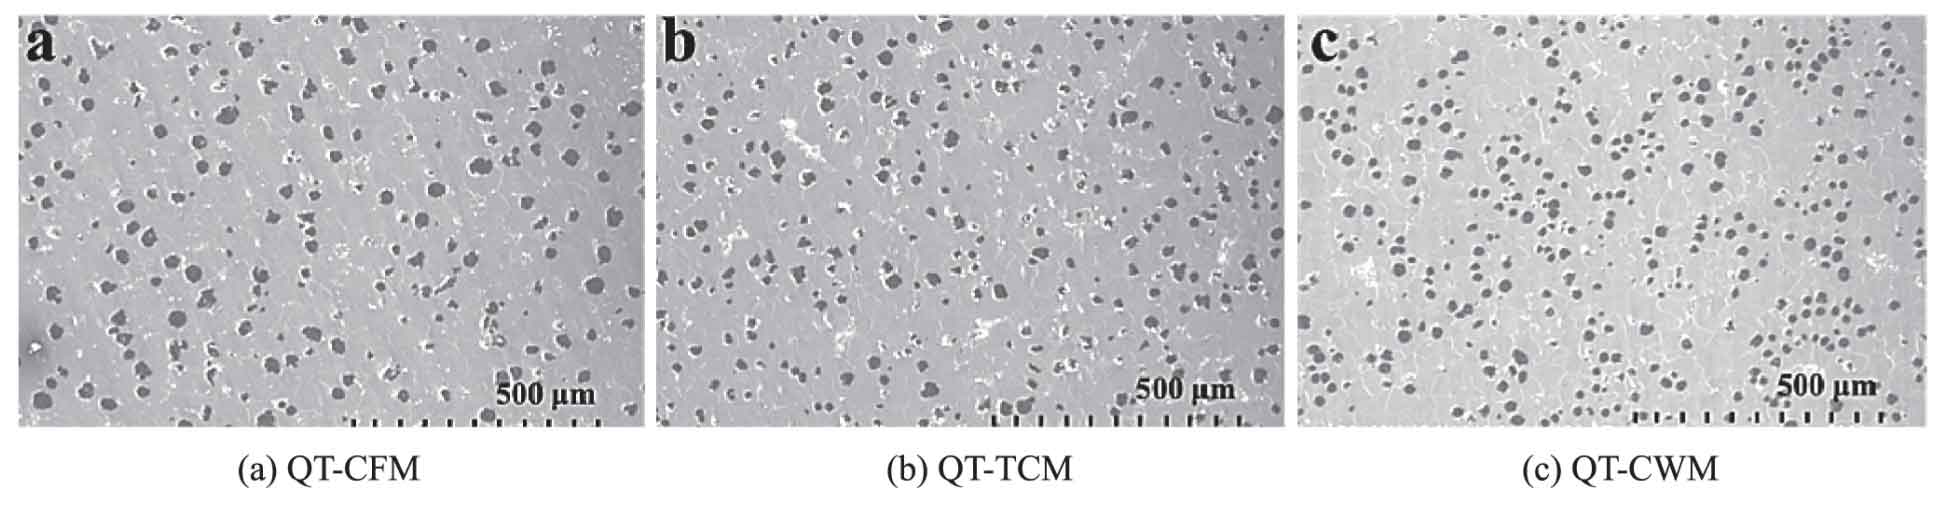
Fig. 1 shows the microstructure SEM of three groups of ductile iron samples. It can be seen from the figure that the microstructure of three groups of ductile iron samples after high temperature annealing heat treatment is ferrite (f) + spherical graphite (g) and a few poorly spheroidized graphite. The morphology and size of ferrite in three groups of nodular cast iron samples have little difference, and the graphite structure has great difference. The graphite diameter of qt-cfm is the largest and the spherical regularity of graphite is the worst; The graphite diameter of qt-tcm decreased and the spherical regularity of graphite increased; The graphite diameter of qt-cwm is the smallest and the spherical regularity of graphite is the best.
In order to further explain the difference of graphite structure, the number, size and spherical regularity of graphite under the visual field of SEM pictures of three groups of nodular cast iron samples (Fig. 2) are counted. The number and spheroidization rate of graphite under the visual field of the same magnification of three groups of nodular cast iron samples (evaluated according to GB / t9441-2009) are shown in Fig. 2.
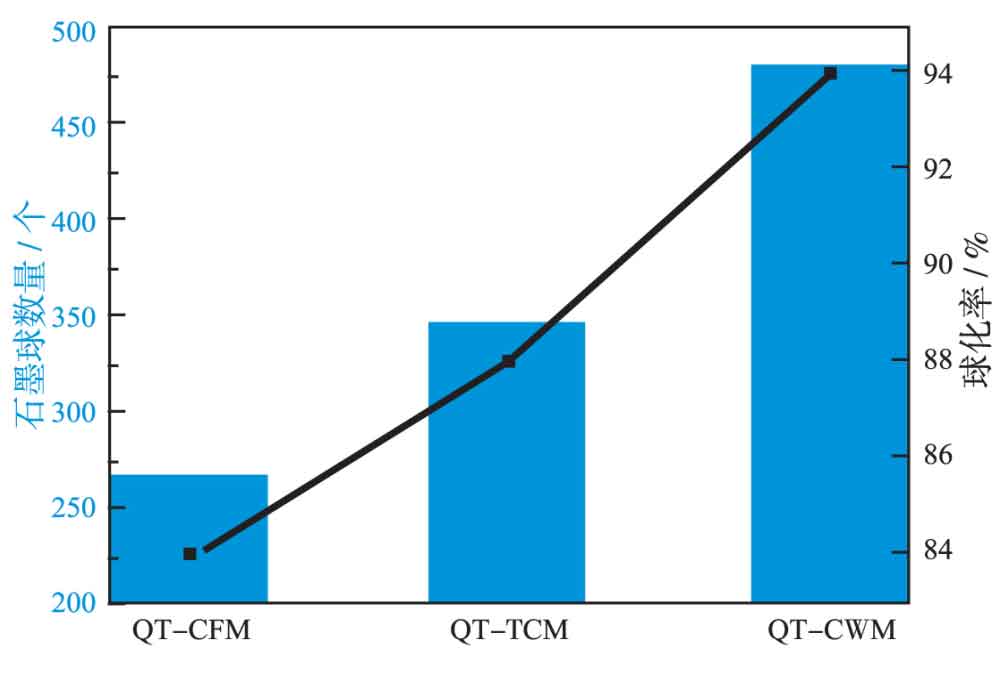
It can be seen from the figure that the graphite quantity of the three groups of nodular cast iron samples varies greatly. The graphite quantity of qt-cfm is at least 268, and the graphite spheroidization rate is grade 3; The number of graphite in qt-tcm has increased to 347, and the graphite spheroidization rate is still grade 3, but close to grade 2; The maximum number of qt-cwm graphite is 480, and the highest graphite spheroidization rate is grade 2.
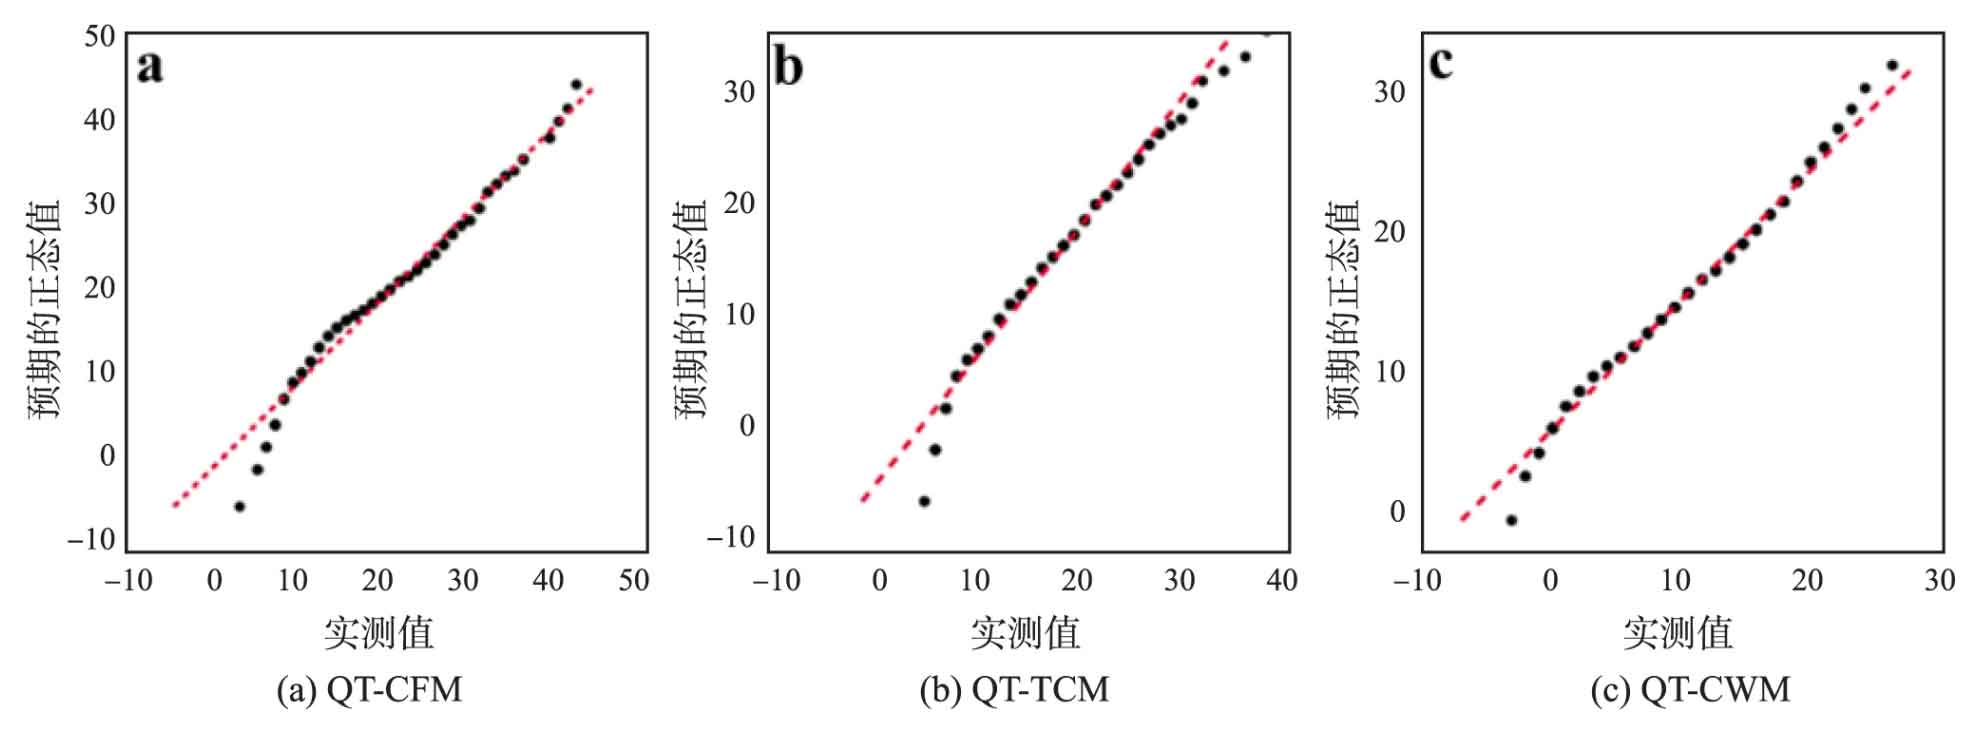
Each graphite diameter of three groups of nodular cast iron samples is measured and counted, and the distribution characteristics of graphite ball diameter of three groups of nodular cast iron samples are detected by normal Q-Q diagram. The results are shown in Figure 3. It can be seen from the normal Q-Q diagram of the three groups of nodular cast iron samples that the middle part of the measured discrete points is basically divided around the predicted virtual line, with the largest number, and there is a slight deviation at both ends, but the number is small, indicating that the distribution law of graphite diameter of the three groups of nodular cast iron samples is near normal distribution, that is, the total volume distribution presents the middle range (average diameter) with high frequency, The number of spherical graphite with larger or smaller diameter is less, which is in line with the growth law of graphite ball nucleation and growth.
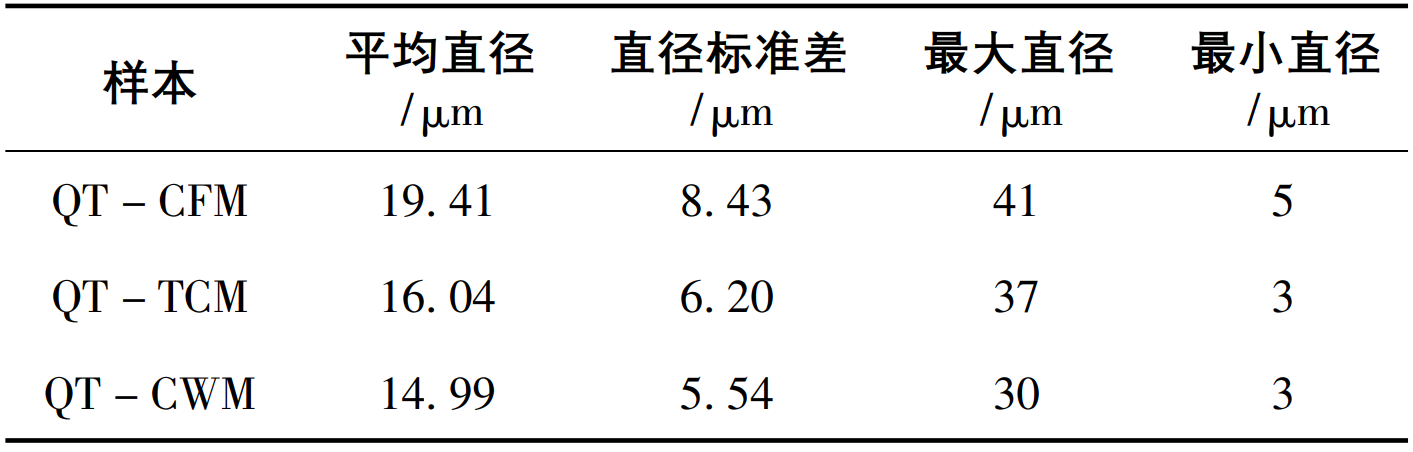
As shown in the table, the statistical parameters of near normal distribution of graphite diameter of three groups of nodular cast iron samples are shown. It can be seen from the table that during qt-cfm spheroidization, the reason for uneven distribution of spheroidizing agent and poor absorption rate is that the maximum average diameter of graphite ball is 19.5 mm forty-one μ m. The maximum graphite diameter is 41 μ m. The standard deviation is 8 forty-three μ m. The maximum dispersion of the overall diameter of graphite. In qt-cwm spheroidizing process, the spheroidizing agent is evenly distributed and the absorption rate is high. The minimum average diameter of graphite ball is 14.5 ninety-nine μ m. Maximum graphite diameter 30 μ m. The standard deviation is 5 fifty-four μ m. The dispersion of the overall graphite diameter is the smallest. The graphite parameters of qt-tcm are between qt-cfm and qt-cwm.