
In my research, I have focused on the severe air pollution challenges faced by sand casting foundries. The metal casting industry is foundational to automotive and machinery manufacturing, and among various casting methods, sand casting is the most widely used, producing 70–80% of all castings globally. However, the environmental burden is substantial: in 2006 alone, Chinese foundries emitted approximately 300–600 billion cubic meters of exhaust gas, with the vast majority originating from sand casting foundries. These emissions contain not only greenhouse gases like CO and CO₂, but also a plethora of volatile organic compounds (VOCs) and hazardous air pollutants (HAPs). The U.S. Environmental Protection Agency lists 188 HAPs, and more than 40 have been detected in sand casting foundry emissions, including formaldehyde, benzene, and phenol.
The root cause of these pollutants lies in the thermal decomposition of raw materials used in mold and core making—such as coal powder and organic binders—when molten metal is poured into the sand mold. Under high temperature and oxygen‑limited conditions, these materials pyrolyze, generating VOCs predominantly composed of benzene, phenol, and their alkyl‑substituted derivatives. Many of these compounds are classified as HAPs due to their toxicity and carcinogenicity.
In response, industrial nations have been developing new sand additives and core binders to replace conventional materials, aiming to reduce emissions while maintaining casting quality. However, before these novel materials can be widely adopted, their emission characteristics must be thoroughly evaluated. Traditionally, this is done by conducting small‑scale actual casting trials in a pre‑production foundry and analyzing the emitted air pollutants. While informative, this method is labor‑intensive, time‑consuming, expensive, and subject to many interfering factors. To overcome these drawbacks, I have explored an alternative approach: using analytical pyrolysis to simulate the heating conditions that raw materials experience during the sand casting process. The pyrolysis products are then analyzed by gas chromatography with flame ionization detection and mass spectrometry (GC‑FID/MS). This technique offers a fast, accurate, and cost‑effective way to establish emission inventories and compare different raw materials.
In this article, I present the findings from my application of analytical pyrolysis to several raw materials commonly used in sand casting foundries, including bituminous coal powder, a conventional phenolic urethane binder, a novel naphthalene‑depleted phenolic urethane binder, and a protein‑based binder. I compare the analytical pyrolysis results with actual casting data from pre‑production foundry tests, demonstrating the remarkable similarity in both the composition and the relative trends of air pollutant emissions. This work provides a scientific basis for foundries to select cleaner raw materials and for researchers to develop improved formulations.
Methodology
All raw materials tested were supplied by a cooperating sand casting foundry. The bituminous coal powder was used as received. The three core binders (conventional phenolic urethane, naphthalene‑depleted phenolic urethane, and protein‑based) were first mixed with silica sand in the proportions used for core making, then formed into cores, crushed, and ground into particles suitable for analytical pyrolysis.
I employed a Japan Analytical Industry JHP‑22 Curie‑point pyrolyzer, which heats the sample wrapped in a ferromagnetic foil from room temperature to 920 °C in 0.1–0.2 s and maintains this temperature for 3 s. This rapid heating mimics the intense thermal shock experienced by sand mold materials when molten metal is poured. The pyrolysis vapors were directly swept into a Hewlett‑Packard GC 5890 equipped with a capillary column. The effluent was split to a mass spectrometer (MS) for identification and a flame ionization detector (FID) for quantification. The FID response was calibrated using standard compounds to allow precise mass quantification of individual HAPs.
Results and Discussion
2.1 Similarity of Emission Compositions
The GC‑FID chromatograms from the analytical pyrolysis of the four raw materials are shown conceptually (the actual chromatogram is not shown here). The major components in the C₆–C₁₆ region—typically used by the U.S. foundry industry as a proxy for VOC emissions—were predominantly HAPs. The key HAPs identified included benzene, toluene, ethylbenzene, xylenes, aniline, phenol, cresols, naphthalene, methylnaphthalenes, and dimethylnaphthalenes. Table 1 lists the emission factors (g per tonne of casting) for these 11 HAPs as measured in actual casting trials at a pre‑production foundry (data from Technikon Environmental Development Center reports). The same set of compounds was also detected in my analytical pyrolysis experiments, albeit with different absolute levels because the pyrolysis environment is more controlled and does not suffer from losses due to condensation or adsorption onto particulate matter.
| Compound | Coal Powder (Actual) | Conventional Phenolic A (Actual) | Protein‑Based Binder (Actual) | Conventional Phenolic B (Actual) | Naphthalene‑Depleted Phenolic (Actual) |
|---|---|---|---|---|---|
| Benzene | 25.95 | 47.13 | 8.48 | 64.27 | 82.69 |
| Toluene | 17.01 | 10.39 | 6.26 | 17.69 | 22.36 |
| Ethylbenzene | 1.68 | 0.36 | 0.41 | 1.35 | 1.59 |
| Xylenes | 10.25 | 3.95 | 0.95 | 9.53 | 11.30 |
| Aniline | — | 29.26 | — | 12.38 | 12.97 |
| Phenol | 2.72 | 53.07 | 0.59 | 44.00 | 55.07 |
| Cresols | — | 18.46 | — | 10.12 | 13.47 |
| Naphthalene | 3.13 | 12.70 | 0.59 | 6.44 | 6.08 |
| 2‑Methylnaphthalene | 2.31 | 20.09 | — | 5.62 | 2.59 |
| 1‑Methylnaphthalene | 1.32 | 10.43 | — | 3.22 | 1.63 |
| Dimethylnaphthalenes | — | 13.61 | — | 1.34 | 0.64 |
| Sum of these 11 HAPs (A) | 64.36 | 219.45 | 17.28 | 175.96 | 210.38 |
| Total HAPs (B) | 71.30 | 238.54 | 21.05 | 179.94 | 214.50 |
| A / B (%) | 90.27 | 91.99 | 82.11 | 97.79 | 98.08 |
The sum of these 11 compounds accounted for over 90% of all HAPs detected in actual casting for all materials except the protein‑based binder, for which the proportion was 82% because the binder generates more low‑molecular-weight HAPs such as acetaldehyde and butanone that were not included in the table. In my analytical pyrolysis experiments, I detected all these 11 compounds plus additional low‑molecular-weight HAPs, confirming that the analytical method provides a more comprehensive emission inventory.
To further illustrate the similarity, I compared the mass fractions of individual HAP groups (benzene, toluene, ethylbenzene + xylenes, aniline, phenol + cresols, and polycyclic organic matter (POM) including naphthalene and methylnaphthalenes) from both analytical pyrolysis and actual casting. For the conventional phenolic binder (Phenolic A), the distribution was very close: benzene accounted for about 20%, phenol/cresols ~30%, and POM ~30% in both cases. The slight difference in POM (lower in actual casting) was due to the condensation of high‑boiling POM on dust particles, which is not collected as a gaseous pollutant in actual foundry tests. In contrast, analytical pyrolysis transfers all pyrolysis products directly to the GC without loss. For the naphthalene‑depleted binder, the POM fraction was much smaller (only ~5%), and the similarity between analytical pyrolysis and actual casting was even better, as condensation effects became negligible. For the protein‑based binder, analytical pyrolysis detected several HAPs (e.g., aniline, cresols, naphthalene) that were below the detection limit in actual casting because of the high dilution factor (∼1000 ×) inherent in the sampling and solvent‑extraction method. Therefore, analytical pyrolysis yields a more accurate and complete emission profile, especially for low‑emission formulations.
2.2 Predicting Relative Emission Trends
While absolute emission factors from analytical pyrolysis cannot be directly used to estimate actual foundry emissions (because of differences in mold geometry, pouring temperature, ventilation, etc.), the relative changes between different raw materials are highly informative. I conducted two comparison sets: (1) conventional phenolic binder vs. naphthalene‑depleted phenolic binder, and (2) conventional phenolic binder vs. protein‑based binder. For each set, I calculated the relative change in emissions for each major HAP using the formula:
$$ \text{Relative Change} (\%) = \frac{E_{\text{new}} – E_{\text{ref}}}{E_{\text{ref}}} \times 100 $$
where \(E_{\text{ref}}\) is the emission factor of the reference material (conventional phenolic) and \(E_{\text{new}}\) is that of the alternative binder. Table 2 presents the comparison between analytical pyrolysis results and actual casting data for the two sets.
| Compound | Naphthalene‑Depleted vs. Conventional | Protein‑Based vs. Conventional | ||
|---|---|---|---|---|
| Analytical Pyrolysis | Actual Casting | Analytical Pyrolysis | Actual Casting | |
| Benzene | +28.5 | +28.6 | −82.0 | −82.0 |
| Toluene | +26.4 | +26.4 | −39.8 | −39.8 |
| Ethylbenzene | +17.8 | +17.8 | +13.9 | +13.9 |
| Xylenes | +18.6 | +18.6 | −75.9 | −75.9 |
| Aniline | +4.8 | +4.8 | −100 | −100 |
| Phenol | +25.2 | +25.2 | −98.9 | −98.9 |
| Cresols | +33.1 | +33.1 | −100 | −100 |
| Naphthalene | −5.6 | −5.6 | −95.4 | −95.4 |
| 2‑Methylnaphthalene | −87.1 | −87.1 | −100 | −100 |
| 1‑Methylnaphthalene | −84.4 | −84.4 | −100 | −100 |
| Dimethylnaphthalenes | −95.3 | −95.3 | −100 | −100 |
The data in Table 2 reveal a remarkable agreement between analytical pyrolysis and actual casting for all compounds in both sets. The relative changes are nearly identical, with deviations of less than 1% for most compounds. This demonstrates that analytical pyrolysis can accurately predict the emission trends of sand casting foundry raw materials without the need for expensive and time‑consuming pre‑production casting trials.
For the naphthalene‑depleted binder, the key benefit is the substantial reduction of polycyclic aromatic hydrocarbons (PAHs): naphthalene decreased by 5.6%, methylnaphthalenes by over 84%, and dimethylnaphthalenes by 95.3%. Overall, PAH emissions were reduced by more than 50% compared to the conventional binder. For the protein‑based binder, the reduction was even more dramatic: total HAP emissions dropped by over 90%, with many compounds such as aniline, cresols, and methylnaphthalenes completely eliminated (i.e., below detection limits). These results align perfectly with the actual casting data reported in the literature.
2.3 Quantitative Relationship Between Pyrolysis and Casting Emissions
Although the relative trends are consistent, the absolute emission factors from analytical pyrolysis differ from those of actual casting because of the different sampling and analysis conditions. However, I can establish a linear correlation between the two sets for each raw material. For example, for the conventional phenolic binder, the relationship between the pyrolysis yield (in μg per mg of sample) and the actual casting emission factor (g t⁻¹) can be expressed as:
$$ E_{\text{actual}} = k \cdot P_{\text{pyrolysis}} $$
where \(k\) is a proportionality constant that depends on factors such as the binder loading in the sand, the casting temperature, and the collection efficiency. In practice, we can determine \(k\) for a reference material and then use the same \(k\) to estimate the absolute emissions of a new material, provided the casting conditions remain similar. This approach allows foundries to screen candidate raw materials quickly in the laboratory before committing to full‑scale trials.
2.4 Practical Implications for Sand Casting Foundries
The adoption of analytical pyrolysis in sand casting foundries offers several benefits:
- Rapid screening: Dozens of binder formulations can be tested in one day, whereas a single pre‑production trial may take weeks.
- Cost reduction: Eliminates the need for large amounts of molten metal, cores, and emission sampling equipment.
- Improved accuracy: Avoids losses of semi‑volatile compounds that condense on dust or are lost during solvent extraction.
- Early identification: Identifies problematic HAPs at the development stage, guiding binder chemists toward cleaner formulations.
Based on my results, I strongly recommend that sand casting foundries adopt analytical pyrolysis as a standard tool for evaluating raw material emissions. For example, a foundry considering switching from a conventional phenolic urethane binder to a naphthalene‑depleted version can obtain, within a day, a complete emission inventory and confirm the expected PAH reduction of over 50%. Similarly, a protein‑based binder can be shown to cut total HAPs by more than 90%, making it an excellent candidate for environmentally conscious operations.
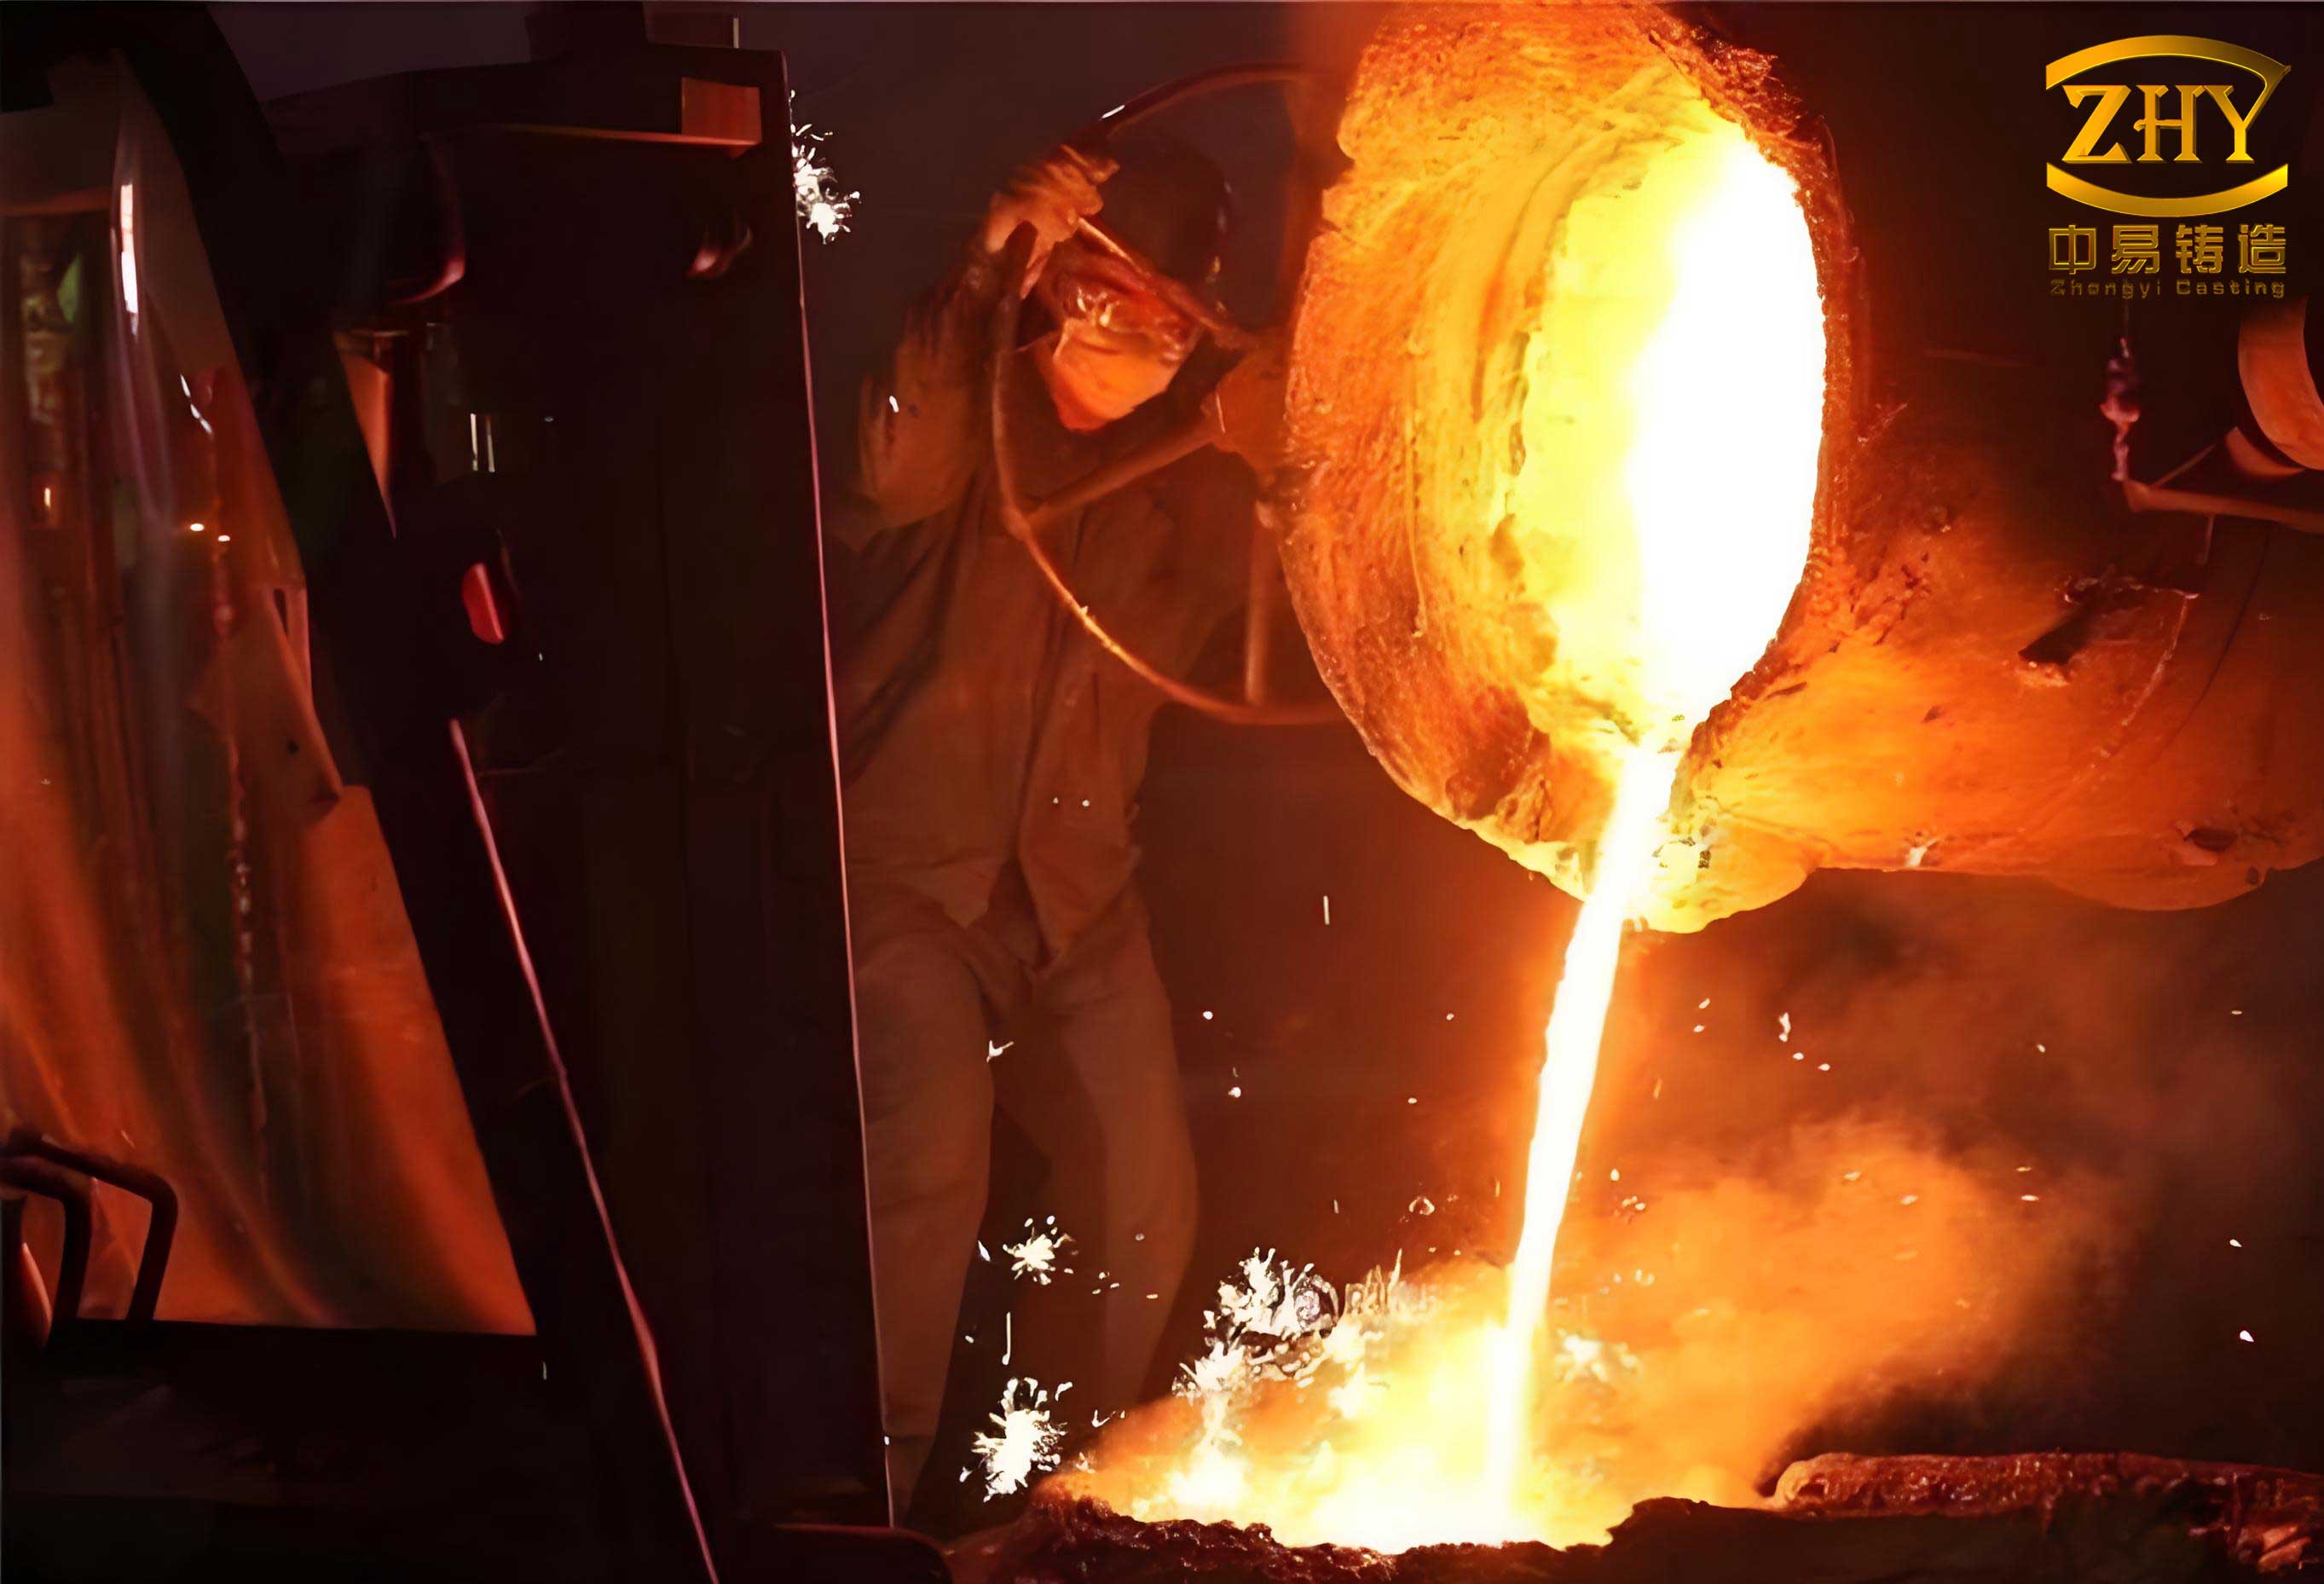
Figure 1 illustrates a typical sand casting setup where the mold is prepared with sand and binders. The image reminds us of the real‑world application of our analytical work: every sand casting foundry can benefit from cleaner raw materials identified through laboratory pyrolysis studies.
Conclusion
My investigation has conclusively demonstrated that analytical pyrolysis is a powerful and reliable technique for characterizing the air pollutant emissions of raw materials used in sand casting foundries. The pyrolysis products are strikingly similar in composition and relative distribution to those generated during actual metal casting. The technique can accurately predict the relative emission changes when switching to alternative binders, as confirmed by side‑by‑side comparisons with pre‑production foundry tests. In particular, the naphthalene‑depleted phenolic binder reduces PAH emissions by over 50%, and the protein‑based binder reduces total HAP emissions by over 90% compared to conventional phenolic urethane binders.
By integrating analytical pyrolysis into the development and selection process, sand casting foundries can accelerate the adoption of cleaner materials, reduce their environmental footprint, and comply with increasingly stringent air quality regulations. This approach offers a win‑win scenario: lower emissions without compromising casting quality or productivity. I believe that analytical pyrolysis will become an indispensable tool in the quest for sustainable sand casting foundries.