
1. Introduction
Sand casting, as one of the oldest metal-forming techniques, faces unprecedented challenges in the era of customized production and environmental regulations. The integration of 3D printing technology offers transformative solutions to these challenges by enabling mold-free manufacturing, reducing lead times, and minimizing material waste. This article explores the mathematical foundations, industrial applications, and economic benefits of adopting 3D printing in sand casting processes.
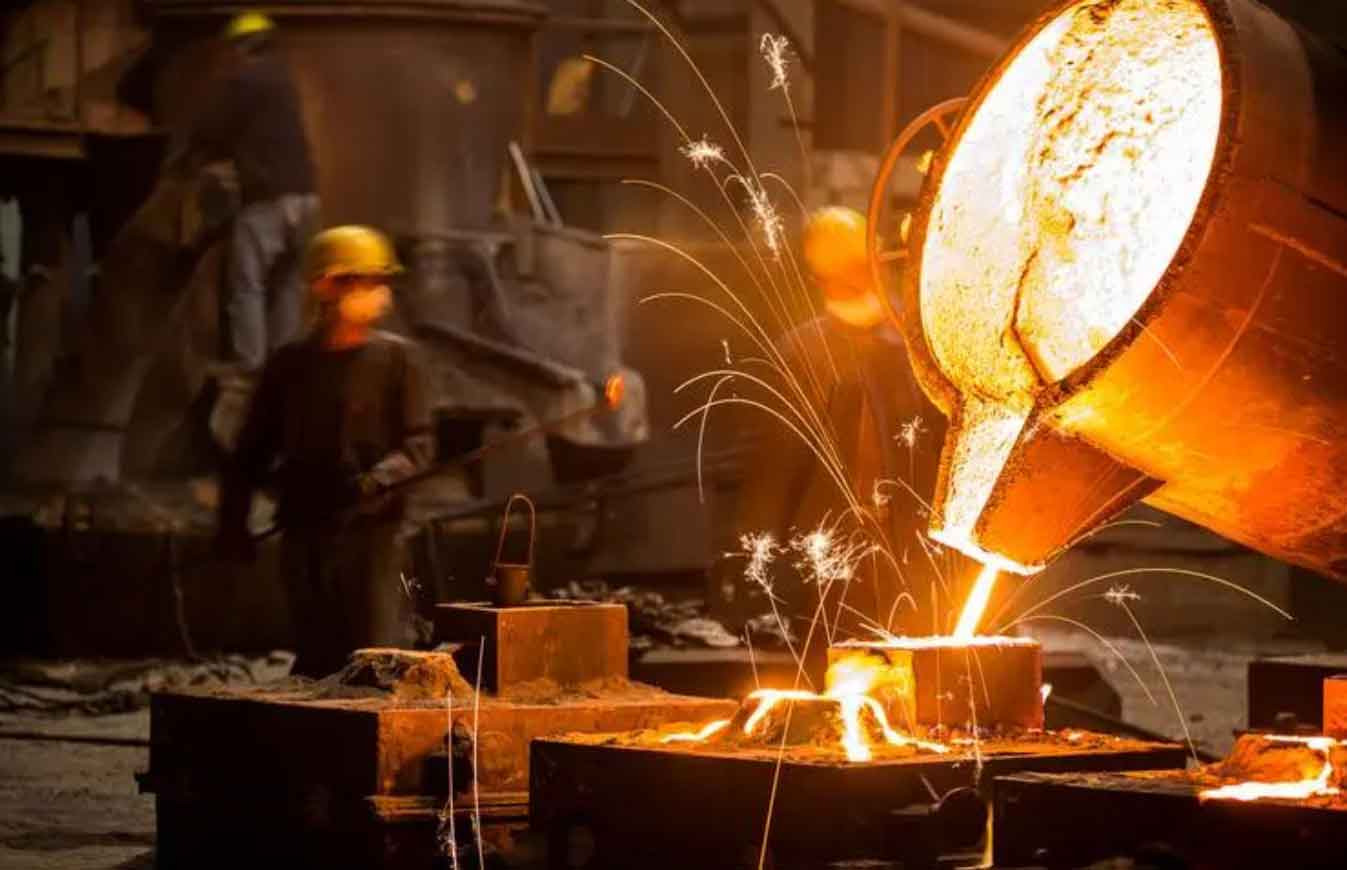
2. Challenges in Traditional Sand Casting
Traditional sand casting methods encounter three critical limitations:
| Challenge | Impact | 3D Printing Advantage |
|---|---|---|
| High mold costs | 20-50% of project budget | Zero tooling investment |
| Long production cycles | 8-12 weeks for complex parts | 48-72 hr direct printing |
| Environmental emissions | 3.2 kg CO2/ton casting | 1.8 kg CO2/ton casting |
3. Technical Advantages of 3D Sand Printing
The fundamental equation governing 3D sand printing efficiency can be expressed as:
$$ T_{total} = T_{design} + T_{printing} + T_{post} $$
Where:
- $T_{design}$ = Digital pattern preparation time (typically 2-4 hrs)
- $T_{printing}$ = Layer-by-layer fabrication time
- $T_{post}$ = Curing and finishing time
For conventional sand casting:
$$ T_{conventional} = T_{pattern} + T_{mold} + T_{curing} + T_{assembly} $$
Comparative studies show 68-72% reduction in total process time through 3D printing.
4. Economic Modeling
The cost-benefit analysis for sand casting applications follows:
$$ C_{3D} = C_{material} + C_{machine} + C_{labor} $$
$$ C_{traditional} = C_{pattern} + C_{mold} + C_{assembly} + C_{scrap} $$
Case studies demonstrate:
| Component | Traditional Cost | 3D Printing Cost | Savings |
|---|---|---|---|
| Engine Block (V6) | $18,500 | $6,200 | 66.5% |
| Steering Gear | $9,800 | $3,400 | 65.3% |
5. Industrial Applications
5.1 Automotive Steering Systems
Implementation of 3D printed sand cores for steering components reduced dimensional tolerances from ±1.2 mm to ±0.25 mm, enhancing fluid dynamics performance:
$$ \Delta P = \frac{128 \mu L Q}{\pi d^4} $$
Where improved surface finish (Ra 12 μm vs 25 μm) directly impacts pressure loss ($\Delta P$) in hydraulic systems.
5.2 High-Performance Engine Components
Complex cooling channel fabrication achieved through 3D sand printing:
$$ Nu = 0.023 Re^{0.8} Pr^{0.4} $$
Enhanced heat transfer coefficients (15-22% improvement) validate the technology’s capability for optimized thermal management.
6. Environmental Impact Analysis
The carbon footprint reduction model for sand casting shows:
$$ \text{CO}_2 \text{ Reduction} = \frac{(E_{traditional} – E_{3D}) \times CF_{energy}}{W_{casting}} $$
Where:
- $E_{traditional}$ = 850 kWh/ton
- $E_{3D}$ = 520 kWh/ton
- $CF_{energy}$ = 0.98 kg CO2/kWh
This yields 32.4% reduction in emissions per ton of castings.
7. Future Development Trends
The industry adoption curve follows logistic growth model:
$$ P(t) = \frac{K}{1 + e^{-r(t-t_0)}} $$
Where:
- $K$ = Market saturation (projected 38% by 2030)
- $r$ = Adoption rate (current 12.7% CAGR)
8. Conclusion
3D printing technology revolutionizes sand casting through:
- 72% shorter prototyping cycles
- 65-68% cost reduction for small batches
- Sub-0.3 mm dimensional accuracy
- 32-35% lower environmental impact
These advancements position additive manufacturing as the cornerstone for next-generation foundry operations, particularly for high-complexity, low-volume sand casting applications.