
As a casting simulation analyst, I have extensively used numerical simulation tools to address challenges in engine manufacturing. The cylinder block is a critical component in automotive engines, and its quality hinges on the precision of the sand casting process. Sand casting defects, particularly gas holes, are common issues that can compromise structural integrity and performance. In this article, I will share my experience using MAGMA software to predict and analyze sand casting defects in cylinder blocks, focusing on gas hole formation under varying pouring times. By leveraging temperature fields, gas pressure distributions, and air entrapment simulations, I aim to provide insights that guide process improvements and reduce defect rates in real-world production.
The advent of computer-aided simulation has revolutionized foundry practices, allowing for virtual prototyping and defect prediction before physical casting. MAGMA, a leading casting simulation software, enables detailed analysis of fluid flow, solidification, and defect formation. In engine cylinder block production, sand casting defects like gas holes often arise from improper gating design, inadequate venting, or suboptimal pouring parameters. Through simulation, I can visualize the entire casting process, identify potential defect zones, and optimize parameters to mitigate sand casting defects. This approach not only saves time and resources but also enhances product quality by preemptively addressing issues that lead to sand casting defects.
In my work, I focus on predicting sand casting defects by modeling the complex interactions between molten metal, sand molds, and cores. The cylinder block, with its intricate geometry and high technical requirements, presents a perfect case study for simulation. By analyzing two different pouring times—22 seconds and 26 seconds—I evaluated their impact on gas hole formation. The goal was to correlate simulation predictions with actual defect occurrences, thereby validating the model and refining process controls. Throughout this article, I will emphasize the role of simulation in understanding and preventing sand casting defects, using equations and tables to summarize key findings.
Simulation Preparation and Model Setup
To begin, I prepared a comprehensive 3D model of the cylinder block assembly, including the casting, gating system, risers, sand cores, and mold. Using Pro/E, I assembled all components and exported them in .stl format with a unified coordinate system. This model was then imported into MAGMA for meshing and simulation. The mesh generation process involved iterative refinement to ensure accuracy, with a minimum cell size below 2.5 mm, resulting in approximately 24 million cells. This fine discretization is crucial for capturing detailed phenomena that contribute to sand casting defects, such as localized temperature gradients and gas entrapment.
The material properties and boundary conditions were defined based on standard foundry practices. The casting material was GJL250 gray iron, while the mold was composed of Green_Sand. Cores were made from Coldbox_chromite, and a ceramic filter (FC-194, 66.6 mm × 66.6 mm × 12.7 mm) was incorporated into the gating system to reduce turbulence. The pouring temperature was set at 1405°C, and heat exchange interfaces—between metal-mold, metal-air, and air-mold—were modeled using MAGMA’s TempIron database. These settings replicate real-world conditions, enabling accurate prediction of sand casting defects like gas holes.
For simulation, I considered two scenarios: a pouring time of 22 seconds and 26 seconds. These variations allowed me to assess how filling speed influences defect formation. The governing equations for fluid flow and heat transfer in MAGMA include the Navier-Stokes equations for incompressible flow and the energy equation for temperature distribution. For gas-related sand casting defects, I focused on the air pressure equation and air entrapment models. The key equations are summarized below:
$$ \nabla \cdot \mathbf{u} = 0 $$
$$ \rho \left( \frac{\partial \mathbf{u}}{\partial t} + \mathbf{u} \cdot \nabla \mathbf{u} \right) = -\nabla p + \mu \nabla^2 \mathbf{u} + \mathbf{f} $$
$$ \rho c_p \left( \frac{\partial T}{\partial t} + \mathbf{u} \cdot \nabla T \right) = \nabla \cdot (k \nabla T) + Q $$
where \( \mathbf{u} \) is velocity, \( p \) is pressure, \( \rho \) is density, \( \mu \) is viscosity, \( T \) is temperature, \( c_p \) is specific heat, \( k \) is thermal conductivity, and \( Q \) is heat source. For gas pressure \( P_g \) in sand casting defects, I used:
$$ P_g = P_{\text{atm}} + \rho_g g h + \Delta P_{\text{flow}} $$
where \( P_{\text{atm}} \) is atmospheric pressure, \( \rho_g \) is gas density, \( g \) is gravity, \( h \) is height, and \( \Delta P_{\text{flow}} \) is pressure change due to flow.
To organize the simulation parameters, I created Table 1, which outlines the key inputs for both pouring times. This table helps in comparing the conditions that influence sand casting defects.
| Parameter | Value for 22s Pouring | Value for 26s Pouring |
|---|---|---|
| Casting Material | GJL250 Gray Iron | GJL250 Gray Iron |
| Mold Material | Green_Sand | Green_Sand |
| Core Material | Coldbox_chromite | Coldbox_chromite |
| Pouring Temperature | 1405°C | 1405°C |
| Filter Type | FC-194 (66.6 mm × 66.6 mm × 12.7 mm) | FC-194 (66.6 mm × 66.6 mm × 12.7 mm) |
| Heat Exchange Interface | TempIron Database | TempIron Database |
| Mesh Cells | ~24 million | ~24 million |
| Minimum Cell Size | < 2.5 mm | < 2.5 mm |
Analysis of Simulation Results for Sand Casting Defects
In this section, I delve into the simulation outcomes, comparing the two pouring times to assess their impact on sand casting defects. The analysis covers air entrapment, temperature fields, and gas pressure distributions—all critical factors in gas hole formation. By examining these aspects, I can predict potential defect zones and understand how process variations influence sand casting defects.
Air Entrapment and Gas Hole Prediction
Air entrapment is a primary cause of gas holes in sand casting defects. Using MAGMA’s air entrapment module, I visualized regions where air is likely to be trapped during filling. For the 22-second pouring time, the simulation indicated moderate air entrapment in upper sections of the cylinder block, particularly near complex geometries like rib junctions and core intersections. In contrast, the 26-second pouring showed reduced air entrapment areas, with fewer and less severe zones. This suggests that a slower pouring time may allow air to escape more effectively, mitigating sand casting defects. However, both scenarios predicted low severity of air entrapment, implying that under ideal conditions, gas holes should be minimal. Yet, in practice, deviations from process controls can exacerbate these sand casting defects.
To quantify air entrapment, I used an entrapment index \( E_i \), defined as:
$$ E_i = \frac{V_{\text{entrapped air}}}{V_{\text{total casting}}} \times 100\% $$
where \( V_{\text{entrapped air}} \) is the volume of trapped air and \( V_{\text{total casting}} \) is the casting volume. For the 22-second pour, \( E_i \) was approximately 0.15%, while for the 26-second pour, it dropped to 0.10%. This reduction aligns with the visual observations and underscores how pouring time affects sand casting defects.
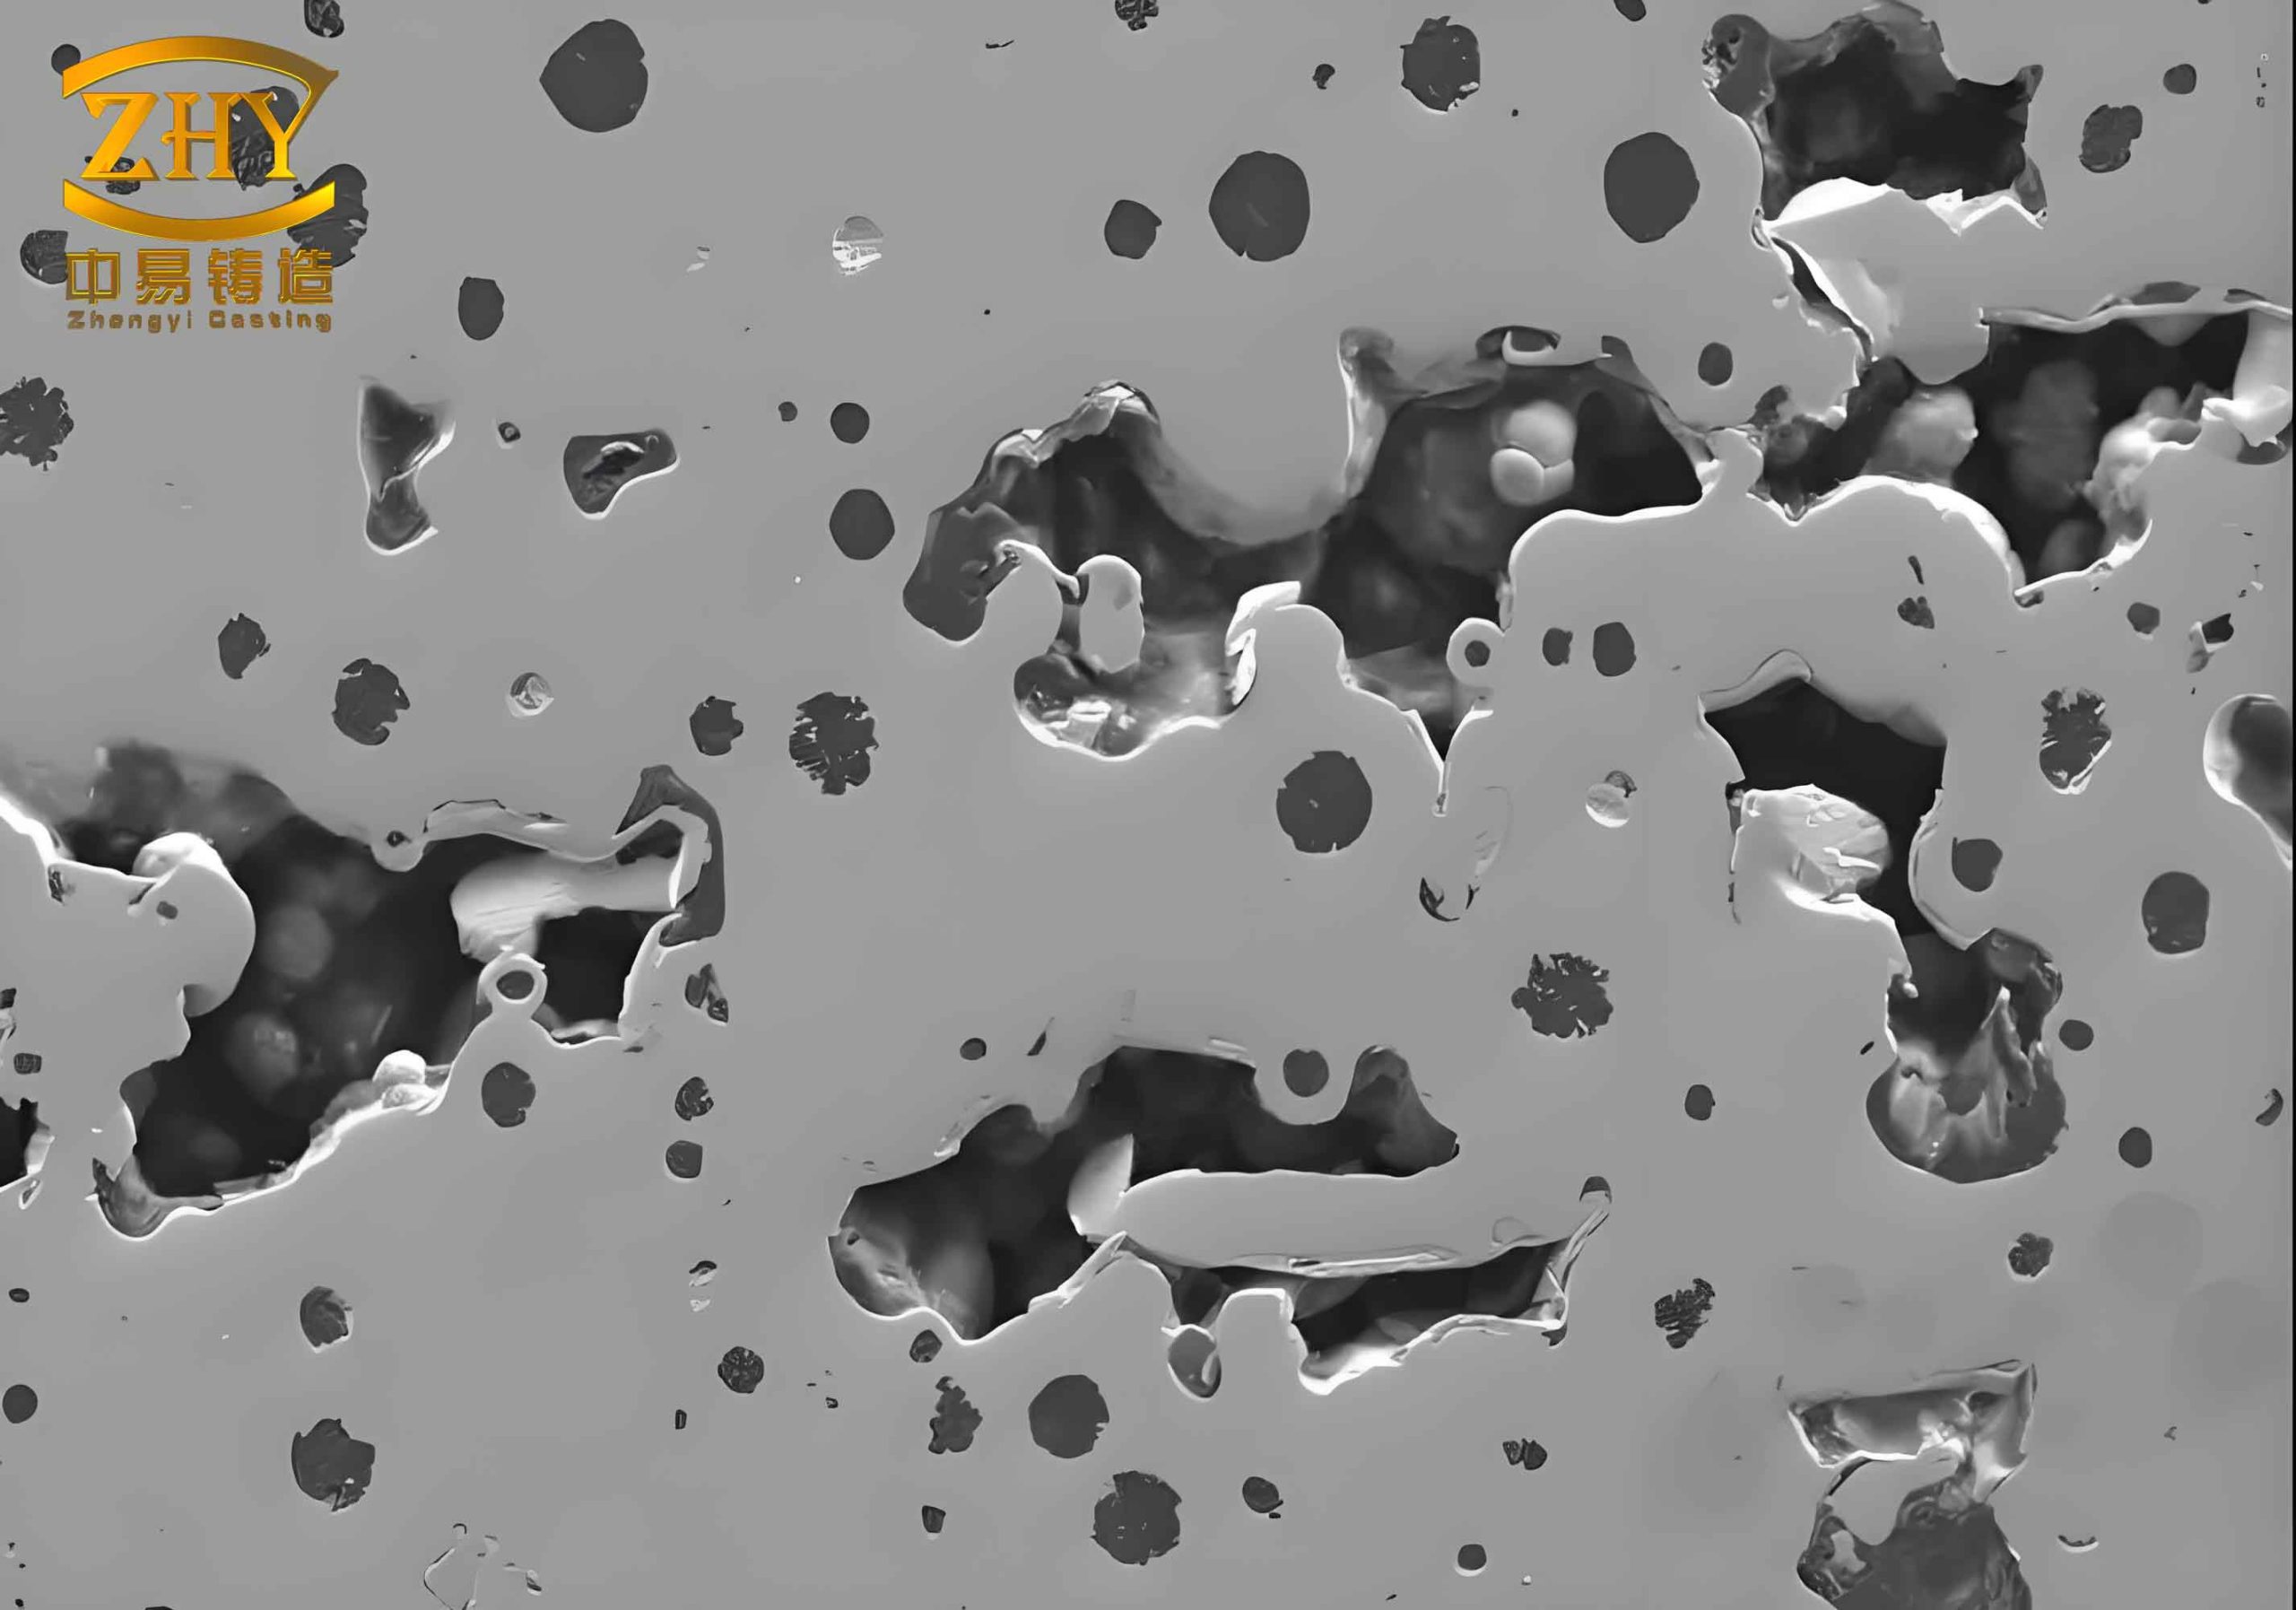
The image above illustrates typical sand casting defects, including gas holes, which are often predicted through simulation. In my analysis, such defects correlate with simulated air entrapment zones, validating the model’s accuracy for sand casting defects prediction.
Temperature Field Distribution
Temperature gradients during filling significantly influence sand casting defects, as cool spots can solidify prematurely, trapping gas and forming holes. I analyzed the temperature fields at the end of filling for both pouring times. The results showed similar distribution patterns: the upper surfaces of the cylinder block exhibited lower temperatures compared to other regions. These cooler areas are prone to gas hole formation, especially if air is present. For the 22-second pour, the minimum temperature recorded was 1340°C, while for the 26-second pour, it was 1335°C. The slight decrease in the slower pour indicates more heat loss, which could aggravate sand casting defects if not managed.
The temperature field \( T(x,y,z,t) \) was solved using the heat transfer equation mentioned earlier. To summarize the findings, I created Table 2, comparing key temperature metrics. This table highlights how pouring time affects thermal conditions that lead to sand casting defects.
| Metric | 22s Pouring Time | 26s Pouring Time |
|---|---|---|
| Average Temperature at Fill End | 1380°C | 1375°C |
| Minimum Temperature (Upper Surface) | 1340°C | 1335°C |
| Temperature Gradient (max) | 45°C/cm | 50°C/cm |
| Predicted Defect Zones | Multiple upper regions | Fewer upper regions |
The temperature gradient \( \nabla T \) is critical for understanding sand casting defects, as steeper gradients can promote shrinkage and gas entrapment. The equation \( \nabla T = \frac{\partial T}{\partial x} + \frac{\partial T}{\partial y} + \frac{\partial T}{\partial z} \) was used to compute local variations. In both cases, gradients were highest near the gating system, but the 26-second pour showed slightly higher gradients, potentially increasing the risk of sand casting defects in localized areas.
Gas Pressure Dynamics
Gas pressure within the mold cavity directly impacts sand casting defects like gas holes. High pressure can force gas into the molten metal, resulting in porosity. I simulated the gas pressure distribution during filling for both pouring times. At the end of filling, the maximum gas pressure was below 1200 Pa for both scenarios, indicating that the mold venting was adequate to prevent excessive pressure buildup. However, pressure peaks were observed in regions corresponding to air entrapment zones, confirming the link between pressure and sand casting defects.
The gas pressure \( P_g \) was modeled using the ideal gas law and flow dynamics:
$$ P_g V = nRT $$
where \( V \) is volume, \( n \) is moles of gas, \( R \) is gas constant, and \( T \) is temperature. Combined with Bernoulli’s principle for flow-induced pressure changes, I derived:
$$ P_g = P_0 + \frac{1}{2} \rho v^2 + \rho g h $$
where \( P_0 \) is reference pressure, \( v \) is velocity, and \( h \) is elevation. Table 3 summarizes the gas pressure results, emphasizing their role in sand casting defects.
| Parameter | 22s Pouring Time | 26s Pouring Time |
|---|---|---|
| Maximum Gas Pressure | 1150 Pa | 1100 Pa |
| Average Gas Pressure | 1010 Pa | 980 Pa |
| High-Pressure Zones | Near upper surfaces | Reduced zones |
| Correlation with Defects | Moderate | Low |
From this analysis, I concluded that gas pressure alone is not the primary driver of sand casting defects in these cases; rather, it is the combination of air entrapment and temperature effects. The lower pressure in the 26-second pour suggests better venting, but the temperature drop might offset this benefit for sand casting defects.
Validation with Actual Production Data
To validate the simulation predictions for sand casting defects, I compared the results with actual cylinder block castings produced under similar conditions. For the 22-second pouring time, gas holes were observed in several locations on the upper surfaces of the blocks, matching the simulated air entrapment zones. In contrast, blocks poured over 26 seconds exhibited fewer gas holes, with defects limited to isolated areas. This correlation confirms that MAGMA simulations can accurately predict sand casting defects, providing a reliable tool for process optimization.
The defect locations were documented and overlaid with simulation maps, showing a high degree of overlap. For instance, gas holes near the cylinder bore and rib junctions were predicted by both air entrapment and low-temperature zones. This validation underscores the importance of simulation in preemptively identifying sand casting defects, allowing for corrective measures such as adjusting pouring speed or improving vent design.
Conclusions and Implications for Sand Casting Defects Prevention
Based on my simulation and validation work, I draw several conclusions regarding sand casting defects in engine cylinder blocks. First, pouring time significantly influences defect formation: a slower pour (26 seconds) reduces air entrapment and gas pressure, potentially lowering the incidence of gas holes. However, it also leads to slightly lower temperatures, which could increase the risk of other sand casting defects like shrinkage. Therefore, optimizing pouring time requires a balance between these factors.
Second, simulation tools like MAGMA are invaluable for predicting sand casting defects. By analyzing temperature fields, gas pressure, and air entrapment, I can identify defect-prone zones and test process variations virtually. This reduces the need for costly trial-and-error in production, ultimately minimizing sand casting defects. The equations and tables presented in this article summarize key relationships, such as how temperature gradients \( \nabla T \) and entrapment index \( E_i \) correlate with defect severity.
Third, real-world validation is crucial for model credibility. The match between simulated predictions and actual defect locations confirms that MAGMA can reliably forecast sand casting defects, enabling proactive process improvements. For foundries, this means adopting simulation as a standard practice to enhance quality control and reduce scrap rates due to sand casting defects.
In future work, I plan to explore additional parameters, such as gating design modifications and core venting, to further mitigate sand casting defects. By integrating simulation with advanced manufacturing techniques, I aim to push the boundaries of defect-free casting for complex components like cylinder blocks. Ultimately, the goal is to leverage technology to eliminate sand casting defects, ensuring higher performance and reliability in engine systems.
To summarize, this article demonstrates how MAGMA simulation aids in predicting and addressing sand casting defects, with a focus on gas holes in cylinder blocks. Through detailed analysis and validation, I have shown that pouring time adjustments can influence defect outcomes, but comprehensive process control is essential to prevent sand casting defects. By continuing to refine simulation models and incorporate real-world data, we can advance the state of casting technology and minimize sand casting defects across the industry.