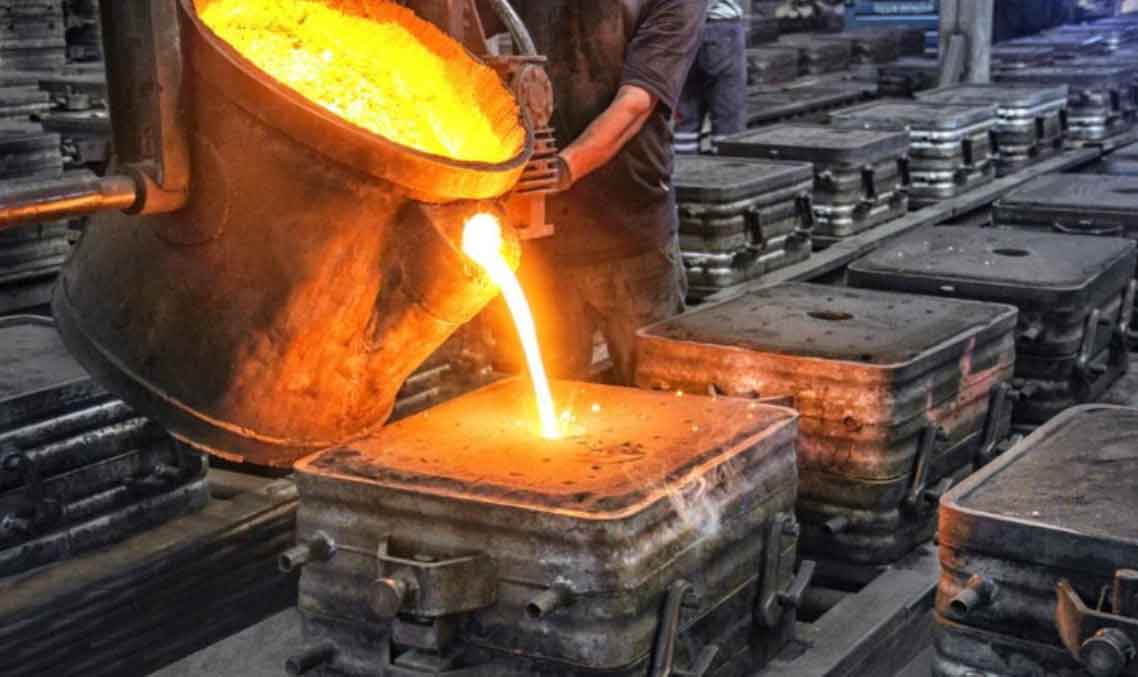
During the 14th Annual Conference of the China Foundry Association, our Executive Vice President and Secretary-General Zhang Zhiyong released comprehensive statistics on the China casting industry. The data reveals significant developments in production volumes, material composition, and market dynamics, reinforcing China’s pivotal role in global manufacturing.

Total casting output reached 49.4 million metric tons in 2017, demonstrating a robust growth rate of 4.7% year-over-year. This continues a consistent expansion trend since 2002, with 2015 being the sole exception showing a 1.3% decline. The compound annual growth rate (CAGR) has moderated from historical highs, transitioning to a stable mid-to-low growth pattern since 2011. Output growth can be modeled as:
$$ \text{Annual Growth} = \frac{Y_{2017} – Y_{2016}}{Y_{2016}} \times 100\% = \frac{49.4 – 47.2}{47.2} \times 100\% = 4.7\% $$
Material-specific production trends highlight evolving industrial priorities. Gray iron and ductile iron remain dominant, while aluminum/magnesium alloys show accelerated adoption driven by lightweighting initiatives. The table below details five-year material distribution:
| Material | 2013 | 2014 | 2015 | 2016 | 2017 | Growth Rate (2017/2016) |
|---|---|---|---|---|---|---|
| Gray Iron | 20.55 | 20.80 | 20.20 | 20.35 | 21.15 | 3.9% |
| Ductile Iron | 11.60 | 12.40 | 12.60 | 13.20 | 13.75 | 4.2% |
| Steel Castings | 5.50 | 5.50 | 5.10 | 5.10 | 5.55 | 8.8% |
| Al/Mg Alloys | 5.20 | 5.85 | 6.10 | 6.90 | 7.30 | 5.8% |
| Other Materials | 1.65 | 1.65 | 1.65 | 1.65 | 1.65 | 0.0% |
| Total | 44.50 | 46.20 | 45.65 | 47.20 | 49.40 | 4.7% |
Material share evolution demonstrates strategic shifts in China casting applications. Steel castings rebounded to 11.3% of total output (10.8% in 2016), while aluminum/magnesium alloys expanded to 14.8% (14.6% in 2016). The market share differentials follow the relationship:
$$ \Delta S_{\text{Al/Mg}} = S_{2017} – S_{2016} = 14.8\% – 14.6\% = 0.2\% $$
Downstream sector demand drove production dynamics, with automotive emerging as the dominant force accounting for 30.6% of total casting consumption. Automotive casting demand grew by 7.1%, contributing approximately 1 million additional metric tons. Construction machinery and rail transportation showed remarkable growth at 15.2% and 14.3% respectively. Automotive production data illustrates sectoral drivers:
| Category | Production (10,000 units) | YoY Change | Sales (10,000 units) | YoY Change |
|---|---|---|---|---|
| Total Vehicles | 2,901.5 | 3.2% | 2,887.9 | 3.0% |
| Passenger Vehicles | 2,480.7 | 1.6% | 2,471.8 | 1.4% |
| Commercial Vehicles | 420.9 | 13.8% | 416.1 | 14.0% |
| New Energy Vehicles | 79.4 | 53.8% | 77.7 | 53.3% |
International trade patterns reveal quality disparities in China casting exports. While export tonnage decreased by 2.6%, delivery value increased by 5.5% due to currency fluctuations. Imported castings commanded premium prices, with unit value 5.4× higher than exports, indicating technology gaps in high-value segments:
$$ \text{Import Premium} = \frac{\text{Avg. Import Price}}{\text{Avg. Export Price}} = \frac{7,844}{1,450} \approx 5.4 $$
| Metric | 2016 | 2017 | Change |
|---|---|---|---|
| Export Volume (million tons) | 1.873 | 1.823 | -2.6% |
| Export Value (billion USD) | 2.506 | 2.644 | 5.5% |
| Export Unit Value (USD/ton) | 1,338 | 1,450 | 8.4% |
| Import Volume (million tons) | 0.015 | 0.019 | 29.3% |
| Import Value (billion USD) | 0.114 | 0.152 | 33.3% |
| Import Unit Value (USD/ton) | 7,574 | 7,844 | 3.6% |
The China casting industry demonstrates adaptive capacity through material innovation and market diversification. Automotive sector dominance continues to shape production priorities, while export metrics indicate ongoing challenges in high-value market penetration. As lightweighting initiatives accelerate, aluminum/magnesium alloy production is projected to maintain above-average growth rates. The persistent unit-value gap between imports and exports underscores the strategic imperative for technological advancement in premium China casting segments. These trends collectively depict an industry in transition, balancing scale advantages with quality enhancement imperatives to strengthen global competitiveness.
