
The assessment and optimization of casting processes are fundamental to achieving high-integrity, defect-free components. This is particularly critical for complex castings like high-manganese steel mill liners, which are subject to severe impact and abrasive wear in service. Among various methods, the lost foam casting process presents unique advantages in design flexibility and dimensional accuracy, but it also introduces distinct challenges in controlling mold filling and solidification defects. Traditional trial-and-error methods are costly and time-consuming. Therefore, this work employs a systematic finite element simulation approach to evaluate and compare different lost foam casting process layouts for producing a high-manganese steel liner. The primary objective is to analyze the filling behavior, solidification patterns, and the propensity for shrinkage defects—primarily porosity and cavities—across three distinct lost foam casting process designs. The core methodology hinges on simulating the complete casting sequence, from the initial metal front advancement to the final solidification, for each lost foam casting process variant.
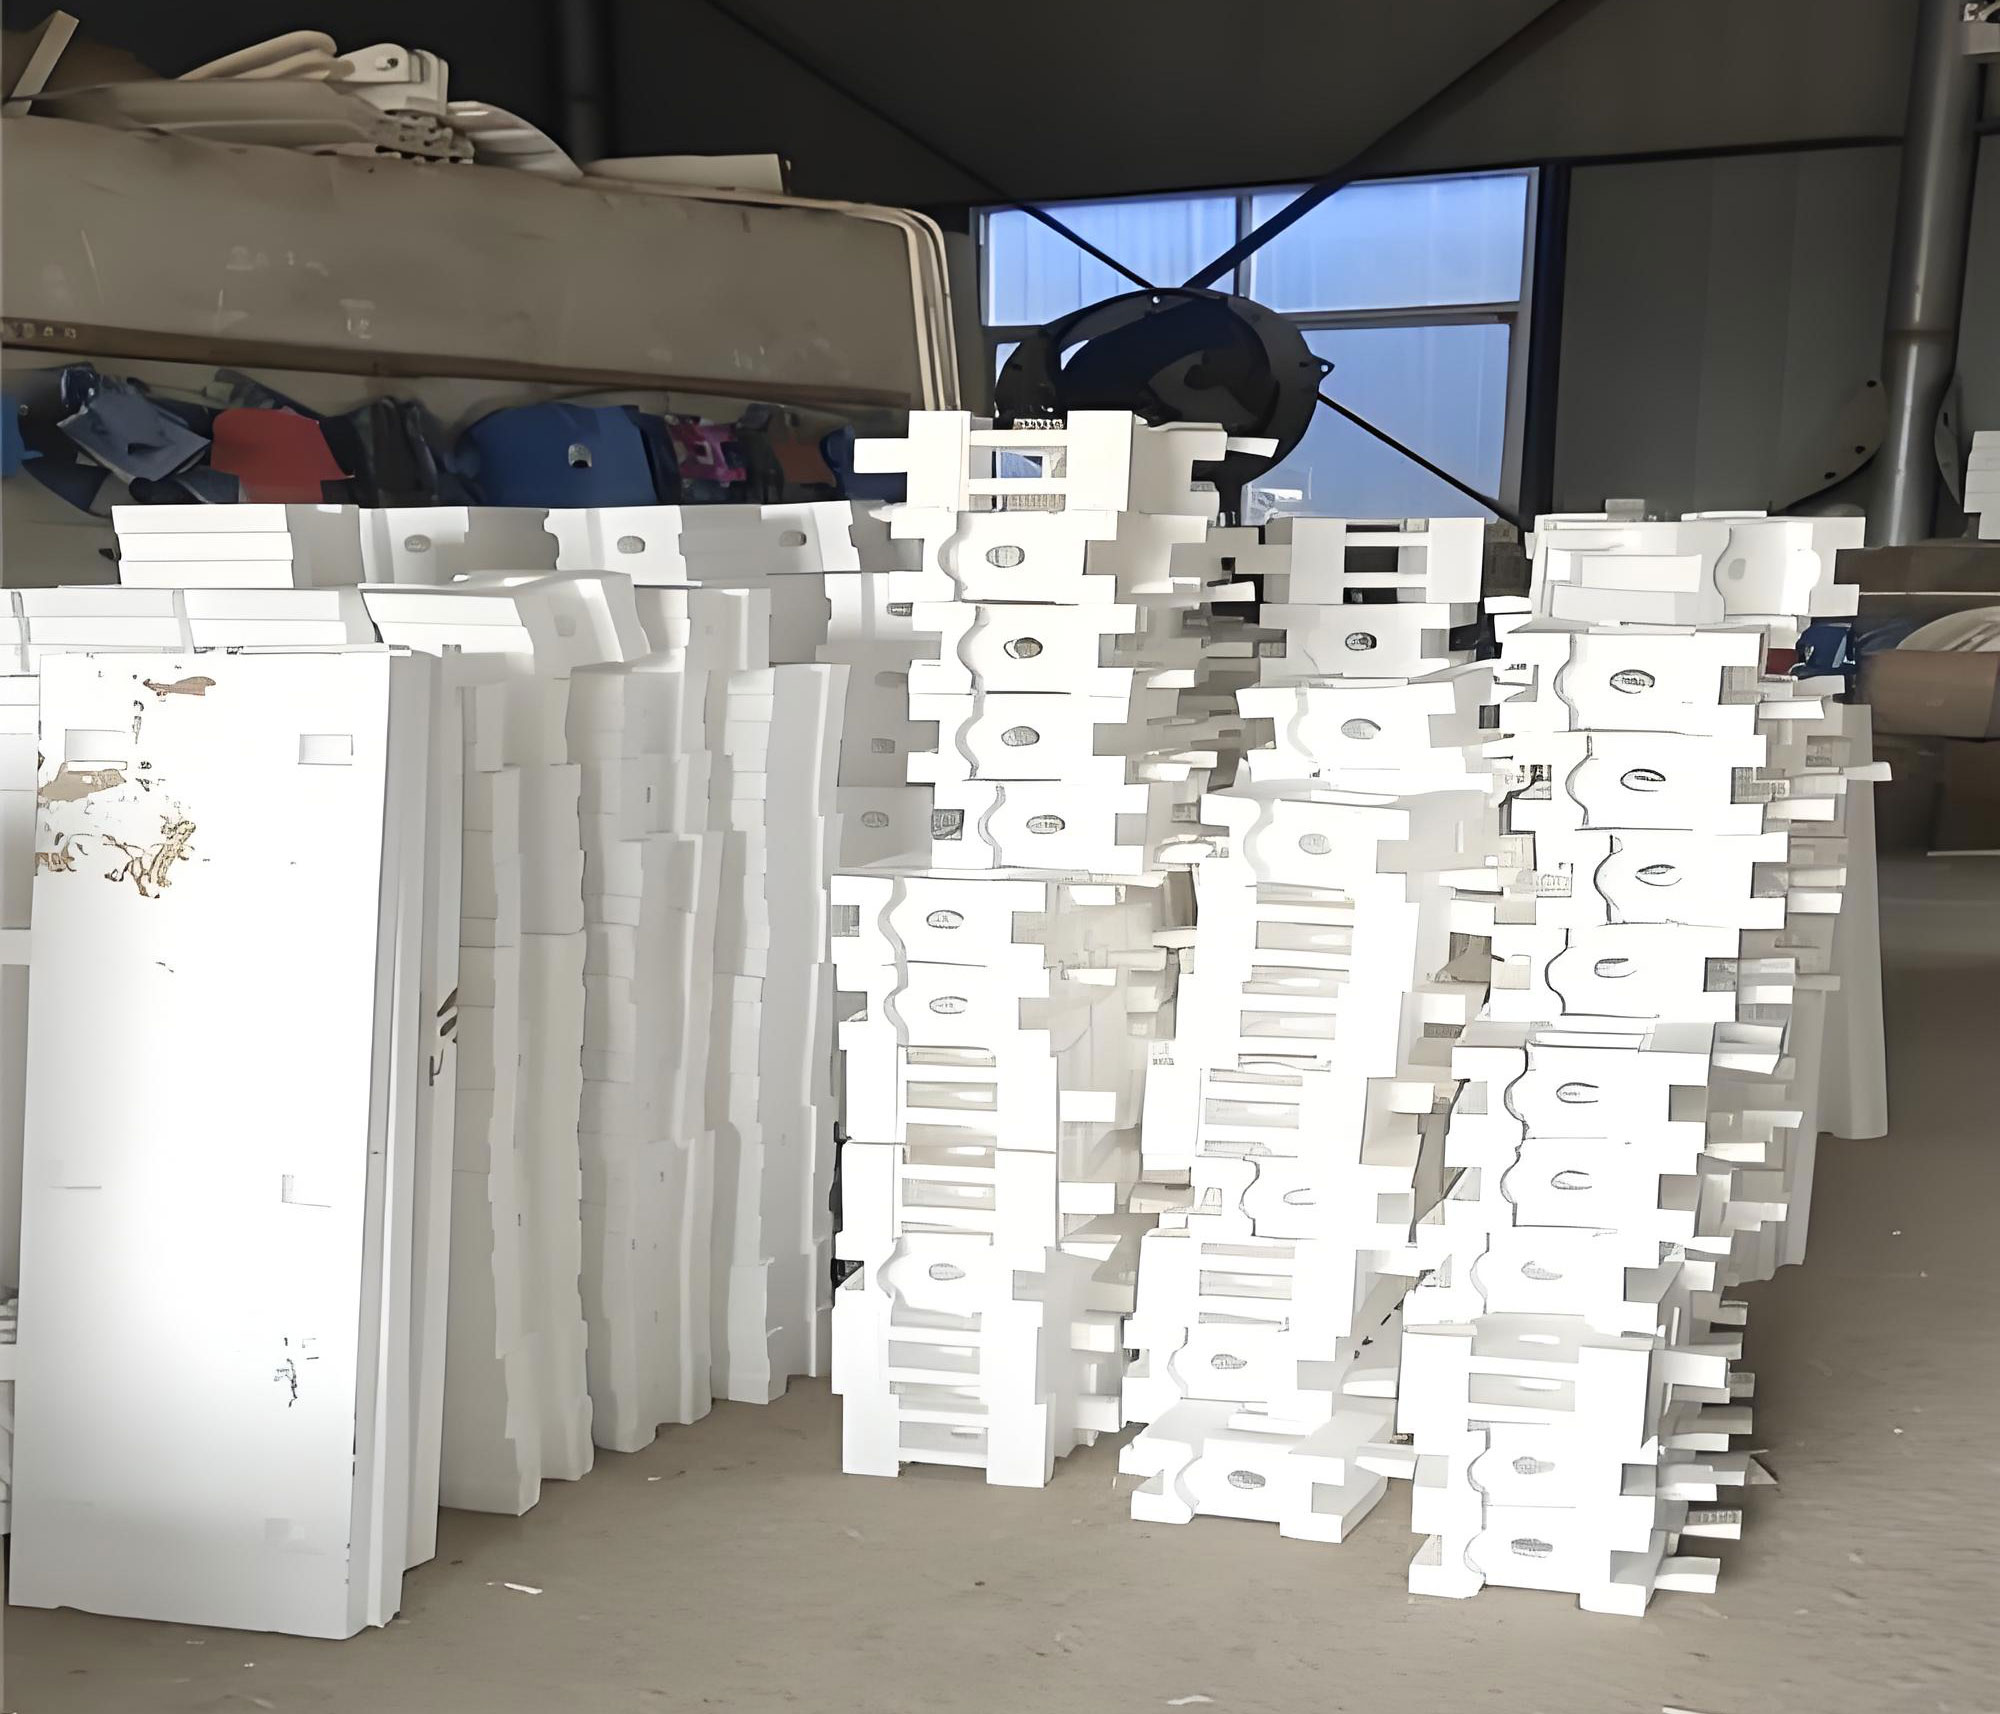
The casting under investigation is an approximate rectangular plate with a single-peak, wavy working surface, featuring varying thickness from 80 mm to 120 mm. To ensure a systematic evaluation, three distinct lost foam casting process layouts were conceived:
| Process Designation | Gating Style | Number of Castings per Mold | Feeding System Feature |
|---|---|---|---|
| Process A | Top Gating | 8 | No Feeding Risers |
| Process B | Stepped Side Gating | 10 | No Feeding Risers |
| Process C | Side Gating | 4 | With Feeding Risers |
The core material for the liner is a standard high-manganese steel (ZGMn13), whose thermophysical properties are crucial for accurate simulation. The key parameters, calculated using the software’s database module with a cooling rate of 5 °C/s, are summarized below. The foam pattern is made of Expandable Polystyrene (EPS) with a density of 25 kg/m³, and the molding aggregate is resin-bonded sand.
| Material | Key Property | Value / Description |
|---|---|---|
| High-Mn Steel | Liquidus Temperature | ~1390 °C |
| Solidus Temperature | ~1350 °C | |
| Latent Heat of Fusion | ~260 kJ/kg | |
| Solidification Shrinkage | Approx. 4-5% | |
| EPS Pattern | Pyrolysis Start Range | 330 – 350 °C |
| Effective Conductivity (vs. metal) | 0.15 W/(m·K) | |
| Specific Heat Capacity | 3.7 kJ/(kg·K) | |
| Resin Sand | Permeability | 1×10⁻⁷ m² |
| Thermal Conductivity | 0.53 W/(m·K) |
The governing equations for fluid flow, heat transfer, and mass conservation are solved within the finite element framework. A critical aspect of modeling the lost foam casting process is the treatment of the metal-foam interface. The heat transfer coefficient (HTC) between the advancing metal and the decomposing foam pattern is dynamically adjusted based on distance to mimic the complex gap formation:
$$ HTC_{metal-foam} = f(d) $$
where a high HTC (~250 W/(m²·K)) is applied at contact, decreasing significantly over a small gap distance (e.g., ~20 W/(m²·K) at 10 mm). The pouring temperature was set at 1,420 °C with a pouring rate of 20 kg/s. A vacuum pressure of 0.045 MPa was applied to the sand mold. The mesh consisted of tetrahedral elements, with local refinement down to 5 mm in critical areas like the liner’s grooves.
The analysis begins with the mold-filling stage, which is paramount in the lost foam casting process due to the dynamic interaction between the molten metal and the vaporizing foam. For Process A (top-gating, 8 castings), the simulation revealed non-uniform filling. Metal entered the eight pattern cavities at different rates, with those closest to the sprue filling faster. More critically, as filling progressed (around 70% complete), flow disturbance became evident in several cavities. This is attributed to the pressure buildup from pyrolysis gases trapped in the gap between the metal and the retreating foam, which can destabilize the flow front. The last areas to fill were the bottoms of four liners.
The filling behavior for Process B (stepped-side-gating, 10 castings) was even more problematic. Although metal entered the patterns in a staggered manner as designed, severe flow turbulence was observed in the final stages, particularly in two centrally located liners. The extended flow paths and the complex gas evolution from ten simultaneously decomposing patterns likely exacerbated the back-pressure, leading to highly disordered filling. The final filling points were again at the bottom sections of several liners.
In stark contrast, the Process C (side-gating with risers, 4 castings) exhibited a remarkably smooth and stable filling sequence. With fewer patterns and a more direct gating approach, the metal front advanced uniformly without significant turbulence. The gas generated from foam decomposition was able to vent more effectively, minimizing disruptive back-pressure. This demonstrates a clear advantage of this particular lost foam casting process layout in terms of filling stability.
The temperature distribution at the end of filling sets the initial condition for solidification and is telling of the thermal uniformity achieved by each lost foam casting process. For Process A, the temperature field was relatively uniform across the eight castings, with a maximum variation of about 30°C. Process B showed the worst thermal gradient, with a temperature difference exceeding 50°C between the first and last liners to fill, a direct consequence of its turbulent and prolonged filling. Process C displayed the most uniform temperature distribution among its four castings, with minimal variation, promoting a more predictable solidification sequence.
Solidification analysis for all three lost foam casting process schemes revealed a common macroscopic pattern: directional solidification initiating from the thin outer walls of the liner towards the thicker central section. However, the presence and effectiveness of feeding paths differed drastically.
In both Process A and B, which lacked feeding risers, the solidification fronts from all sides progressed inward, eventually isolating liquid pools in the thermal center (hot spot) of each liner. These isolated liquid regions, upon contracting during the final stage of solidification, are destined to form shrinkage cavities unless fed. The solid fraction evolution over time can be described by:
$$ f_s(T) = \frac{1}{1 – \kappa} \cdot \frac{T_L – T}{T_L – T_S} $$
where $f_s$ is the solid fraction, $\kappa$ is the partition coefficient, and $T_L$ and $T_S$ are the liquidus and solidus temperatures, respectively. The mushy zone for high-manganese steel is wide, leading to a prolonged pasty mode of solidification that hinders interdendritic feeding.
Process C, equipped with side risers, initially provided a feeding path to the liner’s thick section. The risers remained liquid longer than the casting hot spot, theoretically allowing metal to compensate for solidification shrinkage. However, as simulation progressed, the thermal center of the liner itself still became isolated before the riser connection solidified, indicating that the riser design, while helpful, was not fully optimized to eliminate the hot spot entirely. Nevertheless, the defect location was more controlled.
The final and most critical evaluation metric is the prediction of shrinkage defects. Two established criteria were used: the software’s proprietary POROS criterion, which identifies isolated liquid regions and predicts macro-shrinkage (cavities) where the predicted porosity exceeds a threshold (e.g., 1%), and the widely used Niyama criterion for micro-porosity. The Niyama criterion $N_y$ is given by:
$$ N_y = \frac{G}{\sqrt{\dot{T}}} $$
where $G$ is the temperature gradient at the end of solidification and $\dot{T}$ is the cooling rate. Regions where $N_y$ falls below a critical value are prone to shrinkage porosity.
The defect prediction results are synthesized in the table below:
| Process | POROS Criterion Prediction | Niyama Criterion Prediction | Defect Character |
|---|---|---|---|
| Process A | Significant shrinkage cavity risk in the last four liners to fill. Defects concentrated in the core. | High porosity risk in the core. For the middle four liners, low $N_y$ values extended closer to the surface. | Defects are core-located but somewhat dispersed; some surface-near risk exists. |
| Process B | Severe and extensive shrinkage cavity risk across all ten liners. The middle six liners showed pronounced defect zones. | Extremely high risk. The middle six liners exhibited very low $G/\sqrt{\dot{T}}$ ratios at and near the surface. | Defects are severe, widespread, and critically, located near the working surface. |
| Process C | Limited shrinkage cavity risk, confined strictly to the central core region of each liner. | Porosity risk is present but highly localized to the geometric center. Surface regions show high $N_y$ values. | Defects are minimized and centralized deep within the casting bulk. |
The underlying physical reason for the superiority of Process C in this lost foam casting process evaluation lies in the fundamentals of feeding. The solidification shrinkage $\beta$ must be compensated by liquid feed metal. The pressure drop $\Delta P$ required for interdendritic feeding over a length $L$ in the mushy zone is approximated by Darcy’s law:
$$ \Delta P = \frac{\mu \cdot \beta \cdot L^2 \cdot \dot{T}}{K} $$
where $\mu$ is viscosity and $K$ is the permeability of the mushy zone. A steeper temperature gradient $G$ reduces the effective feeding distance $L$, thereby reducing $\Delta P$ and the risk of pore formation. The smoother filling and more favorable thermal profile in Process C promoted a higher $G$ in critical areas compared to the other lost foam casting process layouts.
The comprehensive simulation-based evaluation of the three lost foam casting process designs leads to a definitive conclusion. While all three processes completed filling and solidification, their outcomes regarding internal quality differed profoundly.
- Process A (Top-gating, 8 pieces): This lost foam casting process layout suffers from unstable filling leading to thermal inequity among castings. While defects are primarily core-located, their distribution is not fully centralized, and some risk exists near sub-surface regions, which is undesirable for a wear component.
- Process B (Stepped-side-gating, 10 pieces): This lost foam casting process layout demonstrated the poorest performance. The highly turbulent filling created severe thermal imbalances. Most critically, the simulation predicted extensive shrinkage defects located dangerously close to or at the casting surface. Such defects would act as stress concentrators and initiate rapid failure during service, making this process unacceptable.
- Process C (Side-gating with risers, 4 pieces): This lost foam casting process layout emerged as the optimal choice. It provided the most stable and controlled filling, leading to a uniform thermal field. Although not perfect, as the riser did not completely eliminate the central hot spot, it successfully centralized all predicted shrinkage defects deep within the core of the casting. This localization ensures that the critical working surface of the liner remains sound and free from defect-initiated failure.
Therefore, based on the finite element analysis of filling dynamics, solidification sequencing, and defect prediction via both POROS and Niyama criteria, the side-gating lost foam casting process with a reduced mold count and incorporating feeding risers (Process C) is validated as the most robust and reliable manufacturing route for producing high-integrity high-manganese steel mill liners. This evaluation underscores the power of simulation in optimizing the lost foam casting process, moving it from an experience-based art towards a predictive engineering science.