
In the realm of advanced manufacturing, the investment casting process stands out for its ability to produce complex, high-precision components with excellent surface finish and dimensional accuracy. However, due to the intricate nature of the process—involving multiple steps such as pattern making, shell building, dewaxing, firing, and pouring—the occurrence of defects is more frequent compared to conventional sand casting. These defects can significantly impact product quality, lead to increased scrap rates, and affect overall production stability. Therefore, a systematic approach to defect management is crucial. Through my experience and analysis, I have identified key factors influencing defects in the investment casting process and implemented control measures to enhance yield and ensure consistent production. This article delves into a detailed statistical analysis of defect causes, emphasizes critical process stages, and proposes effective control strategies, all aimed at optimizing the investment casting process.
The investment casting process, often referred to as lost-wax casting, involves creating a wax pattern, coating it with ceramic slurry to form a shell, melting out the wax, and pouring molten metal into the cavity. Each step introduces variability that can lead to defects. To manage this, I conducted a comprehensive analysis of defect occurrences across various production stages. By applying statistical principles, I quantified the influence of each process parameter on defect formation. This allowed me to pinpoint the most critical areas requiring stringent control. The following sections present this analysis, focusing on defect factors, key process controls, and practical solutions. Throughout this discussion, the term “investment casting process” will be frequently reiterated to underscore its centrality in defect genesis and mitigation.
Statistical Analysis of Defect Influence Factors in Investment Casting Process
Defects in the investment casting process arise from a multitude of factors spanning the entire production chain. To systematically address them, I compiled data from production records and performed a cause-and-effect analysis. The defects were categorized into common types such as shrinkage porosity, hot tears, cold shuts, misruns, gas porosity, inclusions, surface roughness, dimensional inaccuracies, and shell-related issues like rat tails and veining. Each defect was traced back to specific process stages. The results are summarized in Table 1, which lists the major process stages and their associated defect counts based on historical data. This quantitative approach helps prioritize control efforts.
| Process Stage | Key Defects Influenced | Defect Count (Relative Frequency) | Primary Contributing Factors |
|---|---|---|---|
| Pattern Making | Dimensional inaccuracies, surface defects | 85 | Wax quality, injection parameters, pattern assembly |
| Shell Building (Mold Manufacturing) | Rat tails, veining, inclusions, surface roughness, metal penetration | 210 | Slurry viscosity, sand grain size, drying conditions, layer bonding |
| Dewaxing and Firing | Cracking, shell strength issues, gas defects | 95 | Temperature ramp rates, holding times, atmosphere |
| Pouring Process | Cold shuts, misruns, gas porosity, shrinkage, hot tears | 185 | Pouring temperature, mold temperature, pouring speed, atmosphere |
| Process Design (Gating and Feeding) | Shrinkage porosity, hot tears, mistuns, inclusions | 175 | Gating system design, riser placement, chill design, orientation |
| Alloy Preparation and Handling | Inclusions, gas porosity, composition variations | 120 | Melting practice, degassing, filtration, temperature control |
| Post-casting Operations (Knockout, Cleaning) | Mechanical damage, residual stresses | 65 | Handling methods, cutting techniques, heat treatment |
The data from Table 1 can be visualized to highlight the most influential stages. For instance, the shell building and pouring process stages account for a significant portion of defects. To further analyze, I computed the percentage contribution of each stage to total defects using the formula:
$$ P_i = \frac{C_i}{\sum_{j=1}^{n} C_j} \times 100\% $$
where \( P_i \) is the percentage contribution of process stage \( i \), \( C_i \) is the defect count for stage \( i \), and \( n \) is the total number of stages. Applying this to the data yields:
| Process Stage | Defect Count | Percentage Contribution (%) |
|---|---|---|
| Shell Building | 210 | 24.7 |
| Pouring Process | 185 | 21.8 |
| Process Design | 175 | 20.6 |
| Alloy Preparation | 120 | 14.1 |
| Dewaxing and Firing | 95 | 11.2 |
| Pattern Making | 85 | 10.0 |
| Post-casting Operations | 65 | 7.6 |
| Total | 850 | 100.0 |
From this analysis, it is evident that shell building, pouring process, and process design are the top three contributors, collectively responsible for over 67% of defects in the investment casting process. This underscores the need for focused control measures in these areas. The investment casting process, by its multi-step nature, demands rigorous attention to these critical stages to minimize defects and enhance yield.
Control of Key Process Stages in Investment Casting Process
Based on the statistical analysis, I have implemented targeted controls for the most influential stages: pouring process, shell building, and process design. Each stage involves multiple parameters that must be optimized to reduce defects. Below, I elaborate on these controls, incorporating formulas and tables to summarize best practices.
Pouring Process Control
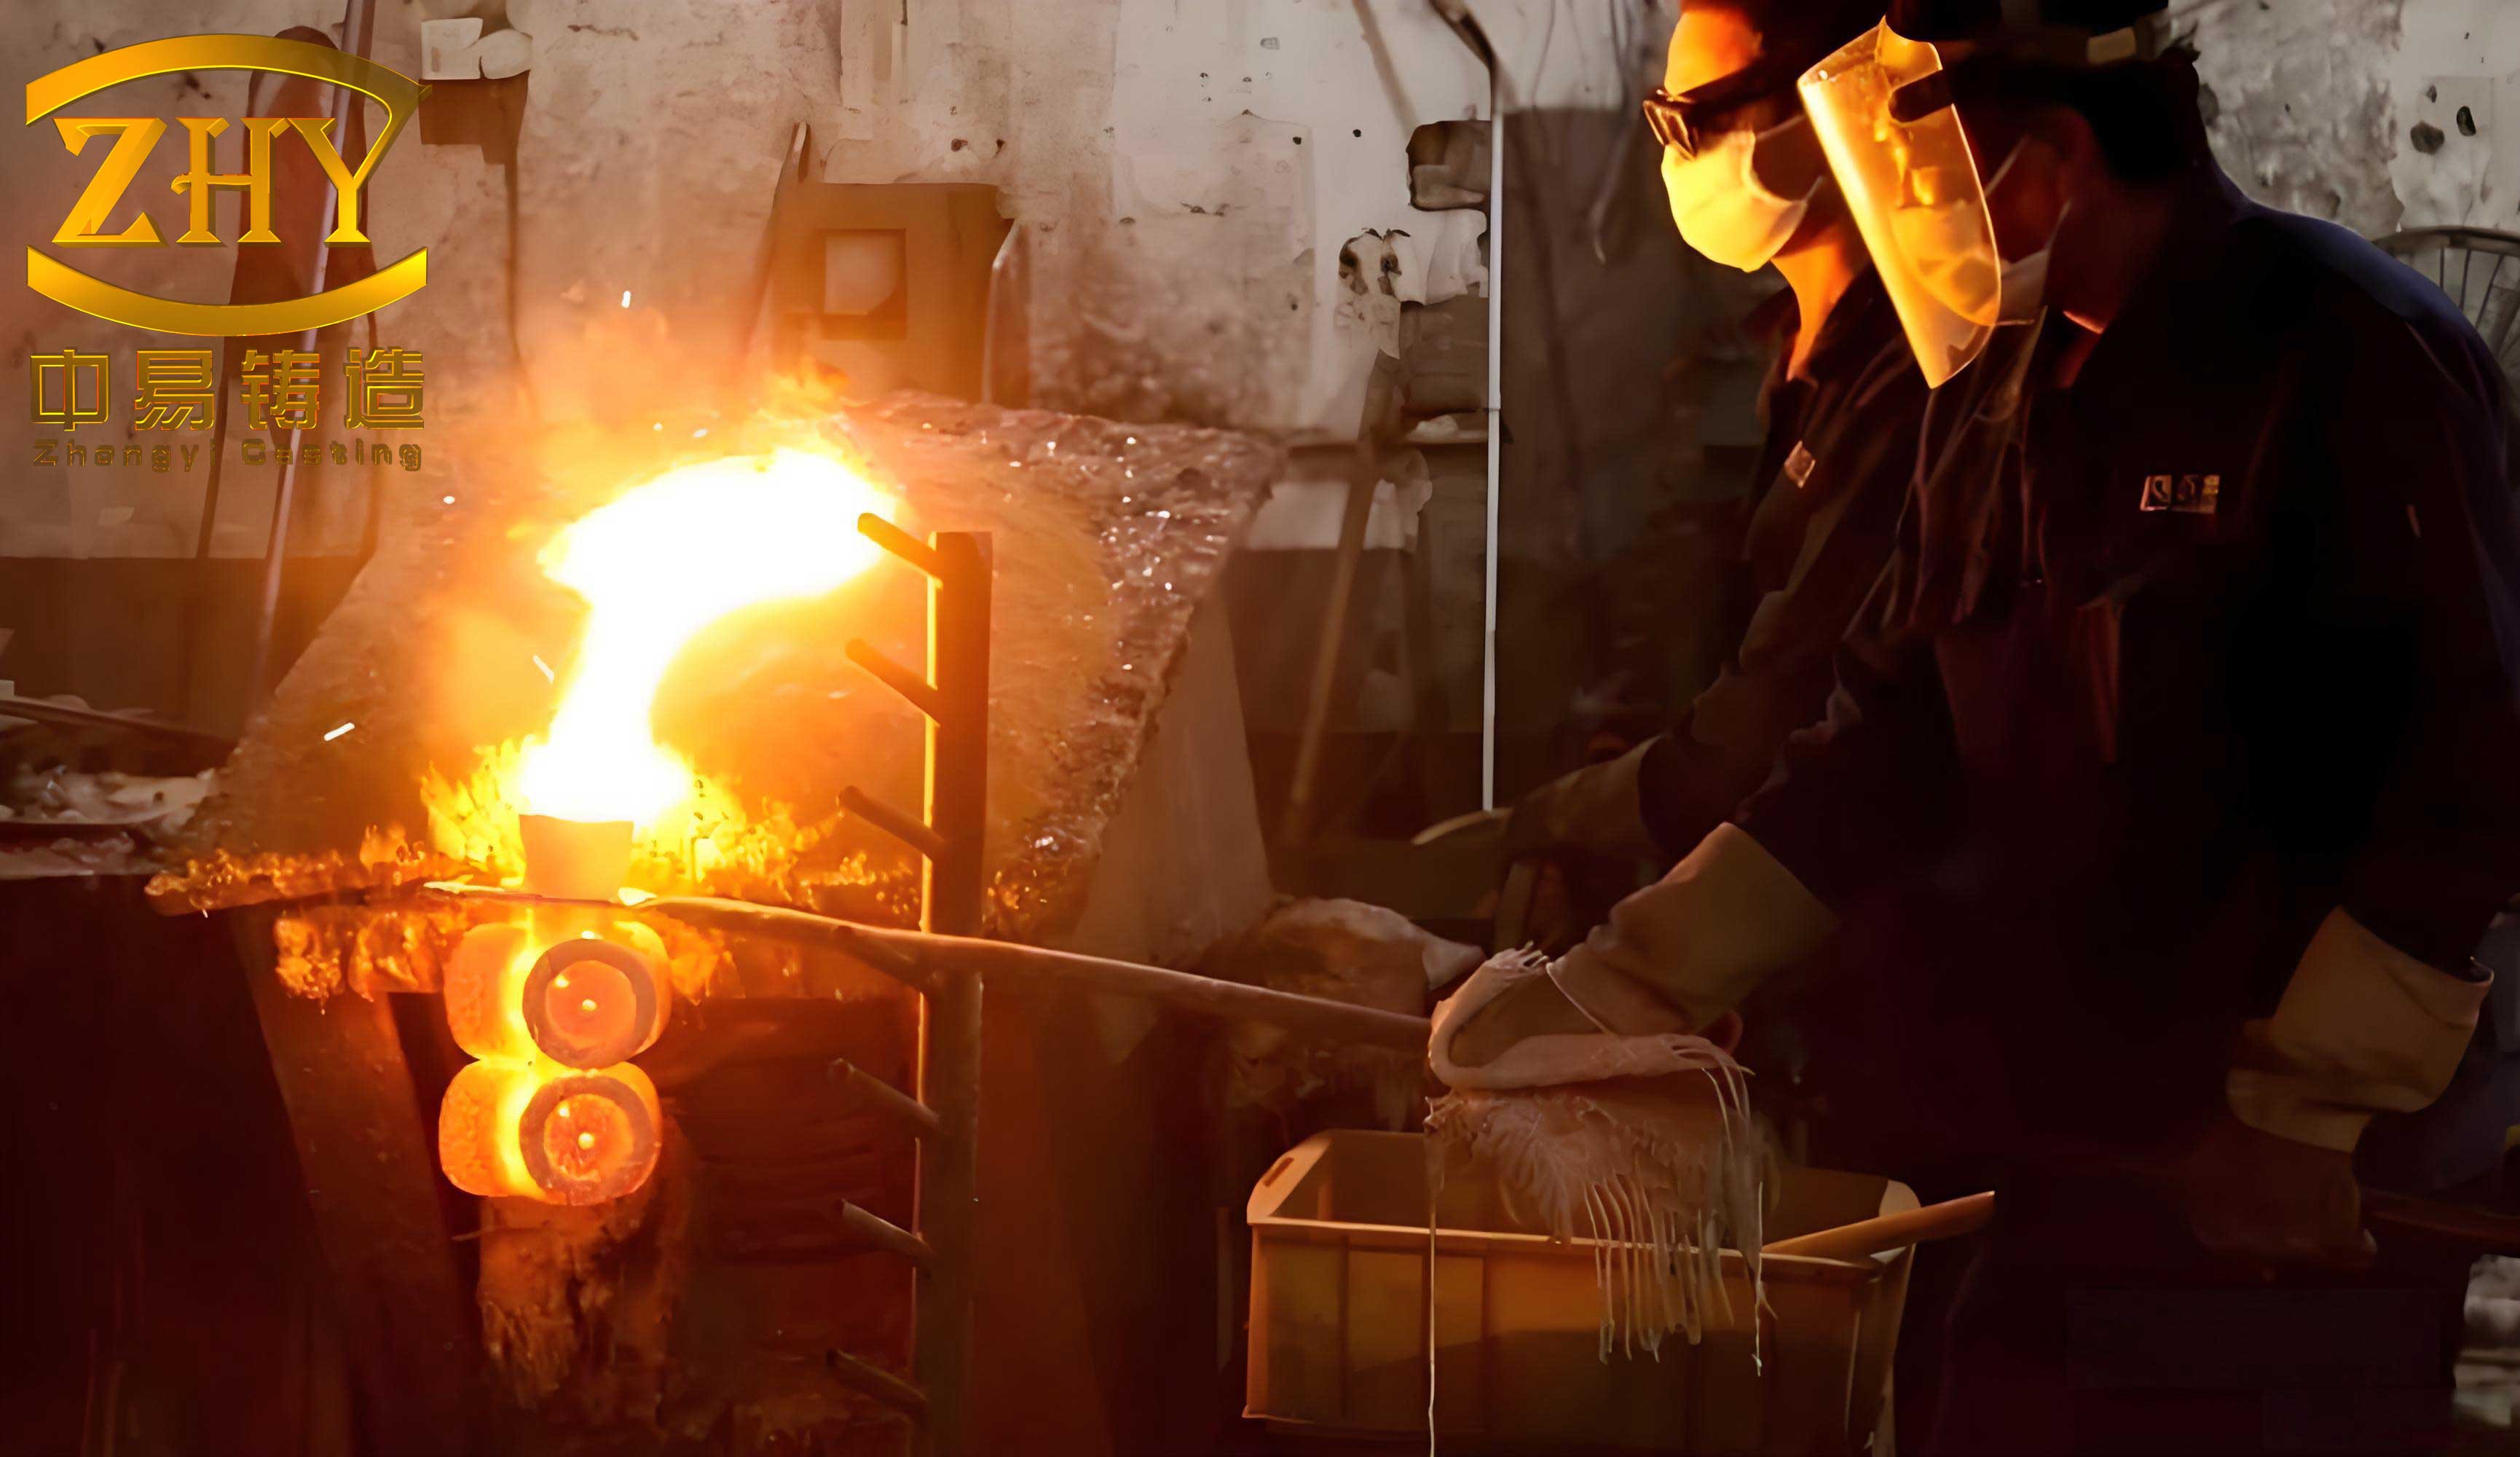
The pouring process in the investment casting process directly affects surface quality, internal soundness, and dimensional integrity. Key parameters include pouring temperature, mold temperature, pouring speed, and atmospheric conditions. In traditional small-scale operations, experience often guides temperature settings, but for consistent quality, precise measurement and control are essential.
Pouring Temperature: The optimal pouring temperature \( T_p \) can be derived from the alloy liquidus temperature \( T_l \) and the required superheat \( \Delta T \):
$$ T_p = T_l + \Delta T $$
For most steels, \( \Delta T \) ranges from 120°C to 200°C. However, this can vary based on section thickness and complexity. A more refined formula accounts for heat transfer:
$$ T_p = T_l + \frac{Q}{c_p \cdot \rho \cdot V} $$
where \( Q \) is the heat loss during pouring, \( c_p \) is specific heat, \( \rho \) is density, and \( V \) is volume. To prevent cold shuts and misruns, the temperature must ensure proper fluidity. I recommend using pyrometers for real-time monitoring. Table 3 summarizes recommended pouring temperatures for common alloys in the investment casting process.
| Alloy Type | Liquidus Temperature (°C) | Superheat Range (°C) | Typical Pouring Temperature (°C) |
|---|---|---|---|
| Carbon Steel | ~1530 | 120-180 | 1650-1710 |
| Stainless Steel (304) | ~1450 | 130-200 | 1580-1650 |
| Aluminum Alloy (A356) | ~615 | 80-150 | 695-765 |
| Nickel-based Superalloy | ~1350 | 150-220 | 1500-1570 |
Mold Temperature: Preheating the ceramic shell reduces thermal shock and improves metal flow. For silica-based shells, typical preheat temperatures are 800-1100°C, depending on alloy and section thickness. The relationship between mold temperature \( T_m \) and pouring temperature \( T_p \) can be expressed to minimize thermal gradients:
$$ \nabla T = \frac{T_p – T_m}{d} $$
where \( \nabla T \) is the temperature gradient and \( d \) is the wall thickness. Lower gradients reduce hot tearing and shrinkage defects.
Pouring Speed and Atmosphere: Pouring speed should be controlled to avoid turbulence, which can entrap gas and inclusions. Vacuum or inert atmosphere pouring is beneficial for reactive alloys. The Reynolds number \( Re \) can guide laminar flow:
$$ Re = \frac{\rho v D}{\mu} $$
where \( v \) is velocity, \( D \) is sprue diameter, and \( \mu \) is viscosity. Keeping \( Re \) below 2000 promotes laminar flow. Implementing these controls has significantly reduced defects related to pouring in the investment casting process.
Mold Shell Manufacturing Control
The ceramic shell is critical in the investment casting process, as it directly influences surface finish, dimensional accuracy, and defect formation such as rat tails, veining, inclusions, and metal penetration. Shell quality depends on slurry composition, coating techniques, drying, and firing.
Slurry Formulation: The primary coat slurry must have a high powder-to-binder ratio to ensure a dense surface. The viscosity \( \eta \) should be optimized using the formula:
$$ \eta = k \cdot (C – C_0)^n $$
where \( k \) and \( n \) are constants, \( C \) is solids concentration, and \( C_0 \) is a critical concentration. Typical viscosities range from 15 to 30 seconds per Ford cup #4. Adding wetting agents and defoamers is essential to eliminate bubbles. Table 4 outlines key parameters for shell building in the investment casting process.
| Parameter | Optimal Range | Impact on Defects |
|---|---|---|
| Primary Slurry Viscosity | 18-25 seconds (Ford cup #4) | Reduces surface roughness, metal penetration |
| Sand Grain Size (Primary Coat) | 80-120 mesh | Improves surface finish, prevents veining |
| Drying Time (Between Coats) | 4-8 hours at 20-25°C, 40-60% RH | Prevents shell cracking, improves layer bonding |
| Firing Temperature | 950-1100°C for binder-based shells | Eliminates volatiles, enhances strength |
| Firing Time | 0.5-2 hours depending on thickness | Ensures complete burnout, reduces gas defects |
Layer Bonding and Drying: To prevent delamination (rat tails), ensure good adhesion between layers. The bonding strength \( \sigma_b \) can be approximated by:
$$ \sigma_b = A \cdot e^{-B/t_d} $$
where \( A \) and \( B \) are material constants, and \( t_d \) is drying time. Adequate drying removes moisture and prevents cracks. For waterglass-based shells, hardening should be complete, and subsequent drying times controlled.
Firing Process: Firing removes residual wax and strengthens the shell. The firing cycle must achieve a temperature high enough to sinter the ceramic. The sintering kinetics can be described by:
$$ \frac{d\rho}{dt} = K \cdot \exp\left(-\frac{Q}{RT}\right) $$
where \( \rho \) is density, \( K \) is a constant, \( Q \) is activation energy, \( R \) is gas constant, and \( T \) is temperature. A fully fired shell should be white or light gray, indicating complete organic removal. Implementing these controls has markedly improved shell quality in the investment casting process, reducing defects like inclusions and surface irregularities.
Process Design Optimization
Process design in the investment casting process encompasses gating, risering, orientation, and geometric considerations. A well-designed process promotes directional solidification, minimizes turbulence, and reduces stress concentrations.
Gating System Design: The gating system must ensure smooth metal flow. The flow rate \( \dot{Q} \) can be calculated using Bernoulli’s principle:
$$ \dot{Q} = A \cdot \sqrt{2gh} $$
where \( A \) is cross-sectional area, \( g \) is gravity, and \( h \) is metal head height. To avoid jetting and aspiration, use tapered sprues and filters. Choke areas should be sized to control flow. Table 5 provides design guidelines for gating in the investment casting process.
| Design Element | Recommendation | Rationale |
|---|---|---|
| Sprue Base Area | 1.2-1.5 times total ingate area | Prevents aspiration, ensures pressure |
| Ingate Number | Multiple ingates for large parts | Distributes flow, reduces hot spots |
| Filter Usage | Ceramic filters in sprue or gating | Traps inclusions, promotes laminar flow |
| Riser Design | Riser volume = 20-30% of casting volume | Provides feed metal, reduces shrinkage |
Directional Solidification: To prevent shrinkage porosity, design the casting and risers to promote solidification from the farthest point toward the riser. The Chvorinov’s rule estimates solidification time \( t_s \):
$$ t_s = B \cdot \left( \frac{V}{A} \right)^2 $$
where \( B \) is a mold constant, \( V \) is volume, and \( A \) is surface area. Risers should have a higher \( V/A \) ratio than the casting to solidify last.
Geometric Considerations: Avoid sharp corners by using radii \( R \) of at least 1 mm to reduce stress concentrations and hot tearing. The stress concentration factor \( K_t \) for a corner is given by:
$$ K_t = 1 + 2\sqrt{\frac{a}{\rho}} $$
where \( a \) is crack length and \( \rho \) is radius. Larger radii reduce \( K_t \). Additionally, design walls with uniform thickness to prevent hot spots, and orient critical surfaces downward to minimize gas and inclusion entrapment. These design principles are integral to defect reduction in the investment casting process.
Conclusion
Defect control in the investment casting process is paramount for achieving high-quality castings and maintaining production efficiency. Through statistical analysis, I have identified that shell building, pouring process, and process design are the most influential stages contributing to defects. By implementing targeted controls—such as precise temperature monitoring, optimized slurry formulations, and robust gating designs—the incidence of defects can be significantly reduced. The investment casting process demands a holistic approach, where each parameter from pattern making to post-casting is meticulously managed. Emphasizing the key stages through rigorous process control, supported by formulas and data-driven decisions, leads to stable production and higher first-pass yield. Continuous improvement and adherence to these principles will further enhance the reliability and competitiveness of the investment casting process in manufacturing high-integrity components.