
1. Introduction and Research Context
In 2015, the global economic downturn cast a shadow over the foundry industry. Many casting enterprises faced severe operational difficulties, including mine. My company, primarily known for producing bolsters and side frames for railway freight cars, found its main product orders shrinking dramatically. The domestic market for medium and small rail components had almost completely halted. Facing existential pressure, our survival strategy hinged on expanding into international markets. We signed a development contract for the B10-type motor shell with a renowned overseas company. This component is critical for high-power diesel locomotives used in Europe and the Americas, with each locomotive requiring 12 units. The annual global demand was approximately 10,000 to 12,000 pieces, and competition was intense among the three global manufacturers. Winning a significant share, around 50%, was vital for our company’s survival and profitability.
Although we successfully passed the client’s certification in January 2016 and secured an initial small-batch order of 200 pieces, production between January and March 2016 was riddled with quality issues. Defects such as sand inclusion, cracks, gas porosity, and deformation led to an unacceptable scrap rate of 19%. The production cost was prohibitive, and even with securing the market order, we were facing substantial losses. Therefore, identifying the critical quality problems, analyzing the root causes, and implementing effective solutions became an urgent priority.
This research is not merely an academic exercise; it was a matter of corporate survival. Through a systematic defect analysis and process optimization of the **steel castings**, specifically the motor shell, I aimed to fundamentally improve product quality, reduce scrap rates, and lower production costs. The findings and methodologies from this study hold practical significance for similar types of **steel castings** in the industry.
2. Initial Manufacturing Process Analysis
2.1 Product Structure and Requirements
The B10 motor shell is a complex casting weighing approximately 381 kg. It features a cylindrical shape with varying wall thicknesses, ranging from a minimum of 19 mm to a maximum of 110 mm. The presence of numerous bosses on the outer surface and strengthening ribs and connecting webs on the inner surface creates multiple casting hot spots, significantly increasing the risk of hot tearing defects. The chemical composition requirements for the material are detailed in the table below.
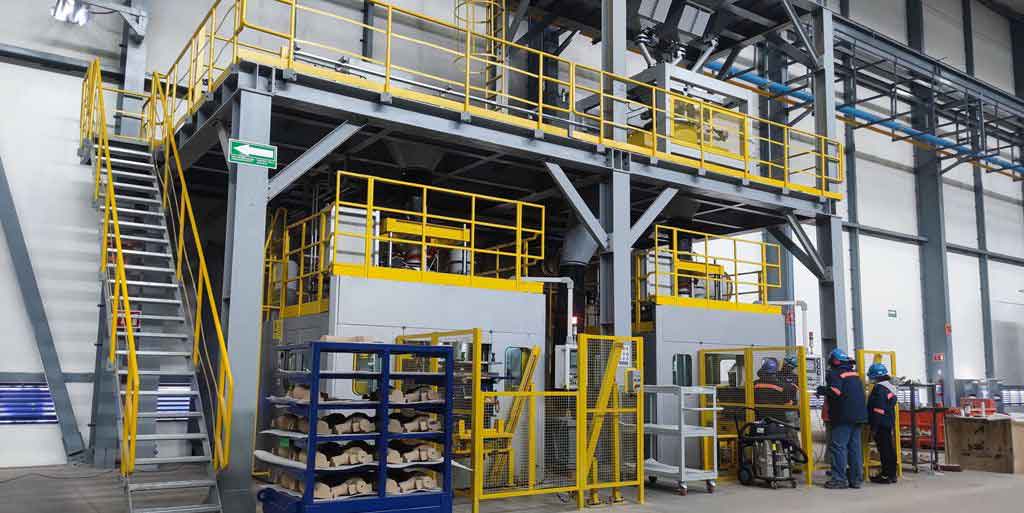
Table 2.1: Chemical Composition Requirements
| Element | C % | Si % | Mn % | P % | S % | Cu % |
| :— | :— | :— | :— | :— | :— | :— |
| **Range** | ≤0.30 | ≤0.60 | ≤0.70 | ≤0.040 | ≤0.040 | ≤0.30 |
The carbon equivalent must be maintained at CE ≤ 0.76, calculated using a standard formula:
$$ CE = C + \frac{1}{3}(Mn + Cr) + \frac{1}{6}(Si + Ni) + \frac{1}{2}Mo $$
Key mechanical properties included a tensile strength \( R_m \) ≥ 448 N/mm², yield strength \( R_{eL} \) ≥ 241 N/mm², elongation \( A \) ≥ 24%, and reduction of area \( Z \) ≥ 35%. The castings required a surface quality per ASTM 802 II and were subject to full fluorescent magnetic particle inspection (ASTM 709) for surface defects and ultrasonic testing (ASTM 609) for internal soundness in critical areas. The acceptance standard is strict: no cracks or sand inclusion defects are permitted.
2.2 Existing Production Process
The initial production line utilized the Furan resin sand process. The manufacturing process for the **steel castings** involved several critical steps: molding, core making, melting, pouring, heat treatment, and inspection. The process flow is summarized below.
Table 2.2: Primary Production Process Parameters
| Parameter | Specification |
| :— | :— |
| **Sand Process** | Furan Resin Self-Hardening Sand |
| **Resin Addition** | 0.9 – 1.2% |
| **Curing Agent** | Benzene Sulfonic Acid (20-30% of resin) |
| **Molding Process** | Top Gating System |
| **Melting Equipment** | 5-ton Electric Arc Furnace |
| **Pouring Temperature** | 1580 – 1590 °C |
| **Pouring Time** | 25 – 40 seconds per mold |
The casting process design (initial) is illustrated in the following diagram. The pattern was a top-gated system with 11 risers placed on the thick sections of the upper mold to facilitate feeding. Chills were used at various hot spots to promote directional solidification.
The Initial Casting Process Design
The production of these **steel castings** initially encountered severe quality issues, which were methodically analyzed.
3. Defect Analysis of Steel Castings
3.1 Crack Defects
Between January and March 2016, all 200 motor shells produced exhibited crack defects. This was the most significant problem, contributing to a 15% scrap rate alone. The cracks were identified as hot tears, which form during solidification when the strain imposed on the solidifying metal exceeds its ductility.
The formation mechanisms for hot tears can be complex. The crack distribution and morphology were analyzed to determine root cause. Cracks were observed in a variety of locations:
Figure 3.1: Crack Distribution on Motor Shells
– External Surface: 10-13 cracks.
– Internal Surface (Core 1): ~17 cracks.
– Internal Surface (Core 2): 30-40 cracks, exhibiting irregular shapes and difficult to repair.
The cracks were further classified into “shrinkage cracks” and “stress cracks” after analyzing their macro and micro morphologies. The analysis of the **steel castings** revealed that the majority were classic hot tears. I identified several contributing factors.
3.2 Root Causes of Cracks
1. Casting Structure Complexity
The motor shell’s design is inherently susceptible to cracking. The large variations in wall thickness (from 25 mm to 80 mm), coupled with multiple sharp corners and a high number of hot spots, created significant stress concentrations during solidification. These structural features acted as initiation points for cracks in the **steel castings**.
2. Material Composition
The chemical composition control was not optimal for crack resistance. The element content, particularly sulfur and carbon, plays a crucial role in hot tearing susceptibility. The effects of various elements on hot tear resistance in carbon **steel castings** are well-documented.
Table 3.1: Influence of Alloying Elements on Hot Tearing
| Element | Effect on Crack Resistance | Optimal Range for Crack Resistance |
| :— | :— | :— |
| **Carbon (C)** | Increases resistance up to ~0.25%, then decreases | 0.20 – 0.25% |
| **Silicon (Si)** | Increases resistance up to 0.45% | 0.25 – 0.45% |
| **Manganese (Mn)** | Increases resistance up to 0.90% | 0.60 – 0.68% |
| **Phosphorus (P)** | Decreases resistance | As low as possible (≤0.02%) |
| **Sulfur (S)** | Most detrimental; decreases resistance exponentially | As low as possible (≤0.015%) |
3. Furan Resin Sand Properties
The intrinsic properties of the Furan resin sand were found to be highly problematic for this type of **steel castings**.
– Poor Hot Collapsibility: At high temperatures, the Furan resin forms a rigid carbonaceous skeleton. This creates a hard, unyielding mold that severely hinders the natural contraction of the solidifying and cooling casting, leading to high internal stresses and, ultimately, hot tears.
– High Thermal Expansion: The thermal expansion of Furan sand is significantly higher than that of other sands, which increases the resistance to casting contraction.
– Sulfur Pickup: Curing agents, such as benzene sulfonic acid, decompose at high temperatures to release sulfur-rich gases. These gases react with the surface of the **steel castings**, forming low-melting-point iron sulfides (FeS). These sulfides segregate to the grain boundaries, weakening the material and making it more susceptible to cracking.
The high-temperature stress-strain behavior of Furan resin sand can be characterized by its poor deformability compared to other sand systems. The time-to-fracture under stress was approximately 120 seconds, compared to just a few seconds for water glass sand.
4. Casting Process Design
The original top-gated casting process contributed to the problem. The high pouring temperature and concentrated heat input at the ingates created a severe temperature gradient. The riser design also proved insufficient for effective feeding, causing unsoundness and shrinkage stress concentrations.
3.3 Sand Inclusion Defects
Sand inclusion was the second most common defect, affecting 50% of the castings and contributing a 4% scrap rate. This was characterized as a dispersion of sand particles embedded in the casting surface, particularly on internal machined surfaces. The primary causes were identified as:
– Inadequate Gating System Design: The top gating system resulted in a long free-fall for the molten steel (over 600 mm), creating a high-velocity stream that impinged directly on the mold bottom. This impact pressure exceeded the mold’s strength, leading to erosion and subsequent sand entrapment in the **steel castings**.
– Localized Low Mold Strength: In several areas, the mold and core strength was insufficient due to poor ramming around chills, leading to sand washout and inclusions.
4. Optimization of Casting Process for Steel Castings
Addressing the identified root causes required a multi-faceted approach to optimize the entire manufacturing process for the **steel castings**.
4.1 Molding Sand Process Optimization
The core solution to the cracking problem was to replace the Furan resin sand with a more collapsible and less harmful binder system. After a detailed comparison of available technologies, I selected the Alkaline Phenolic Resin Self-Hardening Sand process.
Table 4.1: Comparison of Molding Sand Processes
| Property | Furan Resin Sand | Alkaline Phenolic Resin Sand |
| :— | :— | :— |
| **Nitrogen, Sulfur, Phosphorus** | Contains them, causing defects | Free from these harmful elements |
| **Hot Collapsibility** | Poor, rigid at high temperature | Excellent, better deformability |
| **Thermal Expansion** | High, leading to stress | Low, reduced stress |
| **Environmental Impact** | Releases harmful gases (SO2, H2S) | Low emissions, more environmentally friendly |
| **Casting Finish & Accuracy** | Good | Good |
| **Cost** | Lower binder cost | Higher binder consumption per ton of sand |
The original sand reclamation system was specifically designed for Furan sand. It was replaced and recommissioned for the Alkaline Phenolic resin sand process. The key process parameters for the new process were established through trials.
Table 4.2: Optimized Alkaline Phenolic Resin Sand Parameters
| Parameter | Specification |
| :— | :— |
| **Resin Addition (New Sand)** | 1.5 – 1.8% |
| **Ester Curing Agent** | 20 – 25% of resin weight |
| **Stripping Strength** | 0.25 – 0.30 MPa |
| **24h Compressive Strength** | 0.3 – 0.7 MPa |
| **Mold Making Process** | 25% New Sand + 75% Reclaimed Sand |
The trials confirmed that this new sand system significantly improved the problem. The count of cracks on the **steel castings** dropped from an average of 70 to 30, a reduction of over 60%. Furthermore, the surfaces of the **steel castings** were free from sulfur contamination, which further improved their resistance to hot tearing. The new binder system also demonstrated superior breakdown and collapsibility after pouring, easing the knockout process.
Figure 4.1: New Alkaline Phenolic Resin Sand Reclamation System
4.2 Casting Structure Optimization
To further reduce stress concentrations, I collaborated with the product design engineers to optimize the casting structure. The initial design had fillets with a radius of R6.35 mm at the junction of the strengthening ribs and the inner cylindrical surface. These sharp fillets were major stress raisers. After confirming with the engineering team that a larger radius would not impact assembly or performance, the fillets were increased to R25.4 mm. This change promoted better metal flow and reduced the risk of hot tears in these critical areas of the **steel castings**.
4.3 Casting Process Scheme Optimization
1. Gating System Redesign
The top-gated system was completely redesigned as a bottom-gated system. This change was critical in reducing both erosion and thermal stress.
Table 4.3: Comparison of Gating System Designs
| Feature | Top Gating System (Original) | Bottom Gating System (Optimized) |
| :— | :— | :— |
| **Metal Flow** | Turbulent, high fall height | Smooth, controlled fill |
| **Mold Erosion** | High, significant erosion at base | Low, gentle fill |
| **Temperature Gradient** | High, localized hot spots | More uniform temperature distribution |
| **Feeding Pressure** | Good at top | Good with proper riser design |
The new design is illustrated below. The system uses a ceramic pouring cup and a 80mm diameter ceramic sprue. The cross-riser is built with a combination of ceramic tiles and “Yu Zhu” sand to prevent sand erosion at the ingates.
The Optimized Bottom Gating System
2. Riser Design Improvements
The risers were redesigned to improve feeding efficiency. They were changed from standard exothermic risers to high-performance, insulating exothermic risers. The diameter was increased from 100mm to 110mm. This change improved the temperature gradient, ensuring a longer liquid path for effective feeding of the solidifying **steel castings**.
3. Core Design Optimization
The core designs were also revised to address both crack and sand inclusion issues. A key change was the use of chromite sand in certain applications. Chromite sand has a higher thermal conductivity than silica sand, providing a chilling effect, but it is less severe than a chill. This helps to create a more gradual solidification profile.
For example, Core No. 1 originally used four separate chills, which created localized hot spots at the chill edges and led to cracking. The design was changed to use a 30mm thick layer of chromite sand around the circumference of the core. This provided a more uniform chilling effect without inducing thermal shock.
Table 4.4: Core Design Modifications
| Core ID | Original Design | Optimized Design | Purpose |
| :— | :— | :— | :— |
| **Core No. 1** | Furan sand with chills | Chromite sand layer | Reduce thermal shock |
| **Core No. 2** | Furan sand without chills | Furan sand with 7 contoured chills | Promote directional solidification |
| **Core No. 7** | Furan sand with round chills | Furan sand with matching contoured chills | Improve compaction, reduce sand erosion |
The modification to Core No. 7 was significant for sand inclusion. The original cylindrical chills were replaced with contoured chills that matched the local geometry, ensuring adequate sand compaction and strength at the mold-metal interface, preventing the wash-out that was a source of inclusions.
4. Pouring Process Optimization
The pouring process itself was optimized to minimize defects. The key changes are summarized in the table below.
Table 4.5: Optimized Pouring Process Parameters
| Parameter | Original Value | Optimized Value | Rationale |
| :— | :— | :— | :— |
| **Pouring Temperature** | 1580-1590 °C | 1550-1565 °C | Reduce thermal stress and hot tearing |
| **Pouring Time** | 25-40 s | 25-30 s | Faster fill to reduce shell cooling |
| **Ladle Height** | Not specified | 200-300 mm | Reduce impact pressure and erosion |
| **Casting Nozzle Diameter** | 40 mm | 60 mm | Control flow rate for smooth fill |
| **Pouring Technique** | Consistent pour | Slow-fast-slow with padding | Prevent aspiration and promote feeding |
These process controls were implemented to ensure a gentle, controlled filling of the mold, which is critical for producing high-quality **steel castings**.
4.4 Chemical Composition Optimization and Control
Given the strong influence of chemistry on hot tearing, the melting and refining processes were rigorously controlled. The internal control targets for chemical composition were tightened, as shown below.
Table 4.6: Optimized Chemical Composition Control Targets
| Element | Previous Control Range | Optimized Control Range |
| :— | :— | :— |
| **C** | 0.10 – 0.28% | 0.20 – 0.25% |
| **Si** | 0.20 – 0.45% | 0.25 – 0.45% |
| **Mn** | 0.30 – 0.68% | 0.60 – 0.68% |
| **P** | ≤0.035% | ≤0.020% |
| **S** | ≤0.035% | ≤0.015% |
The optimized targets were selected based on their known impact on crack resistance. Specifically, I correlated the sulfur content in the molten steel with the number of crack defects found in previous production batches.
Table 4.7: Relationship between Sulfur Content and Cracks
| Sulfur Content (%) | Average Number of Cracks |
| :— | :— |
| 0.030 – 0.035 | 61 – 80 |
| 0.025 – 0.030 | 50 – 60 |
| 0.018 – 0.020 | 45 – 54 |
| 0.009 – 0.015 | 30 – 45 |
This clear correlation justified the strict control of sulfur to ≤0.015% to minimize hot tearing in the **steel castings**. The melting process was adjusted to ensure these targets were met, focusing on meticulous control of the oxidizing and reducing periods in the arc furnace.
Figure 4.2: The Process of Molten Steel Smelting
5. Production Practice and Results
The comprehensive optimization of the process, from raw materials to pouring practices, was implemented in full-scale production from April to December 2016. The results were dramatic and highly positive for the overall quality of the **steel castings**.
5.1 Quality Improvement
The most notable achievement was the significant reduction in the two major defects.
Figure 5.1: Crack Number Contrast Figure Before and After Improvement
– Before Optimization: An average of 70 cracks per casting, including 10 open cracks with depths up to 15mm.
– After Optimization: An average of only 10 cracks per casting, and no open cracks. The max detected crack depth was only 5mm. The reduction in surface cracks alone was more than 90% for the **steel castings**.
Figure 5.2: Sand Inclusion Number Contrast Figure Before and After Improvement
– Before Optimization: An average of 80 sand inclusion spots per casting.
– After Optimization: An average of 20 sand inclusion spots per casting, with no inclusion exceeding 3mm in diameter. The distribution was also less severe.
The improved quality of the **steel castings** is evident in both crack and sand inclusion statistics.
5.2 Scrap Rate Reduction
The combined effect of these improvements was a dramatic reduction in the scrap rate.
Figure 5.3: The Rejection Rate Contrast Figure Before and After Improvement
– Before Optimization: Total scrap rate was 19.0% (38 pieces from 200).
– After Optimization: Total scrap rate was 1.1% (31 pieces from 2800).
This reduction was crucial for the long-term viability of the product. The improvement was reflected in all categories of scrap causes, as detailed below.
Table 5.1: Scrap and Defect Rate Comparison
| Defect Type | Before Optimization (%) | After Optimization (%) |
| :— | :— | :— |
| **Cracks** | 15.0 | 0.5 |
| **Sand Inclusion** | 4.0 | 0.25 |
| **Pouring Defects** | – | 0.18 |
| **Others** | – | 0.29 |
5.3 Work-in-Progress and Delivery Time
Prior to optimization, the high defect rate caused a bottleneck in the repair and machining stages of the **steel castings**. Extensive rework, repeated inspections, and tool breakages due to sand inclusions caused significant delays. This led to a large amount of work-in-progress (WIP) inventory, causing storage issues, tying up capital, and increasing labor costs.
After optimization, the production flow was far more balanced. The work-in-progress decreased significantly, from a high of 150 castings to just 10. This streamlined production flow allowed the company to consistently meet delivery schedules. Monthly production output increased from a maximum of 160 units to 450 units, and from June to December 2016, no shipments were delayed.
5.4 Quality Safety Risk and Feedback
All castings are prone to some surface and internal defects. Given that about half of the motor shell’s surface is machined after delivery, any near-surface defect can become exposed. In the initial production period from January to March, the risk was high, resulting in a high rejection rate from the client. The initial feedback rate was 6.25% (10 pieces out of 160). Worse, one casting that was assembled was later found to have severe cracks during final machining and had to be scrapped at a significant cost. The failure of such a critical component in service could have had catastrophic consequences.
After the process optimization, the incidence of exposed defects decreased dramatically. From April to December, out of 2760 castings delivered, 37 were returned due to exposed defects. However, all of these were within repairable limits, and none were scrapped. The quality feedback rate dropped to 1.34%, which was below the target of 2%.
5.5 Cost Analysis
1. Material Cost
The switch from Furan to Alkaline Phenolic resin increased the molding material cost per ton of finished castings. This is largely due to the higher resin addition rate and the need for a higher proportion of new sand.
Figure 5.4: The Loss Cost of Each Barrel
Table 5.2: Molding Material Cost Comparison per Ton of Castings
| Material | Furan Resin Process (Yuan) | Alkaline Phenolic Process (Yuan) |
| :— | :— | :— |
| **New Sand** | 160 | 400 |
| **Reclaimed Sand** | 540 | 540 |
| **Resin + Curing Agent** | 787 | 812 |
| **Total Cost** | **1487** | **1752** |
The new process adds an extra 265 Yuan per ton of castings in material costs.
2. Welding and Repair Cost
The improved overall quality of the **steel castings** significantly reduced the need for welding repairs.
Table 5.3: Average Welding Repair Cost per Casting
| Cost Component | Before Optimization (Yuan) | After Optimization (Yuan) |
| :— | :— | :— |
| **Welding Materials** | 25 | 5 |
| **Grinding Tools** | 21 | 4 |
| **Labor** | 380 | 200 |
| **Other** | 60 | 51 |
| **Total Cost** | **486** | **260** |
This resulted in a saving of 226 Yuan per casting in repair costs alone.
3. Total Quality Loss Cost
The total quality loss, which includes scrapped parts and compensation to the customer, was reduced substantially.
Table 5.4: Total Quality Loss Cost Comparison
| Item | Before Optimization (Yuan) | After Optimization (Yuan) |
| :— | :— | :— |
| **Total Production (pieces)** | 200 | 2800 |
| **Production Loss (scrap)** | 210,000 | 220,000 |
| **Customer Compensation Loss** | 110,000 | 25,000 |
| **Total Quality Loss** | 320,000 | 245,000 |
| **Loss per Casting** | **2000** | **88** |
Despite the higher molding material cost, the enormous savings in repair, rework, scrap, and customer returns resulted in a substantial net cost reduction. The quality loss cost per casting dropped from 2000 Yuan to just 88 Yuan.
6. Conclusion and Future Work
This research successfully addressed the critical quality issues in the production of B10 motor shell, which are complex **steel castings**. The systematic approach of defect analysis followed by targeted process optimization proved highly effective.
The key conclusions from this study are:
1. The use of Furan resin sand was a primary cause of hot cracking in these **steel castings**. Its poor high-temperature collapsibility restricted the natural contraction of the casting, leading to high stresses and crack formation. Replacing it with Alkaline Phenolic resin sand significantly mitigated this issue.
2. The casting structure played a significant role in crack susceptibility. Optimizing fillet radii and adding chills to manage solidification reduced the stress concentrations and improved feeding.
3. The adoption of a bottom-gated casting system, with proper ceramic components, minimized mold erosion and was critical in reducing sand inclusion defects.
4. Stringent control of the chemical composition of the steel, particularly lowering the sulfur content to very low levels, was essential for improving the inherent crack resistance of the material.
5. The holistic optimization of the process resulted in a substantial improvement in quality, reducing the scrap rate from 19% to 1.1%, lowering costs, and enabling on-time delivery, thus securing the company’s competitive position.
While the optimized process has been successfully implemented, there are areas for future research and improvement:
– The reclamation rate and quality of the Alkaline Phenolic resin sand require further optimization. The lower reclamation rate increases the cost and environmental impact of the new process. Further research into improved reclamation technologies is necessary.
– Although the optimized process has drastically reduced defects, it has not completely eliminated them. A minority of **steel castings** still exhibit minor cracks or sand inclusion. Further refinement of the casting process parameters, such as the use of advanced simulation software to predict solidification and defects, could help in achieving even higher quality standards.