

For the steel with determined composition, the relationship curve between transformation amount and time during the continuous cooling transformation of undercooled austenite is called CCT curve. In order to formulate reasonable and feasible heat treatment process parameters for the experimental steel and obtain the expected properties and microstructure, drawing the CCT curve is a key means. Under the industrial process conditions of continuous cooling transformation of experimental steel, CCT curve is more instructive than isothermal transformation curve (TTT curve), which can directly show the changes of phase transformation products, phase transformation temperature and hardness of undercooled austenite at different cooling rates. According to the CCT curve, we can understand all the phase transformation types of steel, design the target structure, and determine the appropriate quenching medium by formulating the corresponding cooling rate. And reasonable heat treatment process. Similarly, the expansion method is used to realize the determined cooling rate by dil805 expander. The CCT thermal expansion test process of experimental steel is shown in Figure 1. Each sample is heated to 1000 ° C at the rate of 1 ° C / s during heating, and cooled to room temperature at different cooling rates after holding for 10 minutes.


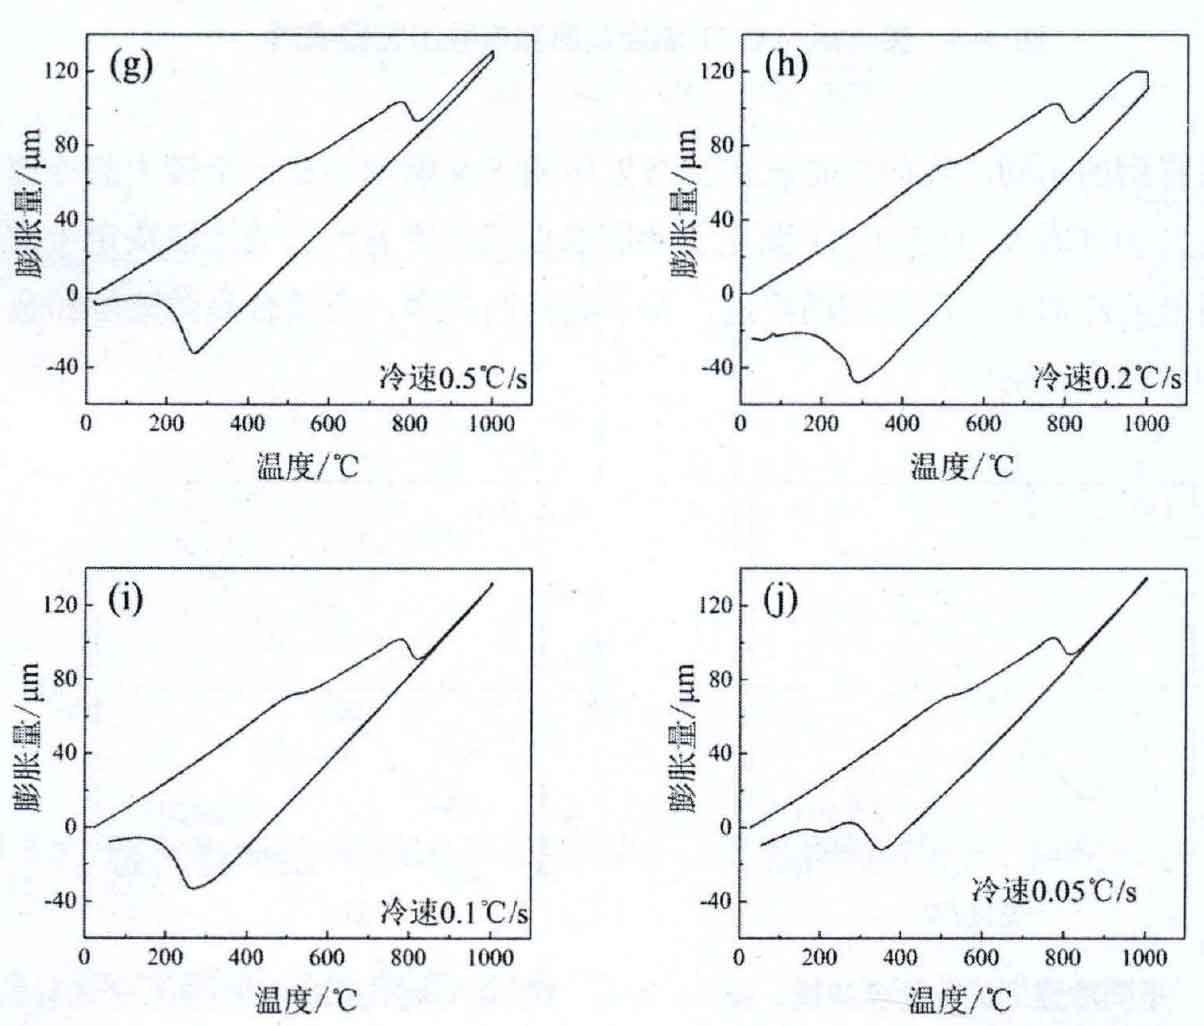
The thermal expansion test results of the sample steel at different cooling rates are shown in Figure 2. The thermal expansion curve is measured in a large cooling rate range (40 ° C / s to 0.05 ° C / s). The selection of the cooling rate range depends on the cooling rate corresponding to the possible cooling mode of the experimental steel. The type of phase should be determined in combination with the results of microhardness and metallographic structure.


The bottom surface of the thermal expansion sample is mechanically polished and its microhardness is measured. The samples are inlaid, polished and eroded, and the metallographic structure photos and microhardness results are given in Fig. 5-6. It can be seen from Fig. 3 that the microhardness value of the sample decreases monotonically with the decrease of cooling rate. It can be seen from Fig. 3a-c that when the cooling rate is above 10 ° C / s, the microstructure of the experimental steel is fine black strip. Its microhardness is very high, above 593hv, so it is judged as martensite + retained austenite; At the cooling rate between 5 ° C / s and 0.5 ° C / s shown in Fig. 3d-g, large and flat bainite laths appear in the microstructure. The microhardness also decreased slightly from 590hv to 570hv, which means that bainite Martian multiphase structure + retained austenite was obtained within this cooling rate range, but the bainite content was not enough to form an inflection point on the thermal expansion curve; In Fig. 3h-j, the cooling rate is 0.2 ° C / s to 0.05 ° C / s. at this time, the microhardness decreases step by step, decreases below 550hv, and finally reaches 531hv. In terms of microstructure and morphology, especially in Fig. 3I and j, the lath size increases significantly and the typical morphology of bainite increases. On the thermal expansion curves of the three cooling rates, the inflection point of bainite transformation also appears, especially in Fig. 3j. Therefore, within this cooling rate range, the experimental steel still shows bainite Martian duplex structure + retained austenite, but the bainite content increases significantly