
In order to study the action mechanism of silicon element on high silicon ductile iron, the microhardness of ferrite matrix of ductile iron samples with different silicon content was measured, the element distribution was observed by scanning electron microscope, and the change of ferrite lattice constant was analyzed by X-ray diffraction.


Figure 1 shows the Fe Si phase diagram under equilibrium conditions, in which Figure 1 (b) shows the local amplification of Figure 1 (a) when the silicon content is between 0% and 10%. It can be seen that, in the range of 2.9% to 4.6% silicon content, with the progress of solidification process, there is only body centered cubic lattice in the crystal structure, only ferrite phase exists, silicon exists in the form of silicon atoms, and silicon can be completely dissolved in ferrite. The atomic radius of silicon atom is 0.118 nm, and the ferrite is dissolved in carbon α- For interstitial solid solution in Fe, the maximum lattice gap is 0.633R, i.e. 0.0766 nm, where R is the atomic radius of iron, and the radius of silicon atom is larger than the lattice gap of ferrite, so interstitial solid solution cannot be formed; The atomic radius of iron is 0.121 nm, which is larger than that of silicon. Therefore, silicon can dissolve in ferrite matrix to form replacement solid solution. When the silicon content exceeds 9.5%, with the increase of silicon content, the ferrite phase becomes FeSi phase, and then becomes Fe3Si phase.
| Sample No ω (Si) (%) | Ferrite microhardness (HV) | Average value (HV) |
| A(2.92) | 180.88、187.47、188.17、187.48、186.79 | 186.16 |
| B(3.68) | 230.59、223.68、211.63、222.72、227.58 | 223.24 |
| C(4.22) | 237.59、244.34、230.51、229.08、249.87 | 238.28 |
| D(4.59) | 244.62、245.65、266.16、259.36、249.78 | 253.17 |
Table 1 shows the ferrite microhardness of high silicon ductile iron with different silicon content. It can be seen that the average ferrite hardness of QT450-10 ductile iron with 2.92% silicon content is 186.16 HV. When the silicon content is 4.59%, the average ferrite hardness of high silicon ductile iron is 253.17 HV, with high microhardness; With the increase of silicon content, the microhardness of ferrite in ductile iron gradually increases, which indirectly proves that the solid solution strengthening effect of silicon on ferrite matrix is enhanced. The hardness values at different positions with the same silicon content have deviation, which indicates that segregation occurs when silicon is dissolved in ferrite matrix.
The samples of high silicon nodular cast iron with different silicon content are spot scanned with the energy spectrometer of scanning electron microscope, and the energy spectrum diagram is drawn at selected points in the ferrite crystal and grain boundary, as shown in Figure 2; Spectra 1 and 3 show the sampling points at ferrite grain boundary of QT450-10 ductile iron with 2.92% silicon content, Spectra 2 and 4 show the sampling points within ferrite grain, Spectra 5 and 7 show the sampling points at ferrite grain boundary of high silicon ductile iron with 4.59% silicon content, and Spectra 6 and 8 show the sampling points within ferrite grain.


The value of Si element at each point in Figure 2 is calculated by the formula to obtain the segregation index value of Si element and the mass percentage content of other elements, as shown in Table 2;
| Fe | C | Si | K(Si) | |
| Spectrum 1 | 82.79 | 15.11 | 2.10 | 0.72 |
| Spectrum 2 | 76.32 | 20.74 | 2.94 | 1.01 |
| Spectrum 3 | 79.04 | 18.96 | 2.00 | 0.68 |
| Spectrum 4 | 76.41 | 20.56 | 3.04 | 1.04 |
| Spectrum 5 | 69.87 | 25.00 | 5.13 | 1.12 |
| Spectrum 6 | 74.54 | 21.66 | 3.80 | 0.83 |
| Spectrum 7 | 73.42 | 21.56 | 5.02 | 1.09 |
| Spectrum 8 | 74.95 | 20.86 | 4.18 | 0.91 |
Where:
KSi – segregation index value of Si element;
WSi — silicon content at the sampling point;
WSi0 — average content of silicon in ductile iron.
It can be seen from Table 2 that for QT450-10 ductile iron with 2.92% silicon content, the segregation index values of silicon element at ferrite grain boundary are 0.72 and 0.68 respectively, and 1.01 and 1.04 in grains; When the silicon content is 4.59%, the segregation index values of silicon element on the ferrite grain boundary of high silicon ductile iron are 1.12 and 1.09, respectively, and 0.83 and 0.91 in the grain; The silicon element can not only be completely dissolved in the ferrite matrix, but also segregate in the grain when the silicon content is 2.92%, and segregate on the grain boundary when the silicon content is 4.59%. With the increase of silicon element, the amount of silicon solid solution in ferrite grains increases. At the same time, the degree of segregation of silicon element on ferrite grain boundaries increases, which increases the lattice distortion of ferrite, improves the strength and hardness of high silicon ductile iron, and decreases the plasticity and toughness. However, because the graphite morphology of high silicon ductile iron is fine and uniform, and the matrix structure is all ferrite, the elongation decline is small, and the macro performance is basically unchanged.
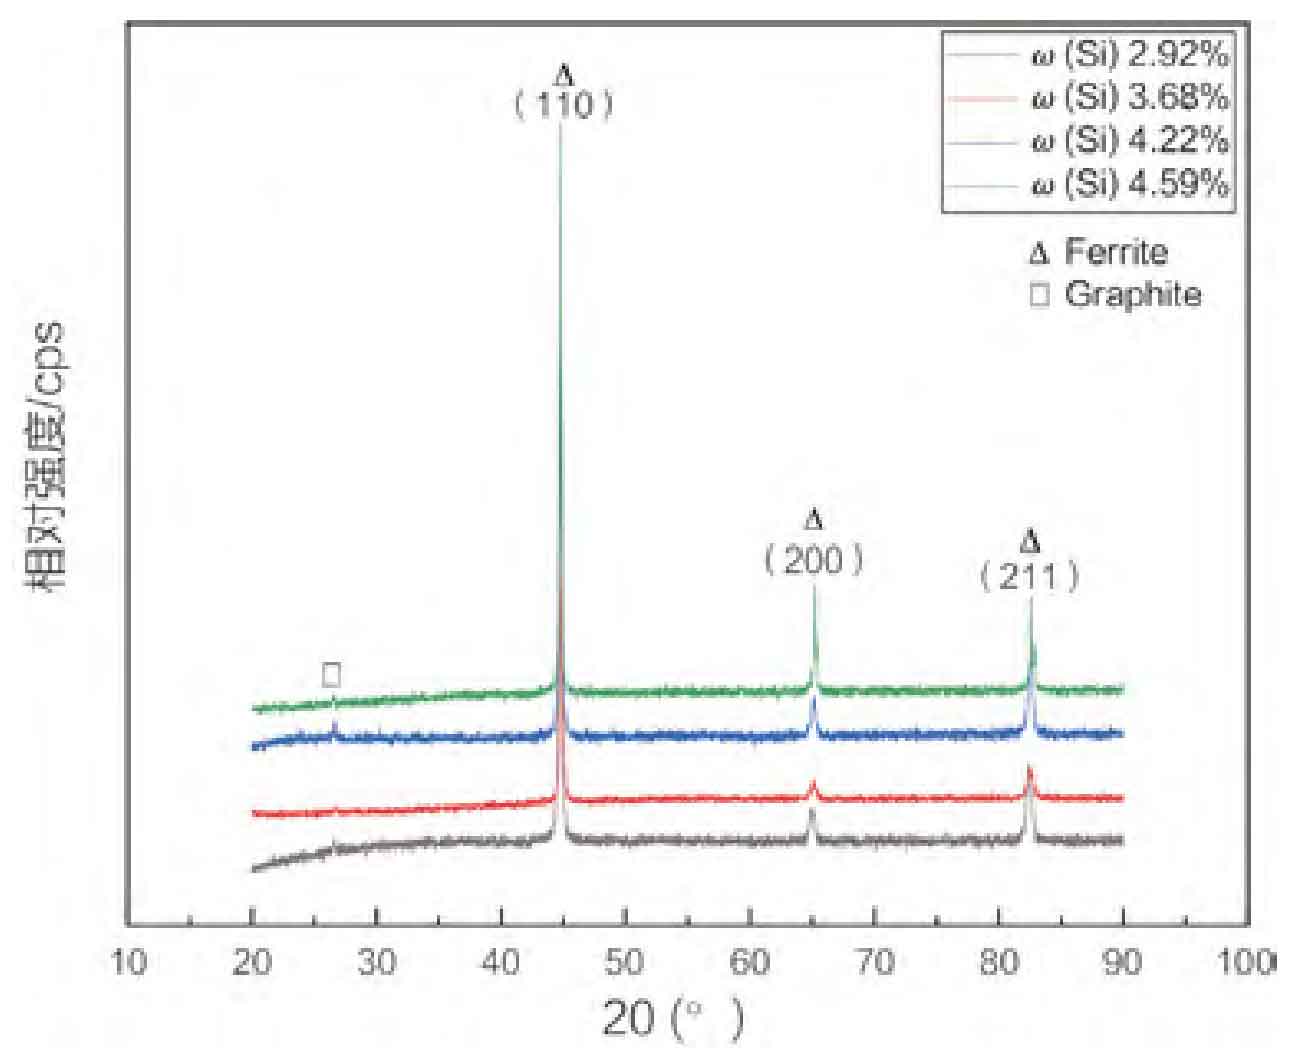
The X-ray diffraction patterns of nodular cast iron with different silicon content are analyzed with jade 6 software, as shown in Figure 3. It can be seen that there are three peaks in the pattern. After the existing Fe, C, and Si elements are input, the peak is searched. Only the ferrite phase corresponds to it, indicating that silicon is dissolved in ferrite. The peak between 20 ° and 30 ° is graphite phase. By comparison with the PDF card, the crystal plane indexes of the three peaks of ferrite phase are (110) (200), (211), the peak crystal face index of the atlas of ductile iron samples with different silicon content remains unchanged.
It is known that ferrite is a body centered cubic structure. Since the crystal plane index h+k+l is even, the formula for calculating the crystal plane spacing of cubic crystal system is:
Where d is the crystal plane spacing and a is the lattice constant. The ferrite lattice constant of ductile iron with different silicon content is calculated, and the results are shown in Table 3. When the silicon content is 2.92%, the maximum ferrite lattice constant is 0.286 47 nm; When the silicon content is up to 4.59%, the minimum ferrite lattice constant is 0.286 02 nm. The ferrite lattice constant of pure iron is 0.286 64 nm. It is calculated that when the silicon content is 2.92%, the minimum distortion degree is 0.06%, and when the silicon content is 4.59%, the maximum distortion degree is 0.22%. With the increase of silicon content, the ferrite lattice constant gradually decreases, and the ferrite lattice distortion degree increases, which increases the dislocation resistance, thus improving the strength and hardness of ferrite.
| ω (Si) (%) | a (110)/nm | a (200)/nm | a (211)/nm | a (AVG)/nm | Distortion (%) |
| 2.92 | 0.286 28 | 0.286 55 | 0.286 59 | 0.286 47 | 0.06 |
| 3,68 | 0.286 42 | 0.286 12 | 0.286 20 | 0.286 25 | 0.14 |
| 4.22 | 0.286 07 | 0.286 38 | 0.286 08 | 0.286 18 | 0.16 |
| 4.59 | 0.286 06 | 0.286 00 | 0.286 00 | 0.286 02 | 0.22 |