
In my research on grey iron castings, particularly for critical components like cylinder heads in diesel engines, I have extensively investigated how the proportion of various furnace charges influences the microstructure and mechanical properties. Grey iron castings are widely used in automotive and industrial applications due to their excellent castability, damping capacity, and cost-effectiveness. However, achieving consistent high performance in grey iron castings, such as those required for high-pressure engine parts, demands precise control over melting practices and charge materials. This article delves into my experimental findings on the impact of charge ratios—including returns, pig iron, and start-up blocks—on the graphite morphology, matrix structure, tensile strength, and hardness of grey iron castings. The hereditary effects of charge materials are a key focus, as they significantly dictate the final quality of grey iron castings.
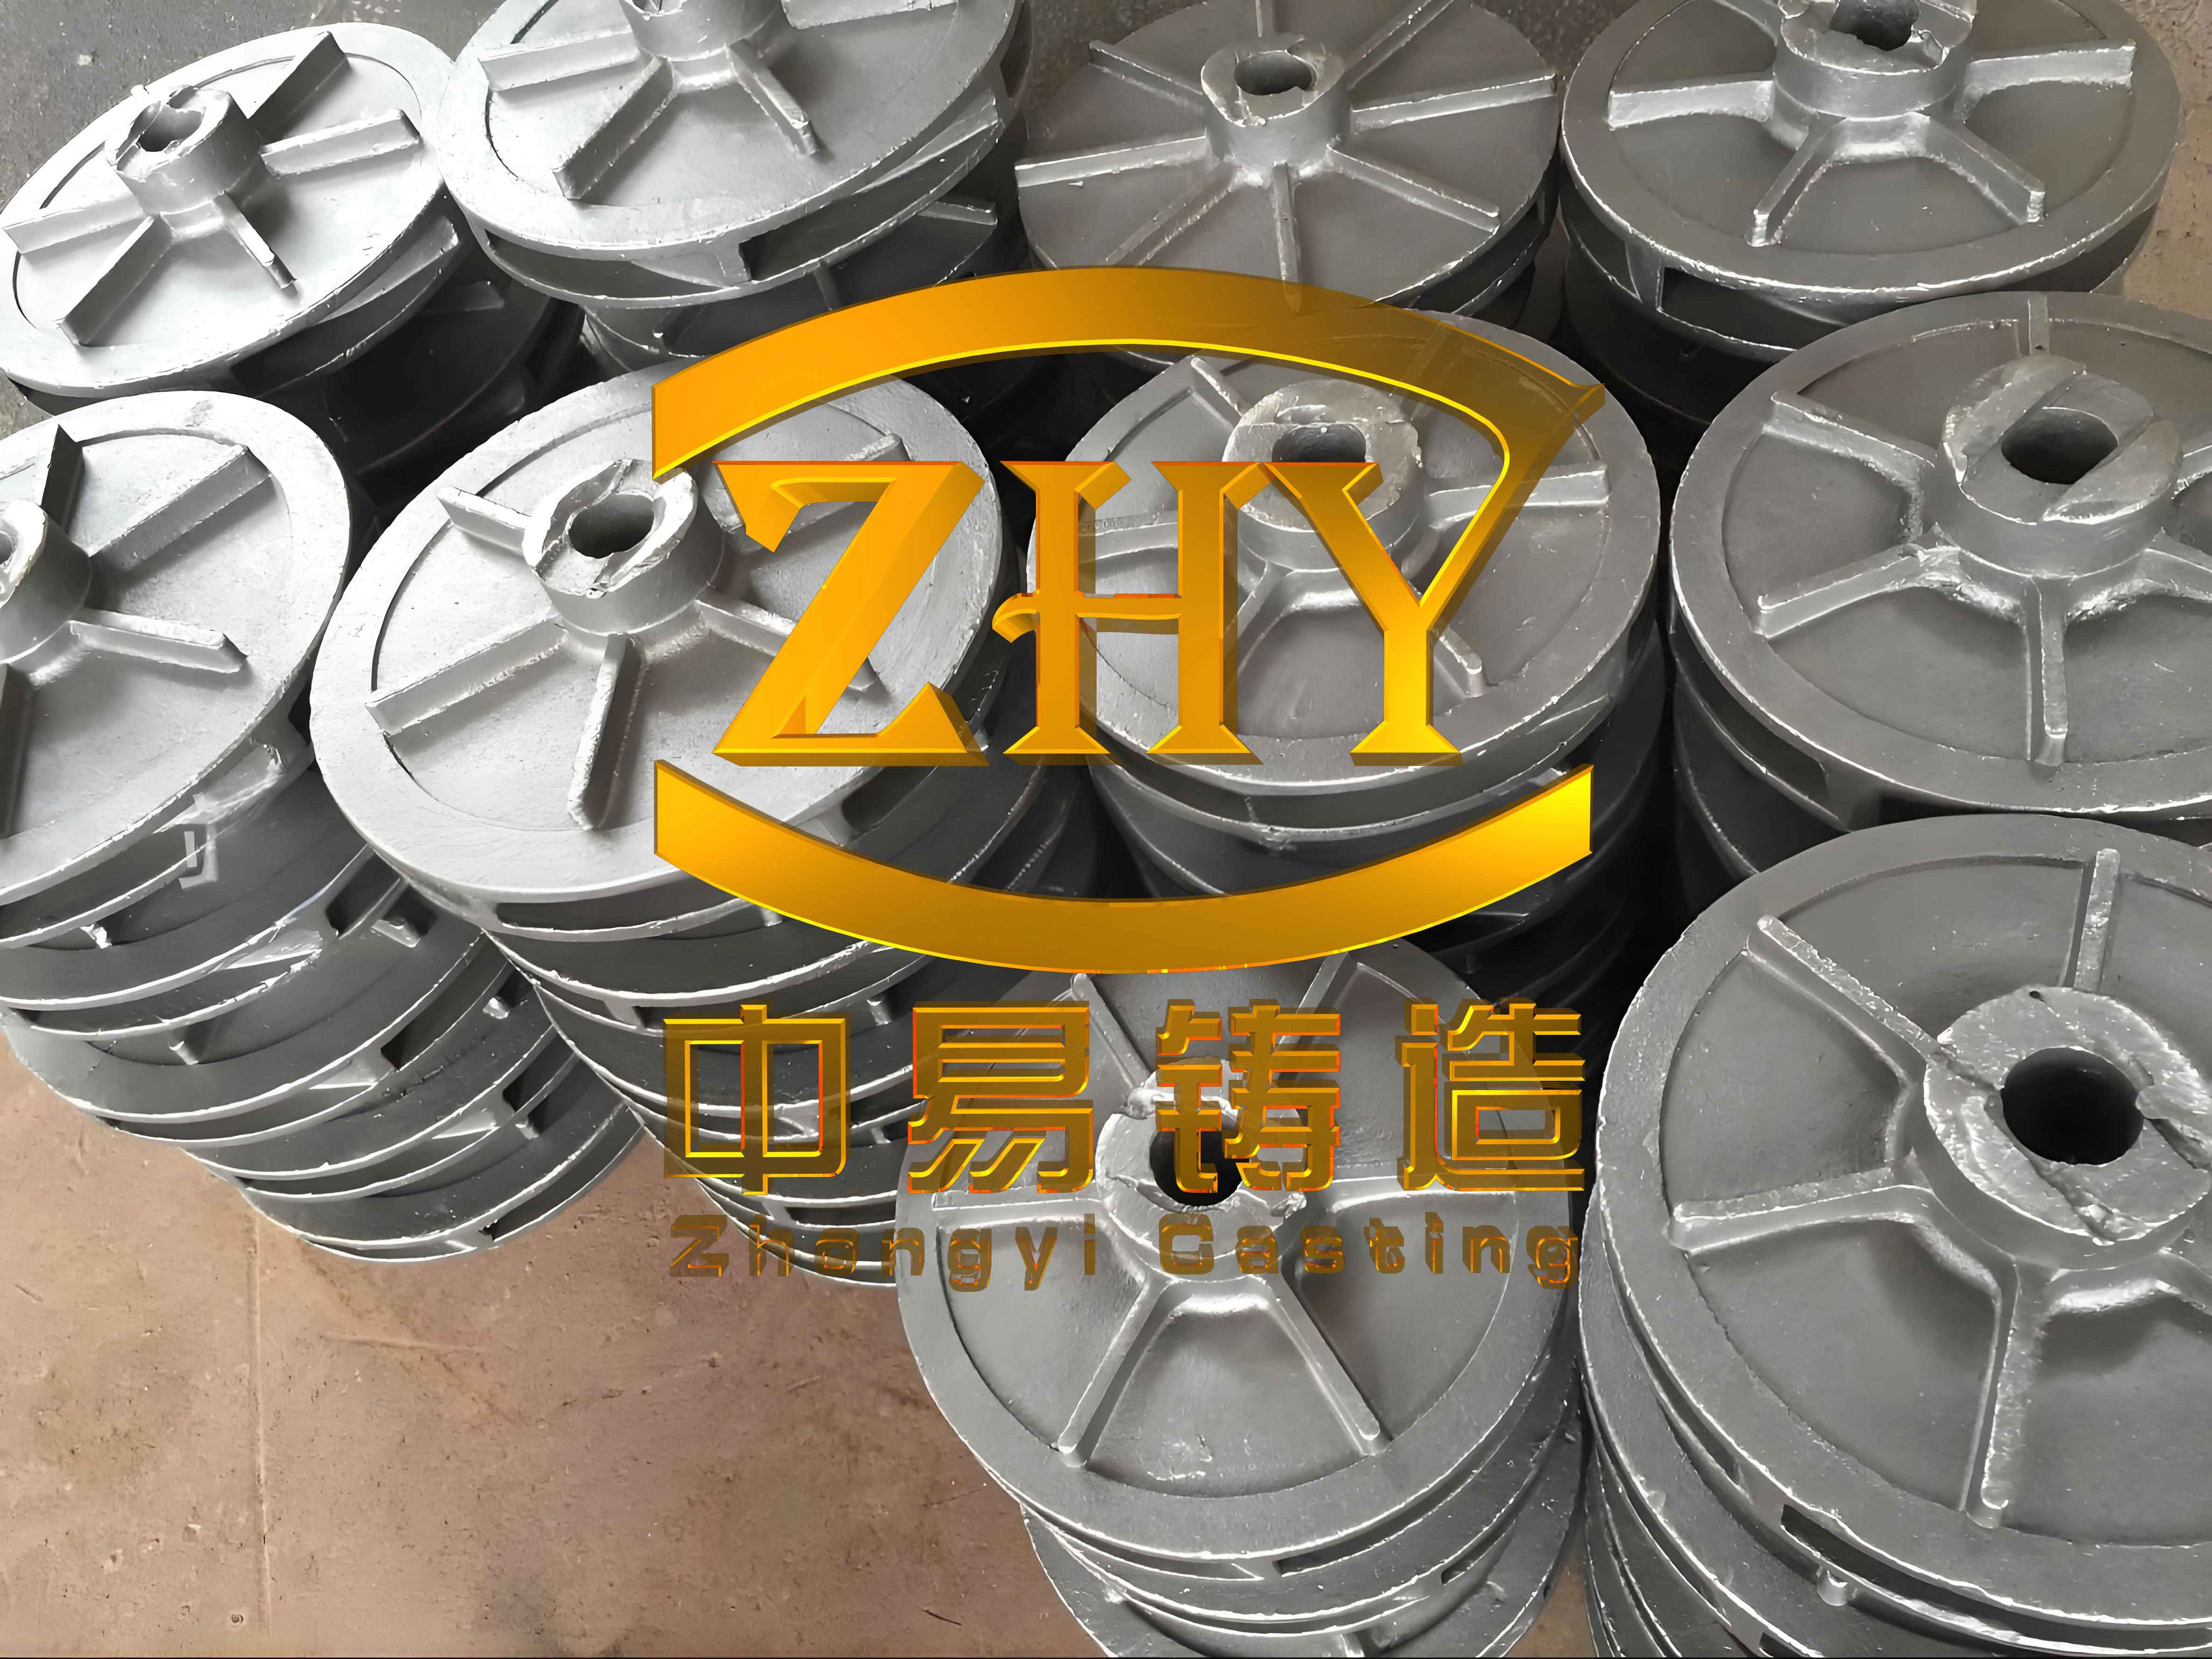
Grey iron castings, such as cylinder heads, operate under severe thermal and mechanical loads, necessitating robust mechanical properties like tensile strength and hardness. The microstructure of grey iron castings, primarily composed of graphite flakes embedded in a ferritic-pearlitic matrix, is highly sensitive to melting parameters and charge composition. In industrial foundries, charge materials typically consist of steel scrap, returns (internal scrap), pig iron, and sometimes start-up blocks. Each material carries inherent hereditary characteristics that can affect graphite nucleation and growth. For instance, returns may contain coarse graphite from previous casts, while pig iron introduces primary graphite that can persist if not fully dissolved. My study aims to quantify these effects through systematic trials, providing guidelines for optimizing charge ratios to meet stringent specifications for grey iron castings.
I conducted my experiments using a 10-ton medium-frequency induction furnace. The target material was HT280 grey iron, commonly used for cylinder heads. The chemical composition requirements, as per industry standards, are summarized in Table 1. To ensure consistency, I maintained the carbon equivalent (CE) within a narrow range, calculated using the formula: $$CE = C + \frac{Si + P}{3}$$ where C, Si, and P are the weight percentages of carbon, silicon, and phosphorus, respectively. This formula is crucial for predicting the castability and strength of grey iron castings.
| Element | Range |
|---|---|
| C | 3.20–3.35 |
| Si | 1.70–2.10 |
| Mn | 0.60–1.00 |
| S | 0.06–0.12 |
| P | ≤0.06 |
| Cu | 0.60–0.80 |
| Cr | 0.20–0.35 |
| Ni | 0.30–0.50 |
The charge materials included steel scrap, returns, pig iron, and start-up blocks (Φ800 mm × 400 mm cylinders with composition similar to returns). I designed seven distinct charge ratio schemes, as detailed in Table 2, to isolate the effects of each component. Schemes 1–4 varied the returns proportion from 15% to 40%, keeping other factors constant. Scheme 5 introduced 15% start-up blocks to assess their hereditary impact. Schemes 6 and 7 incorporated pig iron at 5% and 57%, respectively, with Scheme 7 involving a high-temperature stirring process to mitigate graphite heredity. This stirring was performed at above 1500°C for 1.5 hours to accelerate the dissolution of primary graphite from pig iron in the grey iron castings.
| Scheme | Pig Iron | Steel Scrap | Returns | Start-up Block |
|---|---|---|---|---|
| 1 | 0 | 85 | 15 | 0 |
| 2 | 0 | 80 | 20 | 0 |
| 3 | 0 | 75 | 25 | 0 |
| 4 | 0 | 60 | 40 | 0 |
| 5 | 0 | 70 | 15 | 15 |
| 6 | 5 | 55 | 40 | 0 |
| 7 | 57 | 13 | 30 | 0 |
Melting was carried out in batches: first pig iron or start-up blocks, then steel scrap, followed by returns. Alloying elements—such as silicon carbide, ferromanganese, carburizers, sulfur additives, ferrochromium, copper, and nickel—were added before 70% of the charge was melted. The melt was held at 1520–1530°C for 10 minutes to ensure homogeneity, then tapped at 1460–1530°C. Inoculation was performed at the furnace with 0.3–0.5% ferrosilicon, and instantaneous inoculation of 0.06–0.12% was added during pouring. These practices are standard for producing high-quality grey iron castings.
After casting, I extracted samples from the cylinder head bodies (as shown in the referenced figure) for microstructural and mechanical testing. Microstructure was examined using optical microscopy to assess graphite type, length, and matrix phases. Tensile strength was measured on universal testing machines, and hardness was determined via Brinell tests. The results are compiled in Tables 3 and 4, which reveal clear trends related to charge ratios.
| Scheme | C | Si | Mn | S | P | Cu | Cr | Ni |
|---|---|---|---|---|---|---|---|---|
| 1 | 3.35 | 1.95 | 0.70 | 0.079 | 0.021 | 0.66 | 0.24 | 0.30 |
| 2 | 3.34 | 1.95 | 0.80 | 0.075 | 0.020 | 0.66 | 0.23 | 0.31 |
| 3 | 3.35 | 1.98 | 0.73 | 0.075 | 0.020 | 0.69 | 0.24 | 0.32 |
| 4 | 3.34 | 1.90 | 0.72 | 0.075 | 0.022 | 0.72 | 0.28 | 0.34 |
| 5 | 3.33 | 1.95 | 0.74 | 0.073 | 0.023 | 0.65 | 0.25 | 0.30 |
| 6 | 3.32 | 1.90 | 0.73 | 0.076 | 0.021 | 0.74 | 0.21 | 0.31 |
| 7 | 3.27 | 1.91 | 0.69 | 0.081 | 0.027 | 0.80 | 0.23 | 0.30 |
From Table 3, the chemical compositions are relatively consistent across schemes, with minor variations in alloying elements like Cu, Cr, and Ni. These variations partly explain the mechanical property differences. The carbon equivalent for each scheme can be calculated using the formula above. For example, in Scheme 1: $$CE = 3.35 + \frac{1.95 + 0.021}{3} \approx 3.35 + 0.657 = 4.007$$ This high CE indicates good fluidity but may promote graphite coarseness in grey iron castings.
| Scheme | Tensile Strength (MPa) | Hardness (HB) | Graphite Type | Graphite Length (Grade) | Pearlite Content (%) |
|---|---|---|---|---|---|
| 1 | 286 | 202 | A | 4 | ≥98 |
| 2 | 282 | 204 | A | 4 | ≥98 |
| 3 | 280 | 202 | A | 4 | ≥98 |
| 4 | 285 | 204 | A | 4 | ≥98 |
| 5 | 250 | 185 | A | 4 | ≥98 |
| 6 | 282 | 202 | A | 4 | ≥98 |
| 7 | 253 | 191 | A | 4 | 95–98 |
The data in Table 4 shows that tensile strength and hardness are influenced by charge ratios. In Schemes 1–3, as returns proportion increases from 15% to 25%, tensile strength slightly decreases from 286 MPa to 280 MPa. This correlates with microstructural observations: higher returns content leads to longer and more numerous graphite flakes due to hereditary effects. Graphite length is graded on a scale where lower numbers indicate longer flakes; here, all schemes show Grade 4, but microscopic analysis revealed increased graphite size with returns. The relationship between graphite morphology and tensile strength can be expressed empirically: $$\sigma_t = A – B \cdot L_g$$ where $\sigma_t$ is tensile strength, $L_g$ is average graphite length, and A and B are material constants. For grey iron castings, longer graphite flakes act as stress concentrators, reducing strength.
Scheme 4, with 40% returns, exhibits a slight strength recovery to 285 MPa, attributed to higher alloy content (Cu, Cr, Ni). These elements enhance pearlite stability and refine the matrix, offsetting the negative hereditary impact. The role of alloys in grey iron castings is crucial; for instance, chromium increases hardenability and pearlite content, as described by: $$P_c = f(Cr, Cu, Mn)$$ where $P_c$ is pearlite fraction. In my trials, Scheme 4 had the highest Cr and Cu, promoting pearlite formation and strength.
Scheme 5, with 15% start-up blocks, shows a significant drop in tensile strength (250 MPa) and hardness (185 HB). Start-up blocks, being slowly cooled, contain coarse graphite that inherits into the new grey iron castings. This heredity is evident in the microstructure, where graphite appears bulkier and pearlite interlamellar spacing increases. The hardness reduction aligns with the Hall-Petch relationship for pearlitic steels, adapted for grey iron: $$HB = H_0 + k \cdot \lambda^{-1/2}$$ where $\lambda$ is pearlite spacing, and $H_0$ and k are constants. Coarser pearlite from hereditary effects lowers hardness in grey iron castings.
Schemes 6 and 7 incorporate pig iron. Scheme 6 (5% pig iron) shows properties similar to Scheme 4, but Scheme 7 (57% pig iron) with high-temperature stirring yields lower strength (253 MPa) and hardness (191 HB). Pig iron introduces primary graphite, which, if not dissolved, leads to coarse flakes and increased ferrite content. In Scheme 7, stirring at 1500°C for 1.5 hours accelerated graphite dissolution, reducing heredity. The kinetics of graphite dissolution can be modeled by: $$\frac{dG}{dt} = -k \cdot (G – G_e)$$ where G is graphite size, $G_e$ is equilibrium size, and k is a rate constant dependent on temperature and stirring. This process is vital for controlling microstructure in grey iron castings.
Microstructurally, all schemes exhibited Type A graphite, but variations in flake length and matrix were noted. For example, Scheme 7 had 95–98% pearlite with some ferrite, whereas others had ≥98% pearlite. Ferrite content inversely correlates with strength, as ferrite is softer than pearlite. The tensile strength of grey iron castings can be estimated from composition and microstructure using empirical equations like: $$\sigma_t = 100 + 20 \cdot (\%Pearlite) – 15 \cdot (\%Graphite Length)$$ This highlights the trade-offs in charge design.
The hereditary effects are a recurring theme in my study. Returns and start-up blocks carry “memory” of prior solidification conditions, influencing graphite nucleation. Pig iron heredity is linked to its manufacturing process, where slow cooling yields large graphite. In industrial production of grey iron castings, managing heredity through charge selection and melting practices is key. High-temperature stirring, as in Scheme 7, proves effective for mitigating pig iron heredity, but it increases energy costs.
To summarize, my experiments demonstrate that charge ratios profoundly affect the performance of grey iron castings. Returns proportion up to 25% gradually reduces strength due to graphite coarsening, but higher returns with alloy boosts can compensate. Start-up blocks should be minimized due to strong negative heredity. Pig iron requires careful processing; even high proportions can be managed with stirring. These insights help foundries optimize charge mixes for consistent grey iron castings, especially for high-demand applications like cylinder heads.
In conclusion, the interplay between charge materials and hereditary characteristics is critical for producing high-quality grey iron castings. By adjusting returns, pig iron, and start-up block ratios, along with implementing techniques like high-temperature stirring, foundries can tailor microstructure and mechanical properties to meet specifications. Future work could explore dynamic charge optimization models or advanced inoculation methods to further enhance grey iron castings. This research underscores the importance of holistic melting control in the manufacturing of grey iron castings.