

Quenching process is an important part of the production process of iron and steel materials. The selection of quenching medium will significantly affect the microstructure and mechanical properties of materials. In order to explore the influence of quenching process on the mechanical properties and microstructure of experimental steel, the samples kept at 900 ° C for 2h are quenched by oil cooling, air cooling, air cooling and furnace cooling respectively, In the selected cooling mode, the cooling rate range of oil cooling is 15 ° C / s to 8 ° C / s, the cooling rate range of air cooling is 5 ° C / s to 2 ° C / s, the cooling rate range of air cooling is 1 ° C / s to 0.5 ° C / s, the cooling rate range of furnace cooling is 0.1 ° C / s to 0.05 ° C / s, and the quenched sample is fired back at 300 ° C for 2 hours. It can be seen that with the change of cooling mode, when the cooling rate decreases continuously, the tensile strength, yield strength and hardness of the experimental steel decrease in varying degrees, while the change of impact energy is opposite.

The metallographic structure photos of the experimental steel after heat treatment by oil cooling, air cooling, air cooling and furnace cooling are shown in Figure 1. According to the CCT curve in Figure 2 and the metallographic structure results in Figure 3, it can be seen that the microstructure of the experimental steel is still bainite martensite retained austenite, but its phase composition and morphology are quite different.


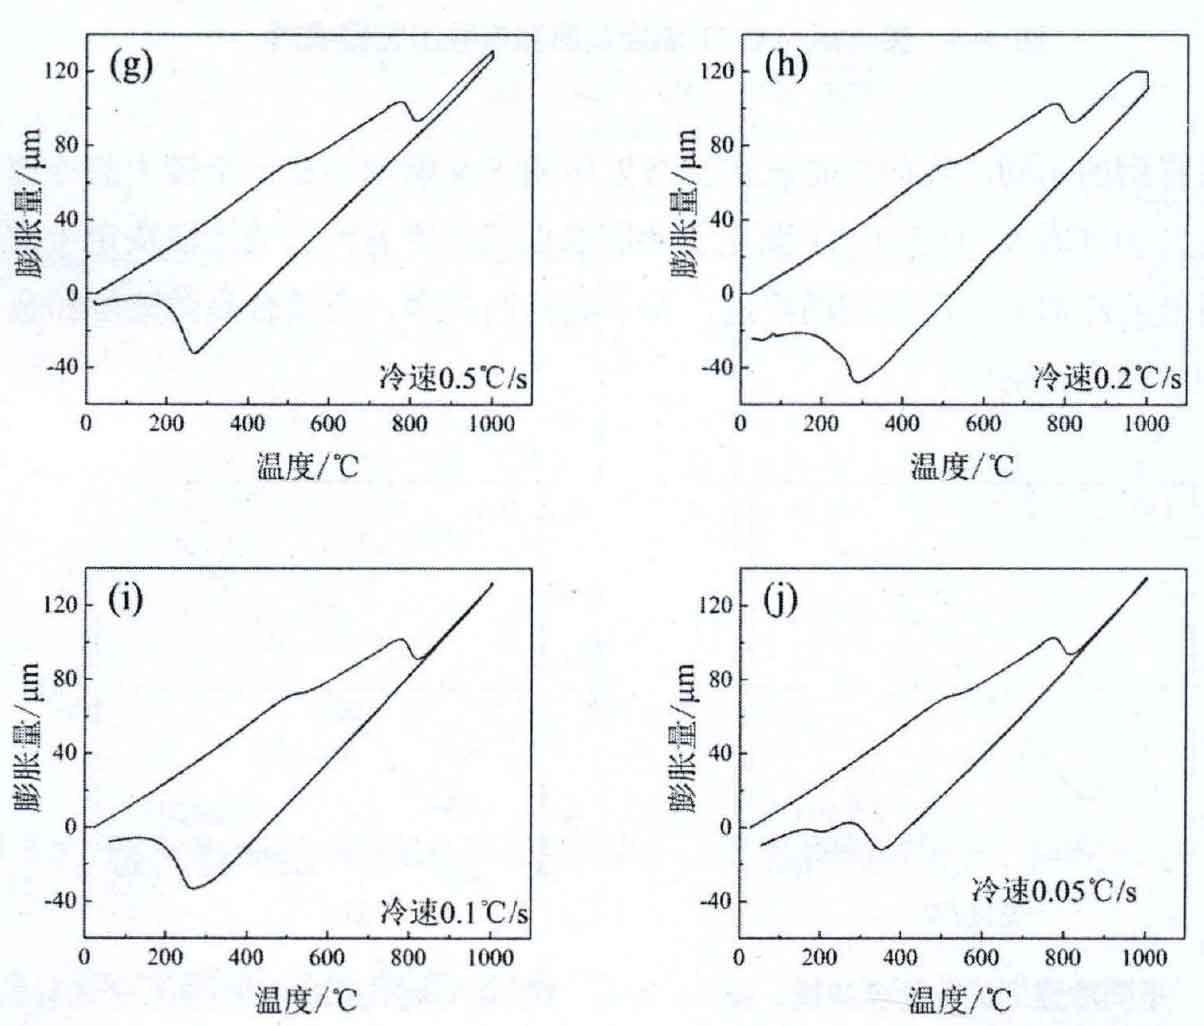
(e) 2 ° C / S; (f) l0c / S; (g) 0.5 ° C / S; (h) 0.2 ° C / S; (i) 0.1 ° C / S; (j) 0.05 ° C / S
In order to study the influence mechanism of bainite and martensite structure on mechanical properties of experimental steel, representative air-cooled and furnace cooled samples were selected to obtain differentiated structures with martensite and bainite as the dominant phase respectively, so as to further reveal the relationship between microstructure and properties of experimental steel. The SEM structure and MSD phase distribution of the two samples are shown in Fig. 4. Although the same microstructure is bainite martensite retained austenite, the microstructure of air-cooled samples is obviously dominated by lath martensite, while that of furnace cooled samples is dominated by lower bainite. EBSD phase distribution results show the content of phases with different crystal structures in the experimental steel, in which body centered cubic (BCC) represents martensite and bainite, and face centered cubic (FCC) represents the content of residual austenite, EBSD results show that there is little difference in the content of retained austenite in the experimental steel.


The advantage of nano indentation experiment is that the indenter and indentation size are very small and can reach the nanometer level. Therefore, nano indentation is used to accurately measure the hardness, stiffness, elastic modulus, fracture stiffness, failure point, stress-strain, creep and other mechanical data of different parts and even phases of materials, so as to evaluate the local mechanical properties of material substructures, It has become one of the research hotspots. As shown in Fig. 5, the nano hardness of martensite and bainite fine structures was measured by mtsnanoindenter XP nano indentation instrument.

During the test, all measuring points are pressed into the depth of 800nm, the indenter is Berkovich type, and the fused quartz is used as the reference sample for calibration. The allowable thermal drift rate is limited to 0.05 nm / s. The continuous stiffness measurement method is applied to continuously obtain the distribution of hardness and depth, and the Poisson’s ratio reaches ν= 0.25。 The surface of the sample was mechanically polished and then eroded with 4% nitric acid alcohol solution. In order to accurately find out the nano indentation in the electron microscope, a square grid is carved on the etching surface with a tool knife. During the experiment, a specific square grid is selected for testing. First, make the indenter press out five large indentations with a side length of more than 10pm as a directional mark for positioning, and then test at 50pm away from the directional mark area. For each sample, 26 separate nano hardness measurements were performed successively on the 5×5 matrix and an additional point used to determine the direction. Therefore, each indentation can be observed and matched with its test results. The indentation results of nano indentation test are shown in Figure 6,
Due to the machine measurement limits and errors of mtsnanoindenterxp itself, a small number of test results cannot be obtained (blank points in the matrix). Through the above test method, the indentation of each nano hardness test corresponds to its number. Through SEM observation, it can be found that some indentations are pressed on the martensite lath (marked as m), others are pressed on the bainite lath (marked as b), and some indentations are at the junction of bainite and martensite (marked as I). The average nano hardness of air-cooled samples at the junction of martensite lath, bainite lath and bema is 5.923gpa, 4.281gpa and 5.035gpa respectively. The average nano hardness of furnace cooled samples at the junction of martensite lath, bainite lath and bema is 5.343gpa, 4.119gpa and 5.128gpa respectively.

In order to investigate the causes of the toughness difference between air-cooled samples and furnace cooled samples, the element segregation at the grain boundary on the fracture surface of the experimental steel was detected by AES. The results are shown in Fig. 7. It can be seen that on the fracture surface of the air-cooled sample, the contents of S and Mn increase sharply at the grain boundary, which indicates that s and Mn in the martensitic structure tend to segregate at the grain boundary. Some studies have shown that the segregation of sulfur at grain boundary can significantly lead to brittleness in low alloy steel, especially martensite. However, no similar experimental phenomenon was found at the grain boundary on the fracture surface of furnace cooled samples.
EBSD is used to count the grain boundary angle composition of the experimental steel. The grain boundary with deflection angle between 5 ° – 15 ° is a small angle grain boundary, and the grain boundary with deflection angle above 15 ° is a large angle grain boundary. The results are shown in Fig. 8. In Fig. 8a, 106446 grain boundary deflection angles in the air-cooled sample are counted, in which the small angle grain boundary and large angle grain boundary account for 11.6% and 46.4% respectively. Accordingly, 93605 grain boundary deflection angles in the air-cooled sample are counted in Fig. 8b, in which the small angle grain boundary and large angle grain boundary account for 8.8% and 56.5% respectively. Therefore, the content of large angle grain boundaries in furnace cooled samples is about 10% higher than that in air-cooled samples. Studies have shown that large angle grain boundaries can effectively improve the crack propagation resistance. The toughness of materials actually reflects the resistance to crack initiation and propagation. In the experimental steel, the crack starts and propagates rapidly in or between grains until the crack tip reaches the grain boundary with different deflection angles. At this time, due to the difference of grain boundary energy between large angle grain boundary and small angle grain boundary, higher driving force is required for cracks to break through large angle grain boundary.

Fig. 9A shows the TEM photos of a section of grain boundary of the air-cooled sample. There are obvious precipitation of second phase particles with similar morphology along the grain boundary, and the diameter of these particles is between 0.2pm and 0.5pm. The content of chemical elements was analyzed by energy dispersive spectrometer equipped with TEM electron microscope. The results show that these second phase particles are mainly carbides or silicides of chromium, manganese and molybdenum. In particular, MnSi and SiC have huge covalent bond energy, which makes a significant difference between particles and matrix. Therefore, these particles often fall off as the initiation point of intergranular crack and accelerate the crack propagation. In contrast, figure 9b shows a microcrack in the furnace cooled specimen. One of the leading edges of crack propagation was blocked by a second phase particle with a diameter of about 0.7pm and stopped its continuous propagation. EDS results showed that the second phase particle was Y203.


Considering the above experimental results, it can be concluded that the compounds of Mn, s, C and Si lead to the brittleness of martensite structure in air-cooled samples. Relatively, the large angle grain boundary and the precipitation of rare earth elements hinder the crack propagation in furnace cooled samples. Therefore, furnace cooled experimental steel (28.3j) is better than air-cooled experimental steel (16.1j) It shows higher toughness.

Figure 10 shows the EBSD reverse pole diagram of two samples. In the air-cooled sample, the lath size dominated by martensite is 1.01 μ M to 16.73 μ M, with an average of 1.94 μ m。 The size of bainite dominated lath under furnace cooling sample is 1.01 μ M to 17.19 μ M, with an average of 2.33 μ m。 Therefore, the lath size of the furnace cooled sample is 20.1% higher than that of the air-cooled sample. The finer lath makes the air-cooled sample obtain the performance advantages in strength and hardness.
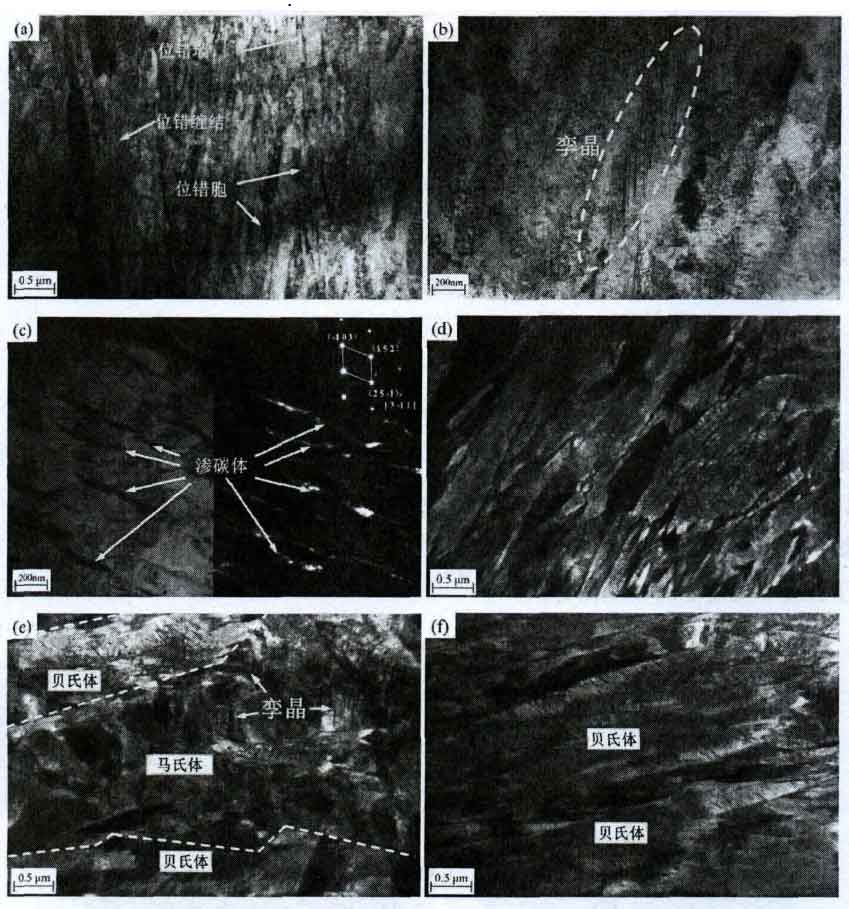
Fig. 11 lists the TEM microstructure morphology of the experimental steel, and Fig. 11a shows the dislocation morphology in the experimental steel, mainly including dislocation wall, dislocation cell and high-density dislocation entanglement. These dislocation structures play a key role in the high strength and hardness of the experimental steel. Figure 11b shows the twin martensite structure in the experimental steel. In Fig. 11C, the morphology of cementite is verified by the calibration of bright and dark field images and diffraction spots. These fine short rod cementites are the characteristic structure in lower bainite. The martensitic laths in the air-cooled sample are shown in Fig. 11d. Compared with the morphology in 11a, it can be clearly found that the martensitic laths in the air-cooled sample are very small, in which dislocation walls, dislocation cells and high-density dislocation entanglements are distributed. In Fig. 11e, it can be seen that twin martensite appears between two wide and thick bainite laths in the junction area of bainite and martensite, that is, twin strengthening is the main strengthening mode of this type of structure. In Fig. 11F, no twins were found in the microstructure of the furnace cooled sample, and the dislocation density also decreased significantly.

Considering the nano indentation, EBSD and TEM results, the strengthening and hardening mechanism of the experimental steel is illustrated by the schematic diagram in FIG. 12. Because high-density dislocations are wound in fine martensitic laths, as shown in Fig. 12a, the martensitic microstructure shows the highest average nano hardness (5.923gpa and 5.343gpa in air-cooled and furnace cooled samples). Accordingly, the average nano hardness of bainite microstructure is much lower (4.281gpa and 4.119gpa), because the dislocation density is significantly lower and the lath is wider. In addition, the average nano hardness of bainite martensite interface is also between (5.035gpa and 5.128gpa). The main strengthening and hardening mechanism of this structure is martensite twins in bainite laths. It also shows that the effect of dislocation on the strength and hardness of experimental steel is stronger than that of twin.