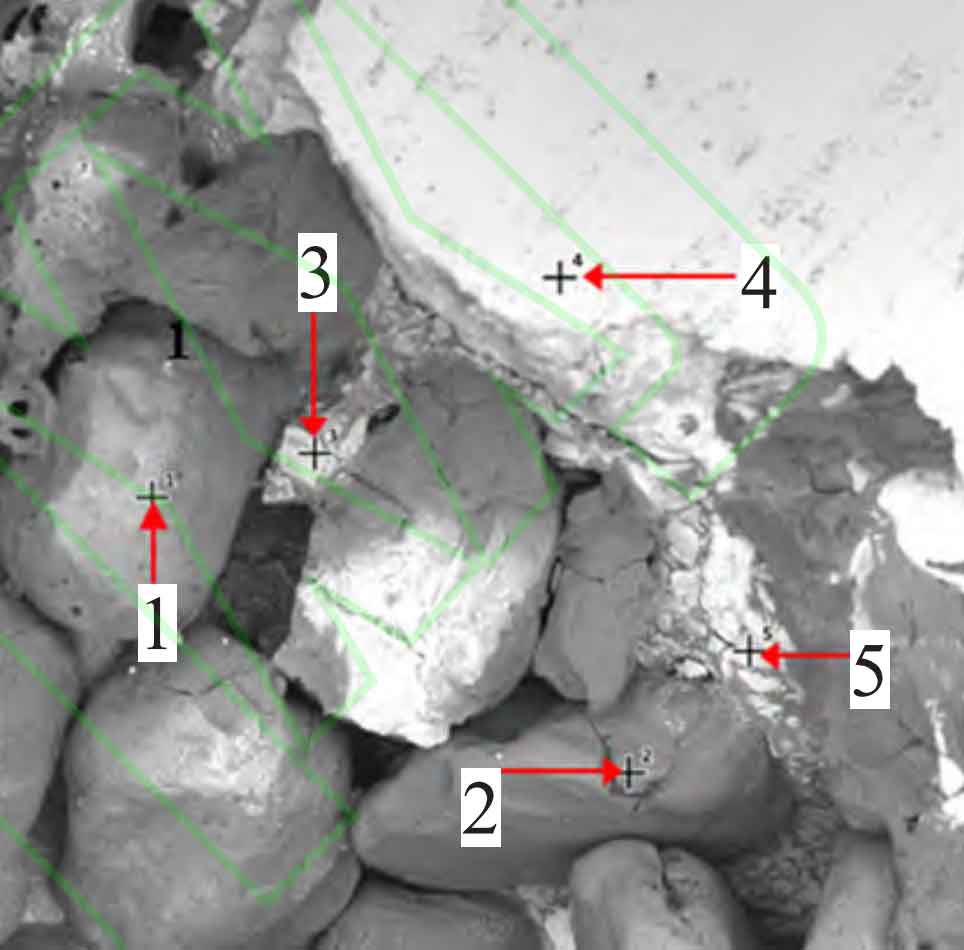
The casting defect samples were analyzed by energy spectrum, and the scanning positions of energy spectrum points were shown in Figure 1. The table shows the element composition of each scanning point of casting defect sample 3. Fig. 2 is the energy spectrum of points 1, 3 and 4 in the casting defect sample.
| Measuring point | O | Si | Fe | Cr | Zr | Br | Nb | Na | K | Ni |
| 1 | 78.04 | 21.85 | 0 | 0 | 0 | 0 | 0 | 0 | 0 | 0 |
| 2 | 62.08 | 36.84 | 0 | 0.76 | 0 | 0 | 0 | 0 | 0 | 0 |
| 3 | 53.33 | 17.51 | 0 | 0.72 | 20.27 | 3.05 | 2.09 | 1.70 | 1.34 | 0 |
| 4 | 8.05 | 1.93 | 35.85 | 16.40 | 0 | 0 | 6.42 | 0 | 0 | 31.36 |
| 5 | 62.59 | 10.20 | 0 | 0.40 | 23.59 | 0.86 | 1.50 | 0,86 | 0 | 0 |
It can be seen from the table and Figure 2 that by comparing the element analysis of casting defect 1 and casting defect 2, points 1 and 2 in the energy spectrum analysis of casting defect 3 can be classified as group 1, points 3 and 5 as group 2, and point 3 as group 3. Among them, the components in points 1 and 2 are mainly composed of Si and O, which are similar to those in defect 1, and their granular morphology is very clear, so the casting defects are sand holes formed in the casting interior; The composition of points 3 and 5 is similar to that of point 1 in casting defect 2. In addition to high oxygen content, they also contain high Zr elements from coatings, and a small amount of Cr elements from smelting steel slag. Obviously, the casting defects at points 3 and 5 are oxidation slag inclusion defects formed in the casting; The component in point 4 is the metal matrix of the casting. Therefore, casting defect sample 3 combines the characteristics of defect 1 and defect 2. It is the combination of sand hole and oxidation slag inclusion from zirconium based coating and smelting steel slag, that is, sand hole+oxidation slag inclusion composite casting defect.

