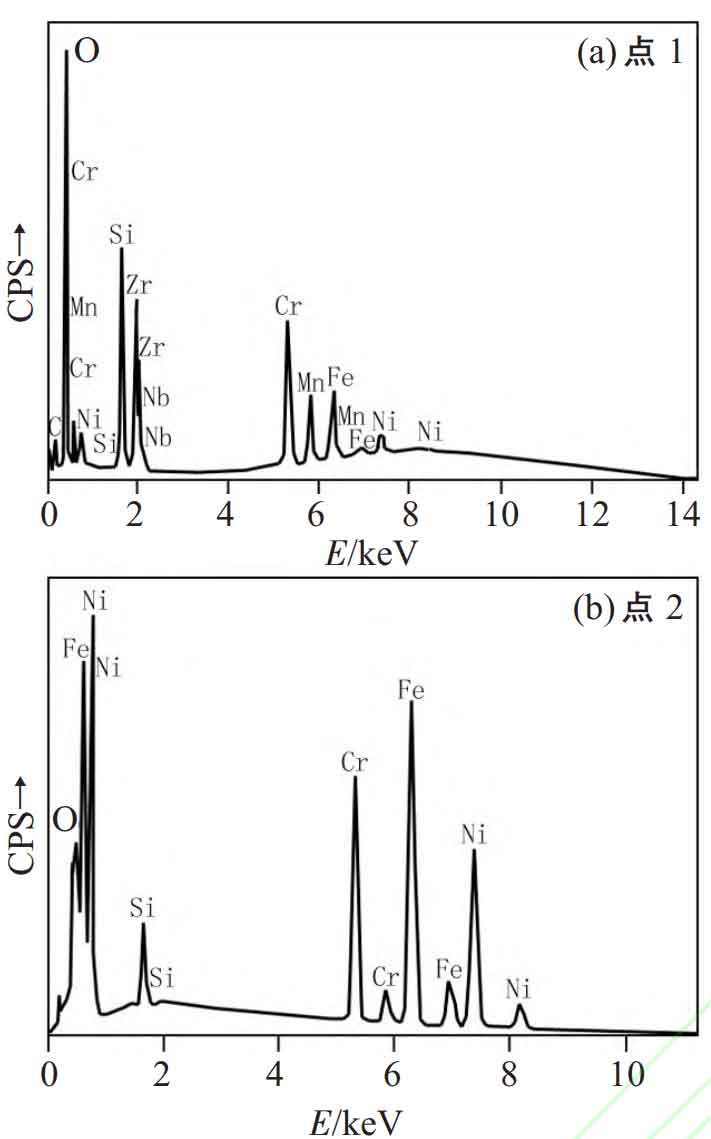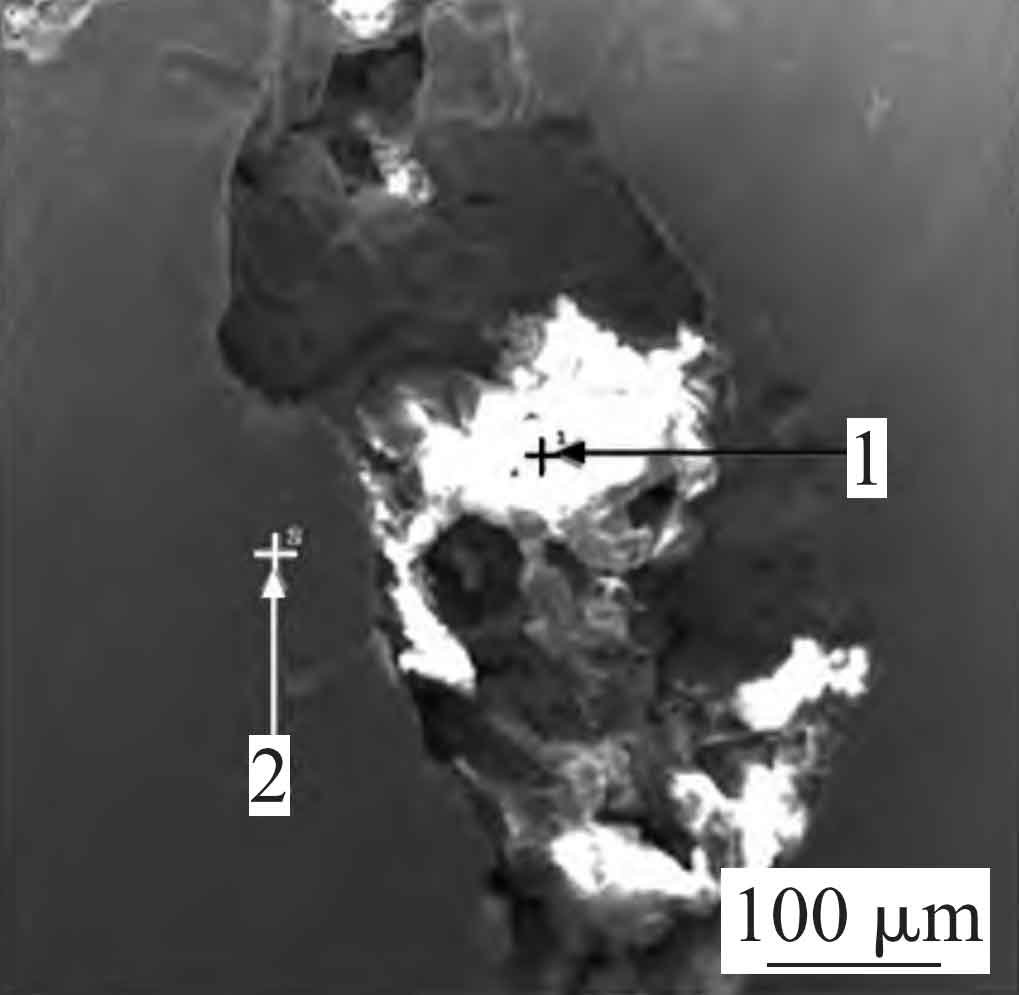
The defect samples are analyzed by energy spectrum, and the scanning positions of energy spectrum points are shown in Figure 1. The table shows the element composition of each scanning point of the defect sample. Fig. 2 is the energy spectrum of midpoints 1 and 2 of the defect sample.
| Measuring point | O | Cr | Zr | Fe | Si | Ni | Mn | Nb | C |
| 1 | 32.81 | 17.99 | 14.38 | 12.77 | 7.01 | 6.38 | 5.98 | 2.21 | 0.46 |
| 2 | 6.60 | 17.12 | 0 | 39.53 | 2.00 | 34.75 | 0 | 0 | 0 |
It can be seen from the table and Figure 2 that the first three elements in point 1 are O, Cr and Zr, while point 2 is Fe, Ni and Cr. It can be seen from the comparison that Point 1 contains nearly 40wt% of non-metallic elements, especially high oxygen content, while Point 2 mainly contains metal elements. Different from points 1, 2 and 3 in defect 1, point 1 in defect 1 also contains more Si and O elements, but also contains more metal elements. At the same time, the bright areas seen in the microscopic morphology are almost connected into one piece, without a clear visible contour, so the defect is not a sand hole. Point 1 contains more Zr element, which is the constituent element of Zr based coating used in the casting molding process; There is no Zr element in Point 2, but there are more Fe, Ni, Cr and other elements, which are all constituent elements of the alloy. As Defect 2 is located inside the casting, according to the comprehensive analysis of the above situation, it can be seen that Defect 2 is a “oxygenated slag inclusion” defect formed due to the impact of molten metal or low sand mold strength, part of the coating falls off from the surface of the mold cavity and enters the molten metal, and combines with the slag entering the mold cavity and remains in the casting.