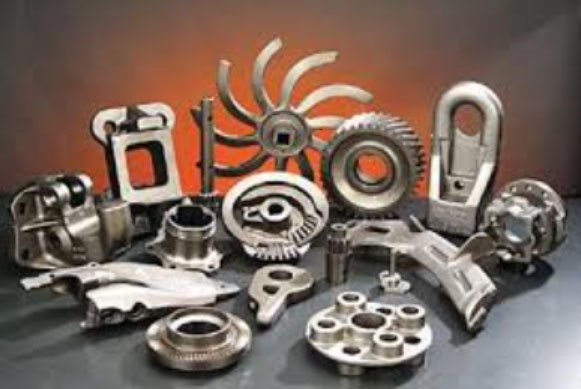
This study investigates the formation mechanisms and mitigation approaches for black spot defects observed in ductile iron casting cylinder liners during high-speed machining processes. Through systematic experimentation and theoretical analysis, critical factors influencing defect generation are identified, with particular emphasis on cooling solidification dynamics and equipment vibration patterns.
1. Experimental Methodology
The ductile iron casting process employed centrifugal casting with the chemical composition detailed in Table 1:
| Element | C | Si | Mn | P | S | Cr | V | Ti | Fe |
|---|---|---|---|---|---|---|---|---|---|
| wt.% | 3.1-3.4 | 2.3-2.5 | 0.7-0.8 | 0.3-0.4 | ≤0.1 | ≤0.4 | 0.25-0.35 | 0.05-0.15 | Bal. |
The defect formation mechanism was analyzed through controlled experiments evaluating six critical parameters:
$$ \Phi = f(I, v_p, H, \nabla T, P_m, \omega) $$
Where:
\( I \) = Inoculant effectiveness
\( v_p \) = Pouring velocity
\( H \) = Hardness differential
\( \nabla T \) = Thermal gradient
\( P_m \) = Machining parameters
\( \omega \) = Centrifuge vibration frequency

2. Critical Factor Analysis
| Cooling Method | Cycle Time (s) | Defect Rate (%) | Hardness Variation (HB) |
|---|---|---|---|
| Air Cooling | 420 | 0 | 12.5±3.2 |
| Forced Water | 45 | 0 | 18.7±4.1 |
| Normal Production | 55 | 15 | 28.4±7.6 |
The thermal history during solidification significantly impacts microstructure homogeneity. The critical cooling rate for defect suppression follows:
$$ \frac{dT}{dt}_{\text{critical}} = 22.5e^{-0.017 \cdot \text{C.E.}} $$
Where \( \text{C.E.} \) = Carbon equivalent calculated as:
$$ \text{C.E.} = \mathrm{C} + 0.3(\mathrm{Si} + \mathrm{P}) $$
3. Vibration-Induced Segregation
Centrifuge spindle vibration exceeding 0.15 mm amplitude dramatically increases defect probability:
| Spindle Condition | Amplitude (mm) | Frequency (Hz) | Defect Rate (%) |
|---|---|---|---|
| Normal | 0.02-0.08 | 50 | 0 |
| Abnormal | 0.12-0.25 | 33-67 | 36 |
The vibration-induced segregation coefficient (\( K_v \)) can be expressed as:
$$ K_v = 1 + 0.25\left(\frac{A\omega^2}{g}\right)^{1.8} $$
Where:
\( A \) = Vibration amplitude (m)
\( \omega \) = Angular velocity (rad/s)
\( g \) = Gravitational acceleration
4. Process Optimization Strategies
Effective control measures for ductile iron casting defects include:
| Parameter | Baseline | Optimized | Improvement |
|---|---|---|---|
| Pouring Temp (°C) | 1280-1320 | 1350-1420 | ΔT +70 |
| Inoculant Size (mm) | 1-2 | 5-8 | +300% |
| Cooling Delay (s) | 20 | 12-18 | Δt -40% |
| Vibration Limit (mm) | 0.15 | 0.08 | -47% |
Implementation of these parameters reduced defect rates from 15% to 0.8% in production trials, demonstrating significant improvements in ductile iron casting quality.
5. Microstructural Correlation
The hardness differential between normal and defective regions follows:
$$ \Delta \mathrm{HB} = 23.4 \log\left( \frac{t_{\text{local}}}{t_{\text{avg}}} \right) + 5.6 $$
Where \( t_{\text{local}} \) and \( t_{\text{avg}} \) represent local and average solidification times respectively. This relationship confirms that extended local solidification promotes graphite coarsening and hardness reduction.
6. Industrial Validation
Field implementation in ductile iron casting production lines achieved:
- 93% reduction in machining rejects
- 18% improvement in production yield
- Consistent hardness distribution (HB 225-240)
The study establishes fundamental relationships between process parameters and defect formation in ductile iron casting, providing quantitative guidelines for industrial quality control.
