1. Introduction
In the field of metal heat treatment, induction heating is a commonly used method. This article focuses on the cracking mechanism of cast crankshaft induction hardening and the control of quenching liquid concentration. The quality of the crankshaft is significantly affected by the induction hardening process, which is rather complex and prone to various quality issues, with induction hardening cracks being a common problem. By studying the principle of crack generation, this article analyzes the possible risk factors in the production process and puts forward a new method for monitoring the concentration of the quenching liquid to avoid the occurrence of induction hardening cracks and improve the physical quality of the crankshaft.
2. Principles of Induction Heating
Induction heating is a process where a high-frequency alternating current passes through an induction coil, generating a high-frequency 交变 magnetic field. When a metal workpiece is placed within this magnetic field, eddy currents are induced on the surface of the workpiece due to the skin effect. The resistance of the workpiece causes the eddy currents to generate heat, rapidly heating the workpiece. The heating depth depends on the frequency of the current. Higher frequencies result in shallower heating, while lower frequencies allow for deeper penetration of heat.
3. Generation Mechanism of Induction Hardening Cracks in Crankshaft
3.1 Crack Morphology
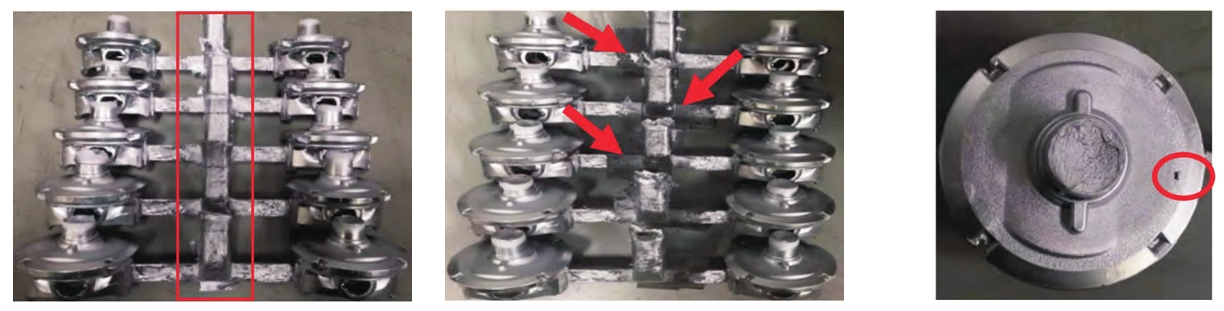
Figures 1 and 2 show the morphology of induction hardening cracks produced in a certain crankshaft machining line of Shanghai Volkswagen Powertrain Co., Ltd. The cracks occur on the cast crankshaft, with the blank material being nodular cast iron TL124, and the location of the cracks being on the side of the main journal IV. These quenching cracks are occasional phenomena. The monitoring method in daily production is to continuously sample and measure 5 pieces per hour. Once induction hardening cracks are detected in the sampling, 100% non-destructive testing is initiated, with a crack occurrence rate of about 3%.
3.2 Mechanism of Crack Generation
When the internal stress is lower than the yield limit, the part undergoes elastic deformation. Once the internal stress exceeds the yield limit, local plastic deformation occurs under the action of tensile stress, posing a risk of cracking. When the internal stress is greater than the material’s yield limit, plastic deformation occurs. With the continuous increase of internal stress, brittle fracture of the part occurs, ultimately leading to the generation of cracks. Usually, by observing the fracture form and appearance of the induction hardening crack of the crankshaft in the laboratory through a microscope, it can be analyzed that the quenching crack is a brittle fracture under the action of internal stress.
The mechanism of quenching crack generation is that during the quenching spray cooling process, both thermal stress and organizational stress are simultaneously generated. Thermal stress is generated within the crankshaft due to the decrease in temperature. According to the thermal expansion law of the material, it shrinks during cooling, and the difference in cooling rate between adjacent parts leads to a difference in specific volume at any moment during the cooling process, resulting in mutual stress, which is called thermal stress. Thermal stress is often compressive stress. However, below the Ms point (martensite transformation starting temperature), both mechanisms occur simultaneously, but due to the fact that the linear expansion amount caused by martensite transformation is greater than the thermal expansion, the organizational stress mechanism plays a major role below the Ms point. The internal stress is the difference between the organizational stress and the thermal stress.
4. Causes of Induction Hardening Cracks in Crankshaft
4.1 Internal Factors
The essence of martensite is the internal cause of quenching cracks, and the crystal structure, chemical composition, and casting defects of martensite are the influencing factors of the essential brittleness of martensite.
4.2 External Factors
Various process conditions and the size and shape of the part, which cause the magnitude, direction, and distribution of the macroscopic internal stress, are the external causes of quenching cracks. Due to the very complex shape of the crankshaft, there are many reasons for crack generation. Comprehensive analysis such as macroscopic observation, chemical composition analysis, metallographic organization detection, mechanical property testing, fracture morphology analysis, structural design, machining quality, heat treatment process, and casting defects is required to obtain a definite conclusion. The possible causes of quenching cracks are analyzed as follows:
4.2.1 Blank Material Carbon Content and Alloy Elements
An increase in carbon content will reduce the fracture strength of martensite. The influence of alloy elements on quenching cracks varies.
4.2.2 Original State Before Quenching
The original state before quenching also has a great influence on quenching cracks, such as lamellar pearlite, non-equilibrium structures such as martensite and bainite, non-uniform network carbides, non-metallic inclusions, hot structures and flow lines during casting, etc., all of which may lead to and promote the generation of quenching cracks. Additionally, shrinkage cavities, slag inclusions, and severe rolling defects can cause significant material non-uniformity.
4.2.3 Size and Shape of the Part
The cracking after quenching is closely related to the shape of the workpiece, and the shape directly affects the magnitude and distribution of the quenching stress. Often, notches, corners, grooves, cavities, and sections with sharp changes on the workpiece are all concentrated areas of quenching internal stress, which are high-risk areas for crack generation. The red boxed areas in Figure 3 are all the stress concentration areas of this series of crankshaft models.
4.2.4 Improper Heat Treatment Heating
Both the heating temperature and holding time of the workpiece can become the inducement of quenching cracks. The higher the quenching heating temperature, the greater the tendency of cracking. If the quenching temperature rises and the heating and holding time is prolonged, the grains of austenite will grow, resulting in coarsening and embrittlement of the quenched martensite, and a reduction in fracture strength, which is the fundamental reason for the increased tendency of cracking.
4.2.5 Quenching Liquid Cooling Characteristics
When the cooling speed is too fast, large organizational stress will be generated due to the excessive speed of martensite transformation, causing the workpiece to deform or even crack. Therefore, the cooling speed should be slower during the martensite transformation period.
5. Monitoring Methods of Quenching Liquid Concentration
5.1 Refractive Index Method
Currently, the commonly used monitoring methods for the concentration of the quenching liquid include the refractive index method and the viscosity method. Due to the simple and convenient operation of the refractive index method, it is widely used in the production line. The production line can directly obtain the quenching concentration by using a handheld refractometer (see Figure 4). The specific operation steps are as follows:
- Zero Calibration: Before each measurement of concentration, the refractometer needs to be zero-calibrated. Drop tap water on the mirror surface of the refractometer, close the cover plate, observe the light-dark dividing line in the field of view, and use the zero adjustment screw to make the line coincide with the zero scale on the right side. Then, use a clean soft paper to thoroughly wipe and dry the moisture on the lens and cover plate.
- Measurement of Quenching Liquid Concentration: Drop the measured quenching liquid on the mirror surface, close the cover plate, read the scale value on the right side of the light-dark dividing line in the field of view, and multiply it by the fixed refractive index coefficient of the quenching liquid 1.9 to know the concentration of the measured quenching liquid.
5.2 Viscosity Method
The operation steps of the viscosity method are as follows:
- Sample Loading: Load the sample into a capillary viscometer with a clean and dry inner diameter that meets the requirements. During sample loading, put a rubber tube on the small glass branch pipe of the thick pipe, and use your index finger to block the mouth of the thick pipe. Invert the viscometer, extend the long glass tube with the capillary into the sample, and use a rubber bulb to suck the sample to the second scale (so that the liquid level is tangent to the scale), then place it upright, wipe the sample on the outside of the viscometer clean, and remove the rubber tube from the bracket and put it on the long glass tube with the capillary.
- Constant Temperature: Immerse the viscometer with the sample in a pre-prepared constant temperature bath (see Figure 5), and use a clamp to fix the viscometer on the bracket and adjust it to a vertical state. Keep the test temperature constant at ±0.1°C, and keep the sample at a constant temperature for about 15 minutes.
- Measurement: Suck the sample to the upper glass bulb, record the flow time of the sample from the first to the second scale, repeat the measurement until the second difference in the measurement time does not exceed 0.2%, and take the average of the two measurements.
- Calculation: At temperature T, the kinematic viscosity of the sample is V = Ct, where V is the kinematic viscosity of the sample (m^2/s), c is the viscosity meter constant (mm^2/s^2), and t is the flow time of the sample from the first to the second scale (s).
- Conversion of Viscosity and Concentration: The relationship between the concentration of a certain quenching liquid and the viscosity is shown in Figure 6. Through Figure 6, the actual quenching liquid concentration value can be converted.
5.3 Analysis of Concentration Errors
In the later stage of the use of the quenching liquid, the actual concentration obtained by the viscosity method is closer to the actual situation of the quenching liquid concentration. This is because all substances dissolved in water will change the refractive index of the aqueous solution, and the contribution of the solute to the refractive index of the solution is proportional to its concentration in the solution, while the total refractive index of the solution is the simple superposition value of the contributions of each solute to the refractive index of the solution. According to this rule, what is measured by the refractometer will be the total refractive index of all solutes in the solution. Since the quenching liquid is inevitable to be contaminated after use, soluble contaminants will also increase the refractive index of the solution. Thus, the refractive index after the use of the quenching liquid is composed of the contributions of four parts: polymer, additive, self-pollution of water, and external contaminants. The longer the use time of the quenching liquid, the more the amount of quenching, the more serious the pollution, and the higher the required refractive index of the refractometer. If this principle is not understood and the concentration of the quenching liquid is still controlled according to the reading of the refractometer when a new quenching liquid is prepared, quenching cracking will be caused due to the low concentration of the PAG polymer and the fast cooling speed.
Indeed, in practice, the production line found that after the quenching liquid was used for a certain period of time and was contaminated to a certain extent, the concentration measured by the refractometer would deviate from the actual concentration, and often be higher than the actual concentration. At this time, the kinematic viscosity and cooling characteristic curve of the quenching liquid should be used to check the “refractive index coefficient” of the quenching liquid. The error between the refractive index method concentration and the viscosity method concentration is shown in Table 1.
| Comparison | New Liquid | After Processing 20,000 Pieces | After Processing 90,000 Pieces |
|---|---|---|---|
| Refractive Index Method Concentration | 18 | 18 | 18 |
| Viscosity Method Concentration | 18 | 16 | 12 |
| Error | 0 | 2 | 6 |
Therefore, in actual production, with the increase in the use time of the quenching liquid, it is necessary to check the concentration of the quenching liquid and correct the refractive index coefficient instead of using the fixed refractive index coefficient of 1.9 for the new liquid. Currently, the actual monitoring method of a certain crankshaft production line is that the laboratory takes samples regularly on the production line every week, measures the concentration A through the kinematic viscosity method, measures the refractive index reading B through the refractive index method, and the refractive index coefficient c of the quenching liquid = concentration (viscosity) A / refractive index reading B. The updated refractive index coefficient c is then fed back to the production line for the daily calculation of the latest concentration value of the quenching liquid. Through this method, the production line monitors the change of the refractive index coefficient within the use cycle of the quenching liquid every week, forming a certain amount of big data statistics, as shown in Table 2. At the same time, the production line has tracked the change trend of the refractive index coefficient of the quenching liquid under different numbers of processed workpieces on the site for 6 times, providing a basis for troubleshooting in time in production to detect abnormal refractive index coefficients. The relationship between the refractive index coefficient of the quenching liquid and the number of quenched workpieces is shown in Figure 7.
6. Pollution and Prevention Measures of Quenching Liquid
6.1 Pollution Types
Common pollution of the quenching liquid can be divided into three categories: oil pollution, insoluble solid particle pollution, and water-soluble pollution. These should be handled according to the actual situation in production.
6.1.1 Oil Pollution
Generally, a small amount of oil floating on the liquid surface does not affect the cooling characteristics of the quenching liquid, but it can create conditions for the reproduction of anaerobic bacteria, making the quenching liquid smelly. Just use a clean newspaper to soak up the oil frequently. However, if soluble oil is mixed into the quenching liquid, it will seriously affect the cooling characteristics of the quenching liquid, causing cracking of the workpiece.
6.1.2 Insoluble Solid Particle Pollution
Mainly comes from the oxide scale brought in during the workpiece quenching process, which has little impact on the cooling characteristics of the quenching liquid. However, regular filtering and slag removal should be carried out in production. Suspended solid particles often increase the refractive index of the quenching liquid, so the refractive index of the quenching liquid should be measured after filtering.
6.1.3 Water-Soluble Pollution
It can change the color and refractive index of the quenching liquid, and has varying degrees of impact on the cooling characteristics of the quenching liquid (some soluble substances will change the formation characteristics of the PAG polymer film). Therefore, it should be avoided as much as possible. If such pollution occurs, the heating purification method can be used to restore the contaminated solution to normal by taking advantage of the reverse solubility of PAG. Therefore, the workpiece must be pre-cleaned before entering the quenching station, and the quality of the part should be concerned by detecting the cleanliness of the part.
6.2 Pollution Monitoring and Management
From Figure 7, it can be seen that with the increase in the number of quenched parts, the refractive index coefficient of the quenching liquid gradually decreases, indicating that the quenching liquid has been contaminated, and the slope of the decrease also reflects the speed of contamination of the quenching liquid. Therefore, the contamination of the quenching liquid should be paid more attention to in the daily processing of the production line.
7. Conclusion
This article analyzes the possible causes of the generation of crankshaft quenching cracks from various factors that affect the generation of crankshaft quenching cracks, including the blank, the previous rough machining, the quenching parameters, and the concentration of the quenching liquid, starting from the principle. Through research and analysis, the main reason for the generation of quenching cracks in a certain crankshaft production line is found to be the reduction of the actual concentration in the later stage of the use of the quenching liquid, which seriously affects the generation of crankshaft quenching cracks. Therefore, the concentration monitoring method of the quenching liquid has been changed, and the refractive index coefficient is updated by the viscosity method, while simultaneously paying attention to the contaminated situation of the quenching liquid. This has effectively solved the problem of crankshaft quenching cracks, and also accumulated experience and laid a foundation for solving other quality problems such as crankshaft heat treatment in the future.
To sum up, in the process of crankshaft induction hardening, a comprehensive consideration of various factors is required to ensure the quality of the crankshaft. The control of the quenching liquid concentration is a key point, and the selection of an appropriate monitoring method and regular pollution prevention and treatment can effectively reduce the occurrence of quenching cracks. At the same time, strict control of the heat treatment process parameters and attention to the quality of the blank and the machining process can further improve the reliability and performance of the crankshaft.