
In my work as a casting process engineer, I treat every thin-wall shell component as a coupled problem of geometry, alloy solidification, ceramic shell build-up, and gating feed. The part discussed here is a small investment casting with an outer envelope of 28 mm × 38 mm × 14 mm, a mass of approximately 6 g, a minimum wall thickness of 2 mm, and a maximum local thickness of 12 mm. The alloy is ZG35CrMnSi, and the customer requires magnetic particle inspection and X-ray inspection. The dominant quality issue I observed in the initial trials was shrinkage porosity at the thin plate and groove region. I have also reviewed similar geometries produced as lost foam castings, but the required surface finish, dimensional tolerance, and thin-wall integrity made investment casting the more suitable route for this shell component.
The core process strategy I adopted was to keep a continuous feed path from the gating system into the last-solidifying region, while simultaneously preventing refractory slurry and sand from accumulating in the narrow groove. The groove is beneficial for the function of the part, but it is harmful for shell making because it can bridge, thicken locally, and create an artificial hot spot. My optimization therefore combined gating changes, tree orientation, shell-building control, dewaxing discipline, and pouring practice. I also maintained a comparison mindset with lost foam castings because lost foam castings can sometimes reduce parting-line issues, but they do not automatically solve thin-wall feeding or shell-related heat extraction problems.
Component and Requirements
I first recorded the basic geometry and inspection requirements in a process sheet. The small size of the part does not mean that the solidification problem is small. In fact, a 6 g part with a 2 mm wall and a 12 mm hot section has a very large modulus contrast. The thin wall freezes quickly, while the thick hub or boss remains liquid longer. If the feed path is blocked by an oversized ceramic shell segment inside the groove, the thin plate cannot draw liquid metal from the gating system, and shrinkage porosity appears.
| Item | Value | Process Implication |
|---|---|---|
| Outer envelope | 28 mm × 38 mm × 14 mm | Small footprint, compact tree design |
| Mass | 6 g | Low thermal mass, fast cooling |
| Minimum wall | 2 mm | High risk of misrun and cold shut |
| Maximum wall | 12 mm | Hot spot and shrinkage porosity risk |
| Alloy | ZG35CrMnSi | Medium-carbon low-alloy cast steel |
| Inspection | Magnetic particle, X-ray | Surface and internal defect sensitivity |
| Main defect | Shrinkage porosity at thin plate | Requires feed-path and thermal control |
The required inspection level forced me to think beyond visual appearance. Magnetic particle inspection detects surface and near-surface discontinuities, while X-ray inspection reveals internal porosity, shrinkage, and inclusions. For a 2 mm wall, even a small pore can be a large fraction of the section thickness. This is why I treated the groove not only as a shell-making feature but also as a thermal and feeding feature.
Alloy and Solidification Behavior
ZG35CrMnSi is a cast medium-carbon alloy steel with chromium and manganese additions. I used the nominal composition window to estimate the freezing range, carbon equivalent, and shrinkage behavior. The alloy has sufficient hardenability and strength for the shell application, but its solidification interval means that the last liquid can remain in the hot section while the thin plate has already solidified. The feeding distance from the gate must therefore be short, and the gate must be placed at or near the hot spot.
| Element | Typical Range, wt.% | Role in Solidification |
|---|---|---|
| C | 0.30–0.40 | Controls freezing range and hardness |
| Mn | 0.80–1.20 | Improves hardenability, affects segregation |
| Si | 0.20–0.50 | Deoxidation, fluidity |
| Cr | 0.80–1.20 | Hardness, wear resistance |
| P | ≤0.035 | Segregation and hot tearing risk |
| S | ≤0.035 | Hot tearing and inclusion risk |
I estimated the carbon equivalent with a standard expression to compare the alloy with other cast steels and with lost foam castings that I have reviewed in the past. The carbon equivalent helps me anticipate how the alloy will feed and how sensitive it will be to section-size changes.
$$CE = C + \frac{Mn}{6} + \frac{Si}{24} + \frac{Ni}{40} + \frac{Cr}{5} + \frac{Mo}{4} + \frac{V}{14}$$
For this alloy, the chromium and manganese terms are not negligible. A higher carbon equivalent generally increases hardenability but can also increase segregation and shrinkage sensitivity. I therefore kept the pouring temperature under control and avoided excessive superheat. In lost foam castings, superheat can be used to compensate for foam decomposition, but in investment casting the ceramic shell already imposes a strong thermal resistance, so excessive superheat can worsen hot spots and gas defects.
The solidification time of a section can be approximated by Chvorinov’s rule:
$$t_s = K M^n$$
where \(t_s\) is solidification time, \(K\) is a mold constant, \(M\) is the section modulus, and \(n\) is an exponent typically between 1.5 and 2.0. The modulus is defined as the volume-to-surface-area ratio:
$$M = \frac{V}{A}$$
For the 2 mm wall, the modulus is very small. For the 12 mm hot section, the modulus is much larger. This difference drives the shrinkage porosity. I can express the modulus ratio as:
$$R_M = \frac{M_{hot}}{M_{thin}}$$
I estimated \(R_M\) to be well above 3 for the local thick-to-thin transition. A high \(R_M\) means that the thin plate solidifies long before the thick section finishes feeding. If the thick section is not fed directly, it will pull liquid from the thin plate and create porosity between the gates. This matched the X-ray defect location I observed.
Defect Mechanism and Thermal Analysis
The initial tooling and gating layout placed inner gates at several hot spots. Although the gate count seemed sufficient, the defect appeared between two gates in the thin plate region. My analysis was that the two adjacent gates did not establish a feed path through the thin plate because the plate itself solidified too quickly. At the same time, the groove was filled with ceramic slurry and sand during shell making. That filled groove became a thick ceramic insert inside the part envelope. During pouring and cooling, the ceramic insert reduced heat extraction from the inner side of the plate. The plate therefore cooled more slowly on one side, creating a local hot spot that had no direct gate.
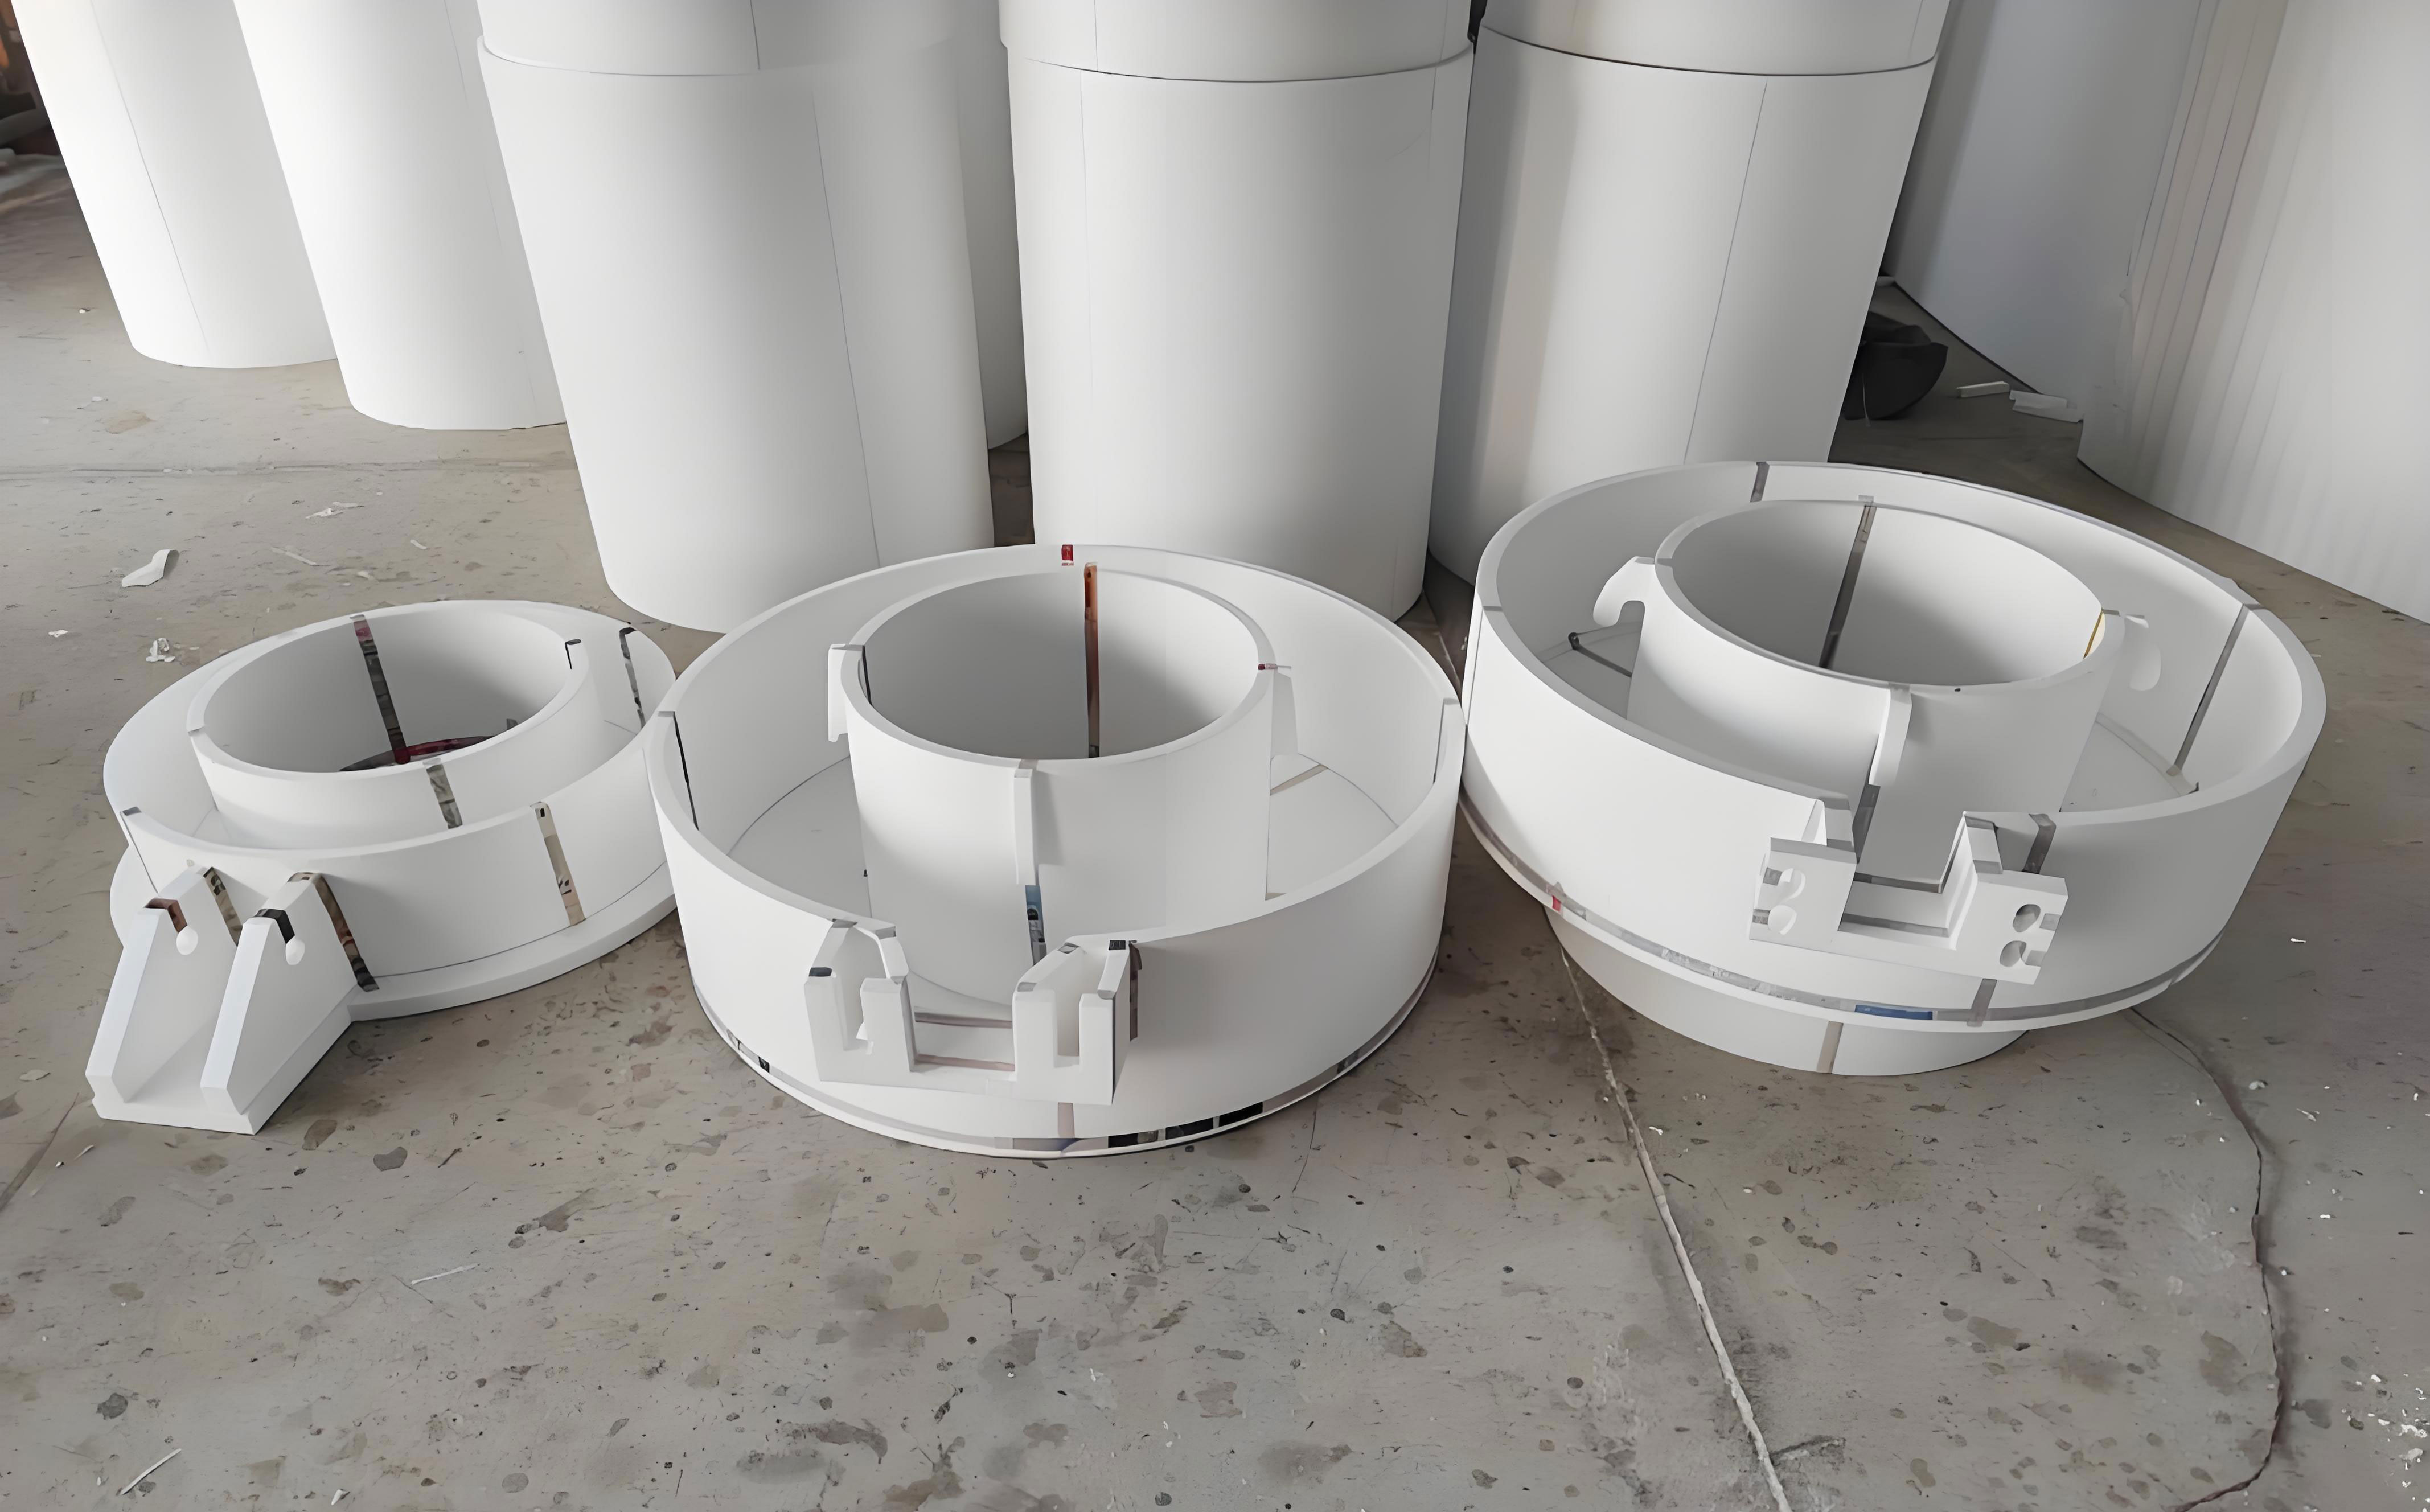
The figure below shows the shell casting geometry and the general location of the shrinkage defect that I used for process analysis.
I summarized the defect mechanism in terms of four coupled factors:
| Factor | Effect | Result |
|---|---|---|
| Thin 2 mm plate | Rapid solidification | Feed path closes early |
| Thick 12 mm section | Late solidification | Liquid demand remains high |
| Groove filled by shell | Local insulation | Artificial hot spot |
| Gate location between defects | No direct feed to plate | Shrinkage porosity |
I also considered the heat transfer across the ceramic shell. The heat flux through the shell can be written as:
$$q = \frac{T_{metal} – T_{ambient}}{\frac{x_{shell}}{k_{shell}} + \frac{1}{h_{outer}}}$$
where \(x_{shell}\) is shell thickness, \(k_{shell}\) is shell thermal conductivity, and \(h_{outer}\) is the external heat-transfer coefficient. When the groove is filled with extra slurry and sand, \(x_{shell}\) increases locally. The denominator increases, so \(q\) decreases. That local reduction in heat flux keeps the metal hotter for a longer time. In lost foam castings, the foam pattern is consumed and the refractory coating is relatively thin and uniform; in investment casting, however, the shell is built layer by layer, and a narrow groove can easily accumulate excess ceramic. This is a key difference between lost foam castings and investment castings for this type of feature.
I used a simple thermal resistance network to compare the normal shell and the filled groove:
$$R_{total} = \frac{x_{shell}}{k_{shell}} + \frac{1}{h_{outer}}$$
$$q = \frac{\Delta T}{R_{total}}$$
If the groove filling doubles the effective shell thickness, the thermal resistance increases roughly in proportion to the thickness, and the local cooling rate decreases. I therefore made two changes: first, I oriented the groove outward on the tree so that it would not trap slurry; second, I added a dedicated inner gate at the groove-side hot spot. The added gate created a direct feed path and also changed the local thermal gradient in a favorable direction.
Gating System Design and Optimization
The original gating design placed three inner gates around the part, with the gates aimed at the thicker sections. The defect still occurred between two gates because the thin plate did not have a local feed path. In the optimized design, I added one inner gate at the groove location. I kept the added gate compact so that it would not create a large contact area or a difficult cleaning operation. The final inner gate cross-section was 4 mm × 12 mm. I positioned it on a flat surface, avoiding the functional surfaces, and left a small residual gate stub that could be removed by grinding after cut-off.
| Parameter | Original Design | Optimized Design |
|---|---|---|
| Number of inner gates | 3 | 4 |
| Gate at groove | No | Yes |
| Added gate size | — | 4 mm × 12 mm |
| Gate contact location | Hot spots only | Hot spot plus groove-side plate |
| Feed path to thin plate | Indirect | Direct |
| Cleaning risk | Lower | Controlled by flat placement |
I also optimized the tree. The tree used a \(\phi 30\) mm runner bar. The optimized and original trees both contained 12 parts per tree, but I maintained a distance of at least 25 mm between each casting and the runner bar. This distance is important because the runner bar has a large thermal mass. If the casting is too close, the runner bar radiates heat to the casting and can delay local solidification. That delays feeding and can create a hot spot. In lost foam castings, gating is often integrated into the foam pattern and can be more flexible in orientation, but in investment casting the tree geometry directly affects shell drying and heat transfer.
I placed the groove outward on the tree. This gave three benefits. First, during slurry dipping and draining, the groove could drain freely. Second, during sanding, the operator could see whether the groove was properly coated. Third, during drying, air could flow through and around the groove. If the groove faced inward, it would be shadowed by the tree and would dry unevenly. Uneven drying can cause shell cracking, and a cracked shell can lead to run-out or sand inclusion. I have seen similar problems in lost foam castings when the coating is not uniformly dried, but the mechanism there is different because the pattern is expendable and the coating is not a thick ceramic shell.
The pouring system must satisfy the flow-rate requirement without turbulent damage to the shell. I estimated the required gate area from the pouring time and the metal velocity:
$$A_g = \frac{W}{\rho t v}$$
where \(W\) is the casting mass plus gating mass, \(\rho\) is the liquid steel density, \(t\) is the pouring time, and \(v\) is the gate velocity. I kept the gate velocity moderate to avoid turbulence. The velocity from a gravity-poured sprue can be approximated by:
$$v = C_d \sqrt{2 g h}$$
where \(C_d\) is the discharge coefficient, \(g\) is gravitational acceleration, and \(h\) is the effective metal head. For small investment castings, the effective head is limited by the flask height and the tree height. I therefore increased feed security by placing gates at the hot spots rather than by increasing the metal head excessively. In lost foam castings, the gating ratio can be adjusted to control foam decomposition and metal front velocity, but in investment casting the main goals are shell integrity, low turbulence, and directional feeding.
I also checked the Reynolds number in the gate:
$$Re = \frac{\rho v D}{\mu}$$
where \(D\) is the hydraulic diameter and \(\mu\) is the dynamic viscosity. I aimed to avoid very high \(Re\) because high turbulence can entrain gas and erode the shell. The optimized gate size was large enough to fill the casting but not so large that it created a new hot spot. This balance is important for thin-wall shell castings and for lost foam castings that are converted to investment casting.
| Gating Check | Symbol | Target or Result |
|---|---|---|
| Pouring time | \(t\) | Short, controlled by tree size |
| Gate velocity | \(v\) | Moderate, avoid turbulence |
| Gate area | \(A_g\) | Sufficient for 6 g part plus feed |
| Reynolds number | \(Re\) | Kept below severe turbulence range |
| Feed distance | \(L_f\) | Direct gate at hot spot |
Shell Making Process
The shell-making process is where the groove problem becomes most visible. I used five principal layers plus a final seal layer. The face coat used zircon powder and zircon sand. The backup layers used mullite powder and mullite sand. The slurry viscosity was controlled layer by layer. The face coat viscosity was 36 s, and the backup viscosities decreased from 15 s to 12 s and finally to 10 s for the seal coat. This schedule gave a strong, permeable shell without excessive thickness in the groove.
| Layer | Powder and Size, mesh | Slurry Viscosity, s | Sand and Size, mesh |
|---|---|---|---|
| 1 | Zircon powder, 320 | 36 | Zircon sand, 120 |
| 2 | Mullite powder, 200 | 15 | Mullite sand, 30–60 |
| 3 | Mullite powder, 200 | 12 | Mullite sand, 16–30 |
| 4 | Mullite powder, 200 | 12 | Mullite sand, 16–30 |
| 5 | Mullite powder, 200 | 12 | Mullite sand, 16–30 |
| 6 | Mullite powder, 200 | 10 | None, seal |
During face-coat dipping, I paid special attention to the groove. The operator had to avoid air entrapment and slurry bridging. If the slurry bridged across the groove, the subsequent sand would reinforce the bridge and create a thick ceramic web. That web would not dry uniformly, and during burn-out or pouring it could crack. I instructed the operator to use controlled dipping and to inspect the groove under good lighting. I also used compressed air before transition and backup dips to clear loose sand from the groove. A soft brush was used when necessary to remove sand from corners.
The drying of the face coat is critical. I controlled the drying room temperature, humidity, and air velocity. The air velocity was maintained at 3–5 m/s. This range is high enough to remove moisture from the surface but not so high that it causes skinning or case hardening. The drying rate can be expressed as:
$$\dot{m} = h_m A \left( Y_s – Y_\infty \right)$$
where \(\dot{m}\) is the moisture removal rate, \(h_m\) is the mass-transfer coefficient, \(A\) is the surface area, \(Y_s\) is the surface moisture content, and \(Y_\infty\) is the bulk air moisture content. If the groove faces inward, the local air velocity is low, so \(h_m\) is low. That leads to slow drying. If the groove faces outward, the air can sweep the groove, and drying is more uniform. This orientation choice alone reduced the risk of shell cracking and local thickness variation.
I also controlled the shell stress during drying and burn-out. The thermal stress can be approximated by:
$$\sigma = E \alpha \Delta T$$
where \(E\) is the elastic modulus, \(\alpha\) is the coefficient of thermal expansion, and \(\Delta T\) is the temperature difference across the shell. A thick shell in the groove will have a larger \(\Delta T\) during heating and cooling because heat diffusion is slower. That increases stress and can cause cracks. By keeping the groove free of excess ceramic, I reduced \(\Delta T\) and improved shell reliability. In lost foam castings, the refractory coating is much thinner than an investment shell, so this particular stress problem is less severe, but lost foam castings can still suffer coating spalling if the coating is too thick or dried incorrectly.
The seal coat was kept thin. Its purpose was to bind the surface and prevent sand fall-off, not to add strength by excessive thickness. A seal coat that is too thick reduces shell permeability and can cause gas defects. I required that the seal coat be just heavy enough to prevent loose sand. This is a general rule I apply to thin-wall investment castings and to lost foam castings where coating permeability matters.
Dewaxing Process
Dewaxing is a short but severe operation. The shell must be transferred from the shell-making room to the dewaxing autoclave in 60 s or less. I placed the shell with the pouring cup facing down in the dewaxing car. The car must not be overloaded, and the shells must be stable. A rapid and stable transfer prevents wax from cooling and expanding inside the shell, which could crack the shell. I set the autoclave parameters within a narrow window.
| Parameter | Set Value |
|---|---|
| Inner vessel temperature | 175–185 °C |
| Steam boiler pressure upper limit | 0.8 ± 0.1 MPa |
| Steam boiler pressure lower limit | 0.76 ± 0.1 MPa |
| Autoclave charging time | 1 000 ± 20 s |
| Dewaxing time | 20 ± 5 s |
| Drain preheat pressure | 0.05–0.06 MPa |
| Wax drain time | 100–500 s |
| Water drain time | 50 ± 2 s |
I used the steam pressure to estimate the saturation temperature and the available heat for wax melting:
$$Q = m_w \left[ c_{p,w} \left( T_m – T_0 \right) + L_w \right]$$
where \(m_w\) is the wax mass, \(c_{p,w}\) is the specific heat of wax, \(T_m\) is the melting temperature, \(T_0\) is the initial temperature, and \(L_w\) is the latent heat of fusion. The autoclave must supply this heat quickly enough to melt the wax before the shell expands excessively. If the wax is not removed quickly, the shell can crack. I also ensured that the drain lines were clear and that the wax did not solidify in the shell. In lost foam castings, the pattern is vaporized or burned out rather than melted out, but the principle of rapid and complete pattern removal is similar. Both lost foam castings and investment castings require clean pattern removal to avoid gas defects.
Melting and Pouring
I used a medium-frequency induction furnace with mother alloy bars. The melting practice was designed to give clean steel, controlled superheat, and reproducible pouring. I checked the furnace lining, cooling water, tilting mechanism, and temperature measurement system before melting. The charge was placed so that the top of the mother alloy bar did not exceed the induction coil height. I started at about 60% power, waited for the current to stabilize, and then increased to full power.
The pouring temperature was set at 1 630 ± 10 °C. The shell preheat temperature was 1 050 ± 10 °C, and the shell preheat time was 50 ± 5 min. The shell was poured directly from the induction furnace after removal from the burn-out furnace. After pouring, the shell was placed on a sand bed to cool naturally. I added an exothermic covering agent to the pouring cup to keep the sprue liquid longer and improve feeding. This is especially important for a small part with a thin plate because the feed path can freeze quickly.
| Melting and Pouring Parameter | Set Value |
|---|---|
| Melting method | Medium-frequency induction furnace |
| Charge material | Mother alloy steel bar |
| Initial power | 60% |
| Pouring temperature | 1 630 ± 10 °C |
| Shell preheat temperature | 1 050 ± 10 °C |
| Shell preheat time | 50 ± 5 min |
| Pouring method | Gravity pouring |
| Cooling method | Sand bed, natural cooling |
| Covering agent | Exothermic, in pouring cup |
I estimated the heat content required to superheat and melt the charge:
$$Q = m \left[ c_s \left( T_m – T_0 \right) + L_f + c_l \left( T_p – T_m \right) \right]$$
where \(m\) is the mass, \(c_s\) is the solid specific heat, \(T_m\) is the melting temperature, \(T_0\) is the initial temperature, \(L_f\) is the latent heat of fusion, \(c_l\) is the liquid specific heat, and \(T_p\) is the pouring temperature. This equation helped me set the power and time. It also helped me understand why excessive pouring temperature is not desirable. A higher \(T_p\) adds heat, but it also increases the risk of shell reaction, gas defects, and hot tearing. In lost foam castings, the pouring temperature must also be balanced against foam decomposition, but the optimal window is different because the pattern is expendable.
I also considered the cooling rate after pouring. The heat flux from the casting to the shell and then to the sand bed can be approximated by a lumped model. For small castings, the Biot number may not be small, so I used the general cooling equation:
$$\frac{T – T_\infty}{T_i – T_\infty} = f \left( Bi, Fo \right)$$
where \(Bi = hL/k\) and \(Fo = \alpha t/L^2\). The thin plate has a small \(L\), so it cools quickly. The thick section has a larger \(L\), so it cools slowly. The added gate at the groove changed the local boundary condition by providing a hot metal reservoir next to the thin plate. That reservoir fed the plate as it solidified and reduced the porosity.
Trial Results
I ran trial production with the original and optimized gating designs. Each design was tested in five groups, with 60 parts per design. The original design produced only 6 acceptable parts, a yield of 10%. The optimized design produced 52 acceptable parts, a yield of 86.7%. The main scrap mode before optimization was X-ray shrinkage porosity in the 2 mm plate region. After optimization, the same region showed acceptable internal quality, and the main remaining scrap was related to handling and shell defects, which I addressed with process discipline.
| Design | Parts Poured | Acceptable Parts | Yield, % | Main Defect |
|---|---|---|---|---|
| Original | 60 | 6 | 10.0 | Shrinkage porosity in thin plate |
| Optimized | 60 | 52 | 86.7 | Minor shell and handling defects |
I then implemented the optimized process for batch production. With refined operation, the first-pass yield reached above 95%. The improvement came from three changes. First, the added inner gate established a direct feed path to the thin plate and groove-side hot spot. Second, the groove was oriented outward on the tree, which reduced slurry and sand accumulation. Third, the shell drying and dewaxing parameters were tightened to reduce shell cracking and local thickness variation. These changes are all consistent with good practice for thin-wall shell castings and contrast with many lost foam castings, where the pattern and coating system impose different constraints.
I also compared the defect location before and after optimization. Before optimization, the defect was located between two gates, which showed that the gates were not feeding the thin plate effectively. The groove was filled with shell material, creating an insulated region. After optimization, the added gate was placed at the groove, and the groove was kept open during shell making. The result was a local feed path and better heat extraction. The X-ray images showed a clear reduction in porosity. I used a simple porosity index to quantify the improvement:
$$P_I = \frac{A_p}{A_s} \times 100\%$$
where \(A_p\) is the projected area of porosity and \(A_s\) is the projected area of the inspected section. The original design had a high \(P_I\) in the thin plate, while the optimized design had a \(P_I\) below the acceptance limit. I also used a severity rating for X-ray defects:
$$S = \sum_{i=1}^{n} w_i c_i$$
where \(w_i\) is the weight for defect type \(i\), and \(c_i\) is the count or size. The optimized process reduced \(S\) significantly. These metrics helped me communicate the improvement to the production team and to maintain traceability.
Process Control and Quality Assurance
For production, I established controls at every stage. The wax pattern must be clean and free of flash. The tree must maintain the required distance from the runner bar. The groove must face outward. The face-coat viscosity must be checked every shift. The drying room temperature, humidity, and air velocity must be recorded. The dewaxing transfer time must be under 60 s. The burn-out temperature and time must be within the specified window. The pouring temperature must be measured before each pour. The shell must be handled carefully after burn-out to avoid cracking. These controls are not unique to this part, but they are essential for a thin-wall shell casting.
| Control Point | Target | Frequency |
|---|---|---|
| Face-coat viscosity | 36 s | Every shift |
| Backup slurry viscosity | 15, 12, 12, 12 s | Every shift |
| Drying air velocity | 3–5 m/s | Continuous |
| Dewaxing transfer time | ≤60 s | Every cycle |
| Shell preheat temperature | 1 050 ± 10 °C | Every batch |
| Shell preheat time | 50 ± 5 min | Every batch |
| Pouring temperature | 1 630 ± 10 °C | Every pour |
| X-ray inspection | No shrinkage above limit | Per sampling plan |
| Magnetic particle inspection | No relevant indications | Per sampling plan |
I used statistical process control to monitor the yield. The process capability can be expressed as:
$$C_p = \frac{USL – LSL}{6 \sigma}$$
$$C_{pk} = \min \left( \frac{USL – \mu}{3 \sigma}, \frac{\mu – LSL}{3 \sigma} \right)$$
where \(USL\) and \(LSL\) are the upper and lower specification limits, \(\mu\) is the process mean, and \(\sigma\) is the process standard deviation. For a casting process, the specification limits might be wall thickness, porosity size, or dimensional tolerance. I monitored the critical dimensions and the X-ray porosity rating. When the process drifted, I checked the slurry viscosity, drying conditions, and pouring temperature first. These are the variables that most often affect thin-wall shell castings. In lost foam castings, the same statistical approach applies, but the critical variables may include foam density, coating weight, and sand compaction.
Comparison with Lost Foam Castings
I have evaluated lost foam castings for similar small components, and I often compare the two processes when selecting a manufacturing route. Lost foam castings can offer design freedom, reduced parting lines, and the ability to integrate features. However, for a 2 mm wall with a narrow groove and a 12 mm hot section, lost foam castings present different risks. The foam pattern must decompose cleanly, the coating must be uniform, and the sand must support the thin wall without distortion. The investment casting route gave me better control over the shell in the groove, better surface finish, and better dimensional repeatability for this particular shell component.
| Consideration | Investment Casting | Lost Foam Castings |
|---|---|---|
| Thin-wall capability | Excellent for 2 mm walls with proper feed | Possible, but foam and coating must be controlled |
| Groove feature | Risk of slurry bridging and local thick shell | Risk of coating bridging and incomplete foam removal |
| Surface finish | Very good with zircon face coat | Good, but depends on coating and sand |
| Internal soundness | Direct gating and shell control improve feeding | Feeding depends on pattern and gating design |
| Tooling | Wax pattern die required | Foam pattern die required |
| Inspection | X-ray and magnetic particle are straightforward | X-ray and magnetic particle also possible |
| Best application | Small, thin, complex, high-integrity parts | Medium to large parts with integrated features |
I do not treat lost foam castings as a direct substitute for investment casting in this case. The alloy, wall thickness, and inspection requirements favor investment casting. However, knowledge from lost foam castings is still useful. In lost foam castings, the coating must be permeable so that foam decomposition gases can escape. In investment casting, the shell must be permeable so that wax removal and gas venting are effective. In both lost foam castings and investment castings, the gate must feed the last solidifying region. The difference is in the pattern material, shell or coating architecture, and heat-transfer path. I mention lost foam castings repeatedly because it is a useful reference process, but for this shell casting the investment casting route is the one I selected and optimized.
I also compared the thermal resistance of the two processes. In lost foam castings, the coating is thin and the sand is in direct contact with the coating, so the effective heat-transfer coefficient is relatively high. In investment casting, the ceramic shell is thicker, and the shell must be preheated. The shell preheat reduces the thermal shock and helps fill thin walls, but it also reduces the cooling rate. I therefore had to balance shell preheat against the risk of hot spots. The optimized process used a shell preheat of 1 050 ± 10 °C, which is high enough to fill the 2 mm wall but not so high that the 12 mm section remains liquid too long. The added gate provided the feed path that the shell preheat alone could not provide.
Additional Thermal and Feeding Calculations
I extended the thermal analysis to estimate the local solidification time and the feeding distance. The local solidification time can be written as:
$$t_f = \frac{\rho L}{h \left( T_m – T_0 \right)} \left( \frac{V}{A} \right)$$
where \(t_f\) is the freezing time, \(\rho\) is density, \(L\) is latent heat, \(h\) is the heat-transfer coefficient, \(T_m\) is the melting temperature, \(T_0\) is the mold temperature, and \(V/A\) is the modulus. For the thin plate, \(V/A\) is small, so \(t_f\) is short. For the thick section, \(t_f\) is long. The feed path must remain open until the thick section solidifies. The feed distance can be approximated by:
$$L_f = k \sqrt{M}$$
where \(L_f\) is the feeding distance, \(k\) is an alloy-dependent constant, and \(M\) is the modulus of the feeding section. The added gate reduced the effective feed distance from the thick section to the thin plate. In effect, it changed the local hot spot into a fed hot spot. The gate acted as a riser that was connected directly to the thin plate. This is a standard approach in investment casting and is also used in lost foam castings, although the gating design in lost foam castings must account for foam decomposition.
I also estimated the shrinkage volume:
$$V_s = \alpha_v V_c \Delta T$$
where \(V_s\) is the shrinkage volume, \(\alpha_v\) is the volumetric contraction coefficient, \(V_c\) is the casting volume, and \(\Delta T\) is the temperature change during solidification. The thick section has a larger \(V_c\) and a larger local \(\Delta T\), so it requires more feed metal. The thin plate has a smaller \(V_c\) but a higher surface-to-volume ratio, so it solidifies quickly. If the thick section is not fed directly, it pulls metal from the thin plate and creates porosity. The optimized gate supplied the necessary feed metal to the thick section and the adjacent plate.
I used a feeding criterion to check the design:
$$F = \frac{V_f}{V_s}$$
where \(V_f\) is the available feed volume and \(V_s\) is the required shrinkage volume. I aimed for \(F > 1\). The original design had \(F\) close to 1 or less in the local plate region because the feed path was blocked. The optimized design increased \(F\) by adding a gate and by improving the shell heat extraction. This is a simple but useful way to compare gating designs. In lost foam castings, the same criterion applies, but the feed volume must be calculated with the lost foam pattern and coating in mind.
Microstructural Considerations
The alloy ZG35CrMnSi can develop different microstructures depending on cooling rate. The thin plate cools quickly, so it may have finer grains and higher hardness. The thick section cools slowly, so it may have coarser grains and more segregation. Shrinkage porosity often appears in the slow-cooling region because the last liquid has nowhere to go. I therefore checked the cooling rate and the local solidification time. The cooling rate can be approximated by:
$$\dot{T} = \frac{dT}{dt}$$
For a thin section, \(\dot{T}\) is high. For a thick section, \(\dot{T}\) is low. The difference in cooling rate can be estimated from the moduli:
$$\frac{\dot{T}_{thin}}{\dot{T}_{thick}} \approx \left( \frac{M_{thick}}{M_{thin}} \right)^n$$
With \(n\) around 1.5 to 2.0, a modulus ratio above 3 gives a cooling rate ratio of about 5 to 9. That means the thin plate solidifies several times faster than the thick section. The added gate compensated for this by placing a hot reservoir next to the thin plate. It also reduced the temperature gradient between the thin plate and the thick section. The result was a more uniform solidification pattern and fewer shrinkage defects.
I also considered the effect of shell thickness on microstructure. A thicker shell in the groove reduces heat extraction and can produce a coarser microstructure. By avoiding slurry bridging, I kept the shell thickness more uniform. This helped the thin plate cool at the intended rate and reduced the local hot spot. In lost foam castings, the coating thickness also affects cooling, but the coating is much thinner, and the sand surrounding the pattern provides a different thermal environment.
Production Implementation
I implemented the optimized process in production with a training session for the shell-making and pouring operators. The key points were:
| Operation | Requirement | Reason |
|---|---|---|
| Tree orientation | Groove faces outward | Improves slurry drainage, sanding, and drying |
| Slurry control | Check viscosity and avoid bridging | Prevents local thick shell |
| Sand cleaning | Use compressed air or brush in groove | Removes loose sand and avoids shell bridging |
| Drying | 3–5 m/s air velocity, controlled humidity | Uniform drying and crack prevention |
| Dewaxing | Transfer within 60 s | Prevents wax expansion cracking |
| Burn-out | 1 050 ± 10 °C for 50 ± 5 min | Removes wax and preheats shell |
| Pouring | 1 630 ± 10 °C | Fills thin wall without excessive superheat |
| Cooling | Sand bed and exothermic cover | Improves feeding and reduces shrinkage |
I also set a sampling plan for X-ray and magnetic particle inspection. The first three batches were inspected at a higher frequency to confirm the process. Once the process was stable, I reduced the inspection frequency to the customer requirement. The first-pass yield remained above 95%. Any deviation in yield triggered a root-cause investigation. The most common causes of deviation were slurry viscosity drift, drying room humidity changes, and pouring temperature variation. These are typical for investment casting and for lost foam castings, although the specific variables differ.
Defect Prevention Summary
I summarized the defect prevention measures in a table for the production team. The table links each defect to its cause and the control action.
| Defect | Cause | Control Action |
|---|---|---|
| Shrinkage porosity in thin plate | No direct feed, local hot spot from filled groove | Add inner gate at groove, orient groove outward |
| Shell bridging in groove | Slurry and sand accumulation | Compressed air cleaning, brush, controlled dipping |
| Shell cracking | Uneven drying, thick shell, rapid dewaxing | Control air velocity, thin seal coat, rapid transfer |
| Gas porosity | Low shell permeability, excessive seal coat | Keep seal coat thin, control burn-out |
| Misrun in thin wall | Low pouring temperature, low shell preheat | Use 1 630 ± 10 °C and 1 050 ± 10 °C |
| Sand inclusion | Loose sand in groove, shell spalling | Clean groove, control drying and handling |
I also created a process flow chart in text form for the operators:
Wax pattern → tree assembly with groove outward → face coat → face sand → transition layers → backup layers → seal coat → drying → dewaxing → burn-out → pouring → sand cooling → cut-off → grinding → inspection → magnetic particle and X-ray → packaging.
Each step has a hold point. If a hold point is not met, the shell is quarantined. This is important for a part with thin walls and internal inspection requirements. In lost foam castings, a similar flow exists, but the pattern is foam and the coating is applied to the foam rather than to a wax pattern. The process control logic is similar, but the material behavior is different.
Economic and Quality Comparison
I compared the original and optimized processes in terms of quality and cost. The original process had a very low yield, so the effective cost per good part was high. The optimized process had a higher yield, which reduced rework, inspection cost, and scrap. The added gate required a small amount of extra grinding, but the cost was much lower than the cost of scrap. The improved shell control also reduced shell cracking and sand inclusion, which further improved the yield.
| Metric | Original | Optimized | Improvement |
|---|---|---|---|
| First-pass yield | 10% | 86.7% in trial, >95% in production | Large increase |
| X-ray shrinkage | High | Low | Significant |
| Shell bridging | Frequent | Rare | Significant |
| Cleaning time | Lower | Slightly higher | Acceptable |
| Scrap cost | High | Low | Major saving |
| Process stability | Poor | Good | Improved |
I also estimated the cost of scrap using a simple equation:
$$C_{scrap} = N_{scrap} \left( C_m + C_l + C_s + C_i \right)$$
where \(N_{scrap}\) is the number of scrapped parts, \(C_m\) is material cost, \(C_l\) is labor cost, \(C_s\) is shell cost, and \(C_i\) is inspection cost. Reducing \(N_{scrap}\) from 54 to 8 in the trial reduced \(C_{scrap}\) by a large factor. In production, the higher yield reduced the cost per good part even further. This economic benefit is one reason I prefer to solve feeding problems with process design rather than by sorting or rework. The same principle applies to lost foam castings and to investment casting.
Conclusion
For this thin-wall shell casting, I found that the shrinkage porosity was not caused by a single variable. It was caused by the combination of a thin 2 mm plate, a thick 12 mm section, a groove that trapped ceramic slurry, and a gating system that did not provide a direct feed path to the critical region. The original design placed gates at hot spots but left the plate between gates without local feed. The groove was filled with shell material, which created an artificial hot spot and reduced heat extraction. The result was X-ray shrinkage porosity.
My optimized design added a 4 mm × 12 mm inner gate at the groove, oriented the groove outward on the tree, controlled the shell-making process to prevent bridging, maintained a 25 mm minimum distance from the runner bar, used a five-layer plus seal shell, controlled drying at 3–5 m/s, transferred shells to dewaxing within 60 s, preheated shells to 1 050 ± 10 °C for 50 ± 5 min, and poured at 1 630 ± 10 °C with an exothermic cover. The trial yield increased from 10% to 86.7%, and production yield exceeded 95% after fine-tuning.
The broader lesson is that thin-wall investment castings require simultaneous control of feed paths and shell geometry. The groove must be treated as both a feature and a process risk. If the groove faces inward, it can trap slurry and sand, dry unevenly, and create a hot spot. If it faces outward, it can drain, dry, and be inspected. The gate must be placed at the hot spot, and the feed path must remain open until the thick section solidifies. These principles are also relevant to lost foam castings, although lost foam castings have different pattern removal and coating behavior. I therefore continue to use knowledge from lost foam castings as a comparison, but for this component the optimized investment casting process is the robust production route.
In future work on similar shell castings, I would apply the same approach: calculate the modulus ratio, identify the last-solidifying region, check the shell build-up in every narrow feature, orient the tree for drainage and drying, and verify the gating with trial pours and X-ray inspection. I would also keep the process window documented and use statistical control to detect drift. This method provides a reliable path from defect analysis to production qualification for thin-wall shell castings and supports the quality requirements of magnetic particle and X-ray inspection.