
I approached the K403 shell casting problem as a fully integrated investment casting development task rather than as a single foundry operation. The part is a complex aerospace-style shell with a tall support column, multiple cylindrical features, abrupt section changes, and several hot spots. My starting point was the observation that a conventional investment casting route can produce excellent dimensional fidelity and metallurgical quality only when wax injection, shell building, dewaxing, preheating, melting, pouring, and cooling are treated as one coupled thermal and dimensional system. I also used evaporative pattern casting as a comparative benchmark because evaporative pattern casting eliminates the wax pattern and shell removal sequence in a different way, and the comparison helped me isolate which defects were caused by my pattern tooling, which by shell restraint, and which by solidification feeding. In my experience, evaporative pattern casting is not the selected process for this K403 shell casting, but evaporative pattern casting provides a useful conceptual reference for pattern elimination, dimensional stability, and mold filling behavior. I therefore kept evaporative pattern casting in the background of my analysis while focusing the actual production route on investment casting.
The alloy is a nickel-base cast superalloy with significant chromium, cobalt, tungsten, molybdenum, titanium, and aluminum additions. The solidification interval is wide enough to create feeding difficulty, and the precipitation of gamma-prime phases increases sensitivity to cooling rate. The shell geometry creates a thermal field that is highly non-uniform. The thin sections cool quickly and can generate cold shuts, while the thick sections cool slowly and can generate shrinkage porosity. My first task was to quantify the geometry and the alloy response so that the process windows would not be based on trial and error alone.
| Element | Nominal Content Range, wt.% | Role in K403 Shell Casting |
|---|---|---|
| C | 0.11–0.18 | Controls carbide formation and grain-boundary behavior |
| Cr | 10.00–12.00 | Oxidation resistance and corrosion resistance |
| Co | 4.50–6.00 | Solid-solution strengthening and phase stability |
| W | 4.80–5.50 | Refractory strengthening and creep resistance |
| Mo | 3.80–4.50 | Solid-solution strengthening |
| Ti | 2.30–2.90 | Gamma-prime formation |
| Al | 5.30–5.90 | Gamma-prime formation and oxidation resistance |
| Ce | ≤0.01 | Trace impurity control |
| Fe | ≤2.00 | Residual element control |
| Si | ≤0.50 | Residual element control |
| Mn | ≤0.50 | Residual element control |
| S | ≤0.01 | Hot-cracking and boundary control |
| P | ≤0.02 | Hot-cracking and boundary control |
| Ni | Balance | Base matrix |
The casting envelope is deceptively simple when viewed as a single outer shape. The support column is approximately 129 mm in height, the overall length is approximately 111 mm, the largest diameter is approximately 32 mm, the smallest diameter is approximately 14 mm, and the nominal wall thickness is approximately 6.5 mm. However, the part contains multiple local masses, intersecting cylinders, and non-uniform wall transitions. Those features produce thermal gradients that vary strongly with position. I summarized the main geometric and process difficulty factors in a structured table because the relationships between geometry, heat extraction, and feeding distance determine whether porosity, cold shuts, cracks, or dimensional drift will dominate.
| Feature | Approximate Value | Process Consequence |
|---|---|---|
| Support column height | 129 mm | Long vertical filling path and directional thermal gradient |
| Overall length | 111 mm | Dimensional stability sensitivity |
| Maximum diameter | 32 mm | Local thermal mass and feeding demand |
| Minimum diameter | 14 mm | Rapid cooling and potential cold shut |
| Nominal wall thickness | 6.5 mm | Moderate section with hot-spot transitions |
| Hot spot count | Multiple | Shrinkage porosity and crack risk |
| Core and mold complexity | High | Shell cracking, flash, and run-out risk |
| Dimensional tolerance demand | High | Wax assembly error and shell restraint sensitivity |
I identified three principal technical difficulties. First, the geometry makes pattern extraction difficult, and any mismatch in wax assembly can translate directly into dimensional distortion after casting. Second, the shell can crack or flash because the mold experiences local stress concentrations during filling and cooling. Third, the multiple hot spots make feeding difficult, so shrinkage porosity, cold shuts, and cracks can occur simultaneously. These difficulties are not independent. A wax assembly error can change the local section thickness, which changes the thermal field, which then changes porosity and crack susceptibility. For this reason, I treated dimensional control and metallurgical control as one problem.
| Technical Difficulty | Primary Mechanism | Observed Risk | My Countermeasure Direction |
|---|---|---|---|
| Complex geometry and pattern extraction | Restricted tool motion and manual wax joining | Dimensional deviation and deformation | One-piece wax pattern tooling and tighter injection control |
| Shell stress during pouring | Local shell thickness variation and thermal shock | Shell cracking, run-out, flash, and fins | Controlled shell lay-up and local shell thinning |
| Multiple hot spots | Slow local cooling and insufficient feeding | Porosity, cracks, and cold shuts | Thermal-gradient control and optimized pouring |
| Thin-to-thick transitions | Non-uniform solidification rate | Cold shut and incomplete filling | Higher shell preheat and faster pouring |
| Dimensional tolerance stack-up | Wax shrinkage, shell expansion, alloy contraction | Size out-of-tolerance | Integrated tool compensation and process capability study |
To make the process quantitative, I used several standard relationships. The cooling rate at a point in the casting can be written as
$$\dot{T}=\frac{\partial T}{\partial t},$$
and the local thermal gradient is
$$G=\nabla T.$$
The solidification time under a Chvorinov-type approximation is
$$t_s=B\left(\frac{V}{A}\right)^n,$$
where \(V\) is the casting volume, \(A\) is the heat-transfer surface area, \(B\) is a mold constant, and \(n\) is an exponent typically close to 2 for many castings. This relation told me that isolated heavy sections would remain liquid much longer than thin sections. I therefore expected porosity in the thick hubs unless feeding paths were designed to remain open.
I also used the Niyama criterion as a qualitative thermal indicator:
$$N=\frac{G}{\sqrt{\dot{T}}}.$$
Low \(N\) values indicate a high probability of shrinkage porosity. In my K403 shell casting, the support column and the intersecting cylindrical regions had the lowest calculated \(N\) values before process changes. The Niyama criterion was especially useful because it linked shell thermal resistance, alloy superheat, and local geometry rather than treating porosity as a purely visual defect. I also compared this to evaporative pattern casting, where the pattern disappears during pouring and the mold filling and cooling history differ from investment casting. In evaporative pattern casting, the decomposition of the pattern can alter the local pressure and gas evolution, whereas in my investment casting process the shell is empty before pouring. This comparison helped me avoid incorrectly attributing gas-related defects to alloy chemistry when the actual cause was shell permeability or shell moisture.
Heat flow through the shell can be approximated by
$$q=-k\nabla T,$$
and for a simple planar shell the thermal resistance is
$$R_{th}=\frac{\delta}{kA},$$
where \(\delta\) is shell thickness and \(k\) is thermal conductivity. This equation was directly relevant to my decision to thin the shell locally at hot spots. If the shell is thinner, \(R_{th}\) decreases, heat extraction increases, and the local cooling rate rises. The intention was not to create a weak shell everywhere but to reduce thermal resistance only where the casting had excessive thermal mass. This is a strategy that also appears in evaporative pattern casting discussions, although evaporative pattern casting uses a different mold material and pattern removal mechanism. I mention evaporative pattern casting here because it reinforces the general principle that mold thermal resistance controls local solidification.
The pressure head required to fill the shell can be estimated from the Bernoulli-like relation:
$$P+\frac{1}{2}\rho v^2+\rho g z=\text{constant}.$$
For a vacuum investment casting process, the driving pressure also includes the vacuum-assisted pressure difference across the shell. I represented the effective filling pressure as
$$\Delta P_{\text{eff}}=\Delta P_{\text{vacuum}}+\rho g h-\Delta P_{\text{loss}},$$
where \(\Delta P_{\text{vacuum}}\) is the vacuum pressure difference, \(\rho g h\) is the metallostatic head, and \(\Delta P_{\text{loss}}\) is the flow loss through the gating system. This equation made it clear that increasing pouring temperature alone would not solve every filling problem. A faster pour and a better gating path could increase the effective pressure available to the thin sections.
For wax injection, I treated the flow as a pressure-driven viscous process. A simplified capillary-flow expression is
$$Q=\frac{\pi R^4 \Delta P}{8\eta L},$$
where \(Q\) is volumetric flow rate, \(R\) is channel radius, \(\Delta P\) is pressure drop, \(\eta\) is viscosity, and \(L\) is flow length. This relation shows why injection pressure, wax temperature, and tool temperature must be balanced. If the wax is too cold, \(\eta\) rises and \(Q\) falls, producing cold shuts or incomplete fill in the wax pattern. If the wax is too hot, shrinkage increases and the pattern can develop sink marks and flow lines. I therefore selected a narrow wax temperature window and a controlled injection pressure.
Wax shrinkage can be estimated as
$$S_w=\frac{L_m-L_w}{L_m}\times100\%,$$
where \(L_m\) is the mold cavity dimension and \(L_w\) is the measured wax dimension. I used repeated measurements to build a compensation table for the tool. The dimensional stack-up for the final casting included wax shrinkage, shell expansion, alloy solidification contraction, and cooling contraction. I wrote the total dimensional change as
$$\Delta L_{\text{total}}=\Delta L_{\text{wax}}+\Delta L_{\text{shell}}+\Delta L_{\text{solidification}}+\Delta L_{\text{cooling}}.$$
That equation was the basis for my decision to abandon the original multi-piece wax assembly. A manual assembly introduces an additional error term, \(\Delta L_{\text{assembly}}\), which is difficult to control because it depends on operator placement. In the original trial production, the measured center offset between cylindrical features was about 1.7–2.2 mm in the worst case, and the upper cylindrical features showed an upward warp. One overall length dimension became longer, and another center offset reached 0.5–0.87 mm. These deviations were not acceptable for the final component. I concluded that the assembly error was dominating the dimensional capability.
| Dimensional Error Source | Approximate Effect | Detection Method | Control Action |
|---|---|---|---|
| Wax injection shrinkage | Local sink and profile deviation | Wax inspection and coordinate measurement | Temperature, pressure, and hold-time control |
| Manual wax assembly | Center offset and angular warp | Post-machining coordinate measurement | One-piece tooling |
| Shell expansion and restraint | Dimensional drift after firing | Shell and casting measurement | Controlled shell thickness and preheat |
| Solidification contraction | Shrinkage-driven size change | Dimensional report | Tool compensation and thermal control |
| Cooling contraction | Final size shift | Final inspection | Process capability adjustment |
The wax injection parameters I selected were based on the balance between fillability, shrinkage, and surface quality. I found that a wax temperature below the selected range caused incomplete filling and cold shuts in the wax. A wax temperature above the selected range increased shrinkage, flow lines, and sink marks. A high injection pressure reduced shrinkage but could cause sticking, cracks, and bubbles if taken too far. A low injection pressure caused rounded corners and gas entrapment. The final window was therefore not the maximum pressure or the maximum temperature, but the stable middle of the response surface.
| Wax Injection Parameter | Selected Window | Reason for Selection |
|---|---|---|
| Wax temperature | 55–63 °C | Good flow without excessive shrinkage |
| Die temperature | 25–35 °C | Controlled cooling and reproducible filling |
| Injection pressure | 15–25 bar | Reduced shrinkage without sticking or bubble defects |
| Hold time | 15–20 s | Allowed pressure transmission before solidification |
The original process divided the wax pattern into three separately molded pieces and then joined them in a fixture. That approach created several problems. The fixture limited the locating accuracy, the human placement varied from part to part, and the joint regions could create local geometric discontinuities. After machining and coordinate measurement, I saw that the cylindrical centers had shifted and that the upper cylindrical features had warped. I therefore redesigned the tooling around a one-piece wax pattern. The new tool eliminated the assembly joint, reduced the operator-dependent variation, and improved the dimensional repeatability. I also used the one-piece pattern to improve the gating layout because the wax pattern could be supported and oriented more consistently. In this respect, evaporative pattern casting has a different advantage because it eliminates the wax pattern entirely, but for my K403 shell casting the one-piece investment pattern was the practical route. I continued to evaluate evaporative pattern casting only as a comparative benchmark, not as the production method.
After wax pattern production, the next critical stage was shell making. The shell must have enough green strength and fired strength to survive handling, dewaxing, preheating, and pouring. At the same time, the shell must not be so thick that it insulates the hot spots and prevents local cooling. My shell system used a primary slurry with zircon flour and a stucco of white alumina, followed by backup layers using hydrolyzed ethyl silicate and a refractory powder, with graded stucco sizes. The backup layers were alternated with drying, ammonia drying, and forced-air drying. I selected the shell parameters to balance permeability, strength, and thermal conductivity.
| Shell Layer | Slurry | Viscosity | Stucco | Drying or Curing |
|---|---|---|---|---|
| Primary | Silica sol with zircon flour | 40–50 s | White alumina WAF70 | Air dry ≥12 h |
| Secondary | Hydrolyzed ethyl silicate with refractory powder | 37–42 s | Refractory sand 36 mesh | Air dry ≥20 min, ammonia dry 10 min, forced air ≥10 min |
| Layers 3–8 | Hydrolyzed ethyl silicate with refractory powder | 13–15 s | Refractory sand 24 mesh | Air dry ≥20 min, ammonia dry 10 min, forced air ≥10 min |
| Seal | Hydrolyzed ethyl silicate with refractory powder | 13–15 s | None | Air dry ≥12 h |
I recognized that shell thickness is not a purely mechanical variable. It also controls heat transfer. If the shell is too thick at a hot spot, the local thermal resistance increases and the hot spot remains liquid longer, which increases the probability of shrinkage porosity. I therefore introduced a local shell-thinning operation after the fourth coating. I returned the assembly to the wax room and applied soft wax around selected upper and lower holes and around each of the eight inner gate openings. This wax patch reduced the local shell thickness after subsequent coating and drying. The intent was to increase heat extraction at the heavy sections without weakening the entire mold. I confirmed that the thinned regions still had enough strength to survive handling and pouring.
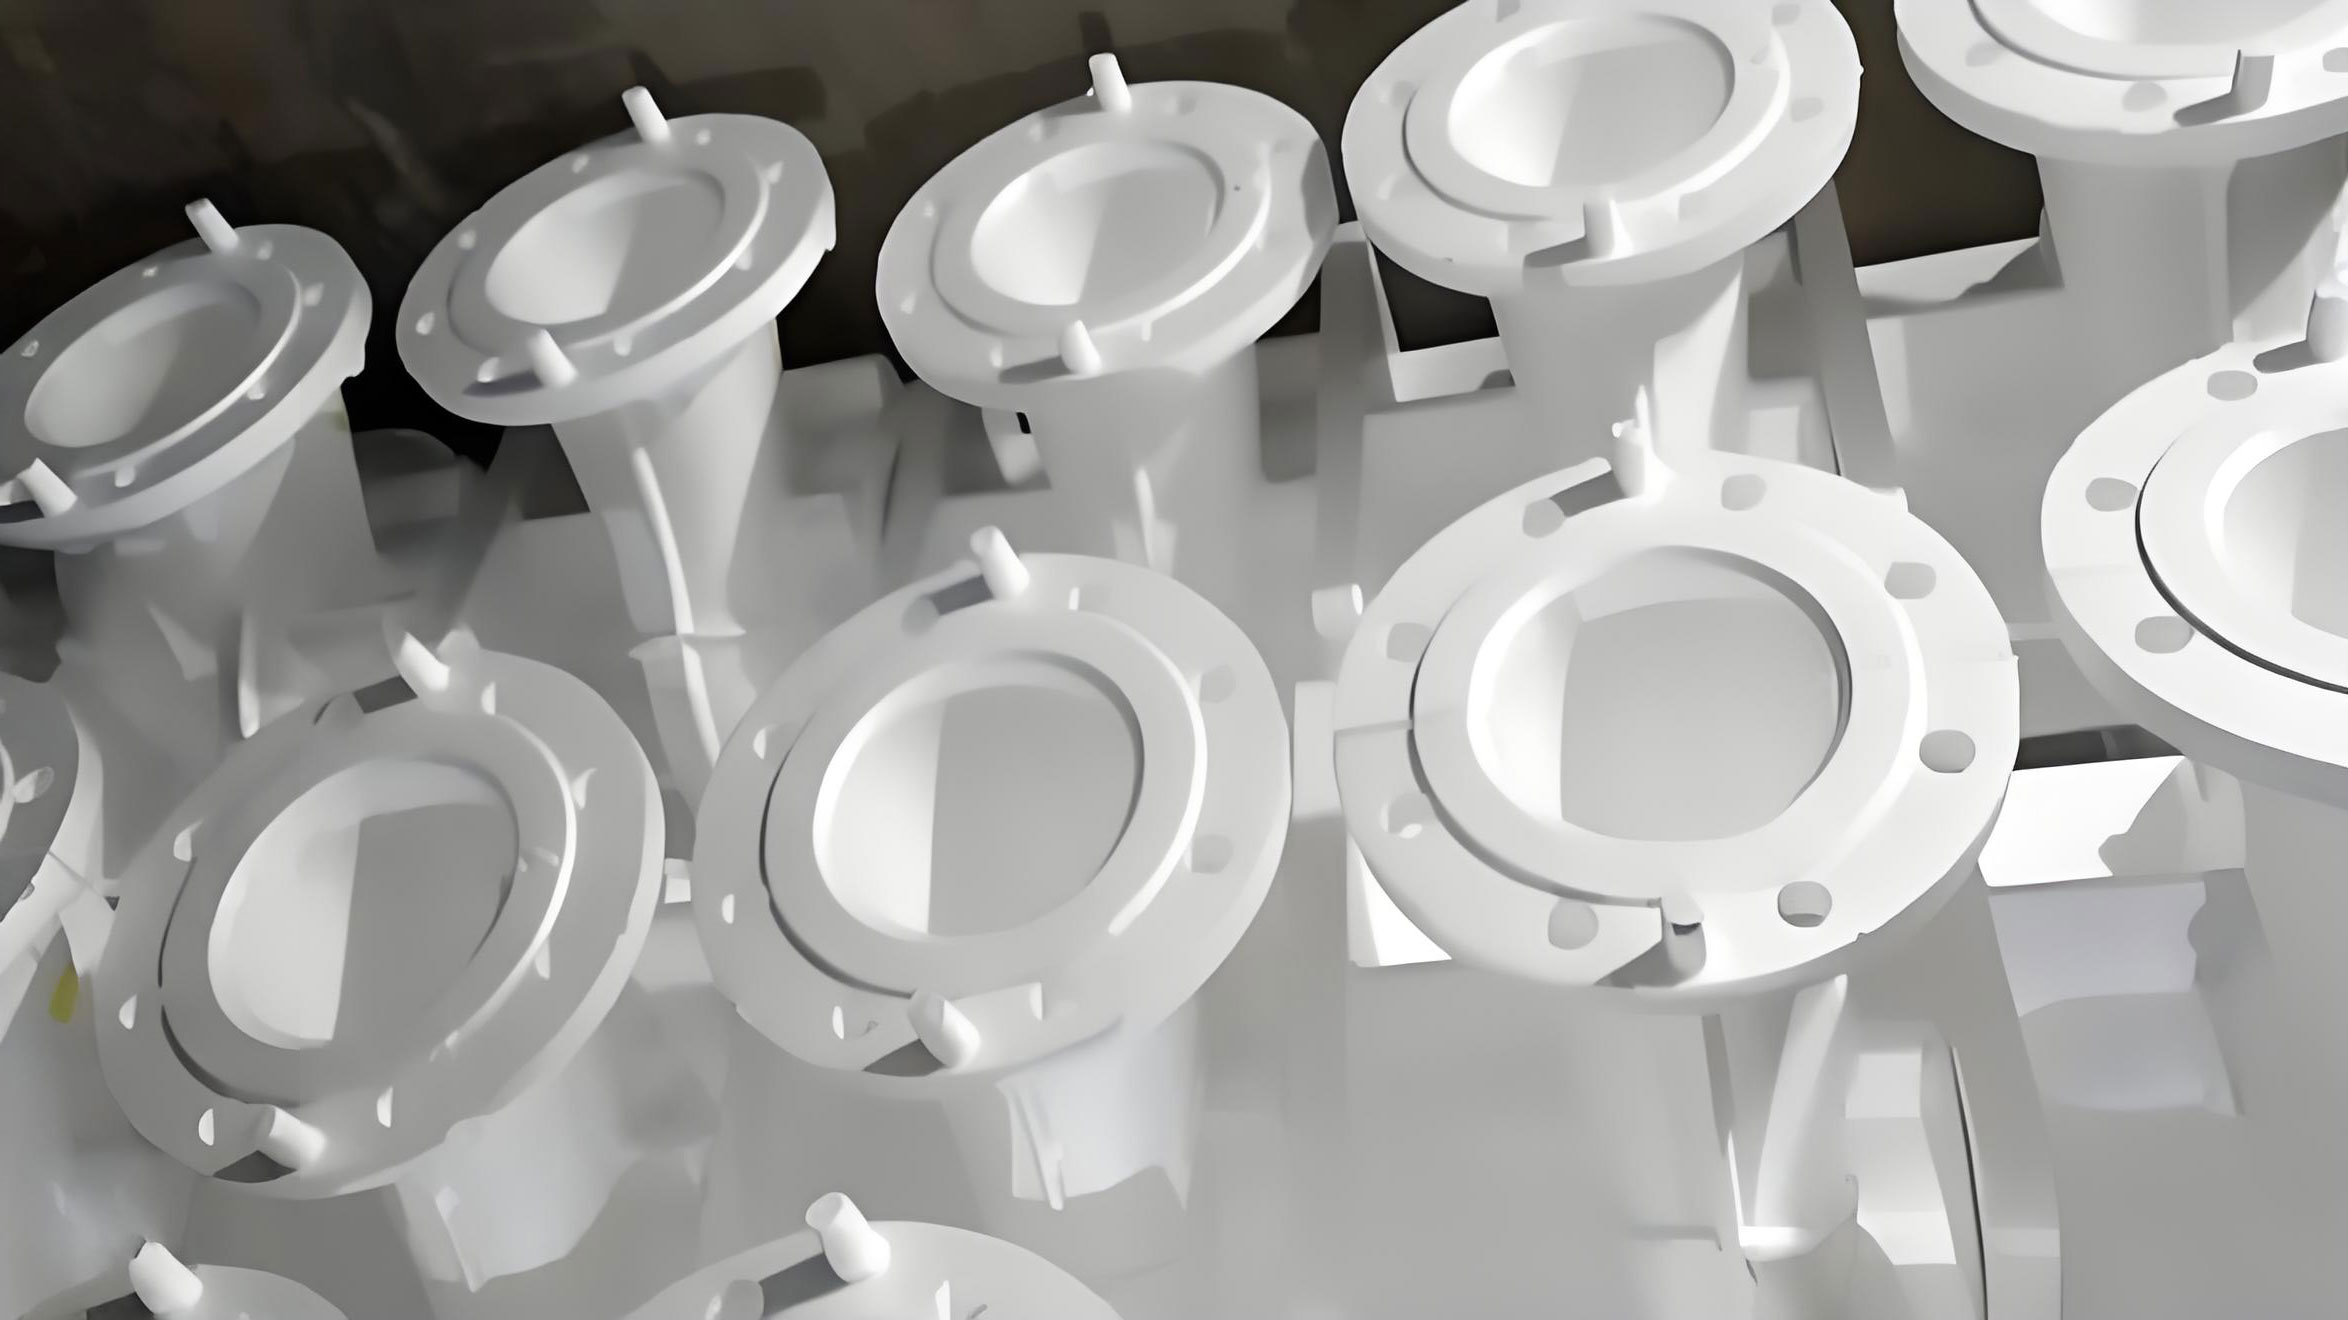
The local thermal benefit can be expressed through the shell thermal resistance. For a local shell patch of thickness \(\delta_1\) and a neighboring standard shell of thickness \(\delta_2\), the ratio of thermal resistances is
$$\frac{R_{th,1}}{R_{th,2}}=\frac{\delta_1}{\delta_2}.$$
If the local shell is reduced to 70% of the standard thickness, the local thermal resistance is approximately 70% of the standard value, assuming the same area and thermal conductivity. That reduction increases the local heat flux and promotes earlier solidification. I did not reduce the shell so much that it lost structural integrity. Instead, I used the wax patch to create a controlled local reduction in thickness while maintaining the general shell strength. This is one of the most important lessons I applied from thermal analysis: in investment casting, mold design is also thermal design.
I also considered how evaporative pattern casting differs in this respect. In evaporative pattern casting, the pattern is consumed by the molten metal, and the decomposition products must escape through the coating and sand. The local thermal resistance and gas pressure history are therefore coupled to pattern degradation. In my investment casting shell, there is no pattern decomposition during pouring because the wax has already been removed. This fundamental difference means that a shell-thinning strategy for investment casting cannot be directly transferred to evaporative pattern casting without considering gas permeability. I therefore treated evaporative pattern casting as a source of general thermal principles, while keeping the actual K403 process in the investment casting family. I repeated this distinction because evaporative pattern casting and investment casting both rely on a ceramic mold, but their filling and defect mechanisms are not identical.
Before pouring, I preheated the shell to remove residual moisture and organic residue and to reduce the thermal shock experienced by the alloy. The shell preheat temperature was selected in the range of 950–1000 °C. A higher shell temperature reduces the temperature difference between the alloy and the mold, which increases fillability. However, an excessively high shell temperature reduces the thermal gradient during solidification and can promote coarse grains and porosity. The optimum is therefore a compromise. I wrote the initial temperature difference as
$$\Delta T_0=T_{\text{pour}}-T_{\text{shell}}.$$
When \(\Delta T_0\) is too large, the alloy loses superheat rapidly and cold shuts can form. When \(\Delta T_0\) is too small, the casting cools slowly and feeding channels remain open too long or the grain structure coarsens. The selected preheat window kept \(\Delta T_0\) within a range that supported filling without destroying the directional temperature gradient.
| Preheat and Pouring Parameter | Selected Value | Effect on K403 Shell Casting |
|---|---|---|
| Shell preheat temperature | 950–1000 °C | Reduced thermal shock and improved fillability |
| Pouring temperature | 1430 ± 10 °C | Balanced fluidity with limited shrinkage and grain growth |
| Pouring time | 2–3 s per mold | Faster filling of thin sections and reduced cold shuts |
| Vacuum assistance | Applied during fill and early solidification | Improved mold filling and reduced gas-related defects |
The pouring temperature was set above the liquidus temperature by an amount sufficient to maintain fluidity through the complex gating system. I used the relation
$$T_{\text{pour}}=T_L+\Delta T_{\text{superheat}},$$
where \(T_L\) is the liquidus temperature and \(\Delta T_{\text{superheat}}\) is the selected superheat. For a complex shell casting, the superheat must be high enough to prevent cold shuts but not so high that solidification shrinkage and grain coarsening become severe. I found that a pouring temperature of 1430 ± 10 °C provided the best compromise. Lower temperatures increased cold shut and misrun risk, while higher temperatures increased shrinkage porosity and mold reaction risk.
Pouring speed was equally important. I estimated the average volumetric fill rate as
$$Q_{\text{pour}}=\frac{V_c}{t_p},$$
where \(V_c\) is the casting and gating volume and \(t_p\) is the pouring time. A slow pour allows the leading edge of the liquid metal to cool and may produce cold shuts or incomplete filling. A fast pour increases the inertial pressure and helps fill thin sections, but it can also erode the shell, entrain gas, or create turbulent flow. I selected a pouring time of 2–3 s per mold because it gave a high enough fill rate for the thin sections while keeping the gating system stable. I also ensured that the gating system provided enough metallostatic head and that the ingate locations supported sequential solidification toward the runner and sprue.
The feeding behavior of the casting can be described qualitatively by the feeding distance. A simplified expression is
$$L_f=k\sqrt{\frac{\Delta T}{G\dot{T}}},$$
where \(L_f\) is the effective feeding distance, \(\Delta T\) is the freezing range or available superheat, \(G\) is the thermal gradient, and \(\dot{T}\) is the cooling rate. This equation shows that a higher thermal gradient and a lower cooling rate can increase feeding distance. In practice, I could not simply lower the cooling rate because that would increase porosity in the hot spots. Instead, I used local shell thinning to increase the cooling rate at the hot spots while maintaining a favorable gradient toward the gating system. The gating system acted as a feeder and supported directional solidification.
I also used a simple heat-balance equation to evaluate the shell preheat and pouring operation:
$$m_s c_s (T_f-T_i)+m_s L_f=m_c c_c (T_p-T_f),$$
where \(m_s\) is the mass of the shell, \(c_s\) is the specific heat of the shell, \(T_f\) is the final interface temperature, \(T_i\) is the initial shell temperature, \(m_c\) is the mass of the casting, \(c_c\) is the specific heat of the alloy, and \(T_p\) is the pouring temperature. This equation is an idealization, but it helped me understand that the shell mass and shell thickness influence the interface temperature and therefore the local solidification path. A locally thinner shell has less thermal mass and extracts heat more effectively, which was the desired effect at the hot spots.
Defect control required a systematic cause-and-effect matrix. I classified defects into filling defects, feeding defects, shell-related defects, and dimensional defects. For each defect, I identified the dominant mechanism and the process parameter that most strongly influenced it. This matrix became the basis for the final process specification. I also used it to distinguish between defects that could be solved by pouring temperature and those that required a tooling or shell change.
| Defect | Mechanism | Primary Process Influence | My Corrective Action |
|---|---|---|---|
| Shrinkage porosity | Insufficient feeding during solidification | Thermal gradient, shell thickness, gating | Local shell thinning, improved feeding path, optimized pour temperature |
| Cold shut | Liquid front solidifies before merging | Pouring temperature, shell preheat, pour speed | Higher shell preheat and faster pouring |
| Misrun | Incomplete mold filling | Fluidity, vacuum, gating design | Improved gating and vacuum assistance |
| Shell cracking | Thermal shock and local stress concentration | Shell thickness, drying, preheat | Controlled shell lay-up and preheat |
| Run-out and flash | Shell breach or poor sealing | Shell strength and wax patch location | Reinforced vulnerable regions and controlled local thinning |
| Cracks in casting | Restraint during cooling and hot tearing | Shell restraint and cooling rate | Reduced local restraint and improved thermal uniformity |
| Dimensional warpage | Non-uniform cooling and assembly error | Wax assembly and shell support | One-piece wax pattern and improved support |
| Center offset | Manual wax joining | Fixture and operator variation | One-piece tooling |
I paid special attention to the difference between gas porosity and shrinkage porosity. Gas porosity is often round and distributed, while shrinkage porosity is irregular and follows the last-solidified regions. In my process, the shell was dried and preheated carefully, so gas porosity was less dominant. The main porosity was shrinkage-related and appeared near the thick sections and hot spots. This conclusion was supported by the fact that local shell thinning and gating changes reduced the defect severity. If the porosity had been caused mainly by gas, local shell thinning would not have produced the same improvement. I also considered evaporative pattern casting in this context because gas defects are often more closely associated with pattern decomposition in evaporative pattern casting. That contrast helped me confirm that my investment casting shell had to be evaluated primarily for thermal resistance and permeability, not for pattern decomposition gas.
The gating system and pouring cup design also influenced the filling pattern. I used a gating system that supported the mold cluster, acted as a feeder, and promoted sequential solidification toward the sprue. The gating system must have enough strength to support the shell during handling and enough cross-sectional area to feed the casting. I expressed the feeding capacity requirement as
$$A_g \geq \frac{V_s}{v_g t_s},$$
where \(A_g\) is the gate cross-sectional area, \(V_s\) is the local shrinkage volume, \(v_g\) is the effective feeding velocity, and \(t_s\) is the solidification time. This is an approximate relationship, but it guided the gate sizing. I also used the modulus concept:
$$M=\frac{V}{A},$$
where \(M\) is the casting modulus. The gating and feeding sections should have a larger modulus than the casting section they feed. In practice, I ensured that the runner and sprue remained liquid longer than the hot spots so that they could supply liquid metal during contraction.
After the process changes, I validated the casting by producing a trial batch. I evaluated metallurgical quality, dimensional accuracy, surface condition, and internal soundness. The qualification rate improved to 35 acceptable parts out of 40, or 87.5%. This was a significant improvement over the unstable early production. I did not rely on a single inspection method. I used visual inspection, coordinate measurement, radiographic or equivalent internal examination, and mechanical property verification where required. The results showed that the combination of one-piece wax tooling, controlled wax injection, local shell thinning, higher shell preheat, and a faster controlled pour produced a stable process window.
| Validation Batch | Quantity | Qualified | Qualification Rate | Main Remaining Defect |
|---|---|---|---|---|
| Trial batch after optimization | 40 | 35 | 87.5% | Minor isolated surface or dimensional deviation |
I also evaluated process capability for the critical dimensions. For a two-sided tolerance with lower specification limit \(LSL\) and upper specification limit \(USL\), the process capability index is
$$C_{pk}=\min\left(\frac{USL-\mu}{3\sigma},\frac{\mu-LSL}{3\sigma}\right),$$
where \(\mu\) is the process mean and \(\sigma\) is the process standard deviation. Before the tooling change, the center-offset dimensions had large scatter and the mean was shifted away from the nominal value, so \(C_{pk}\) was low. After the one-piece tooling change, the process mean moved closer to the nominal value and the standard deviation decreased. This was especially important for the cylindrical center distances and the overall length. I did not need to increase the tolerance band; I improved the process capability.
The dimensional improvement can also be represented as a reduction in total variance:
$$\sigma_{\text{total}}^2=\sigma_{\text{wax}}^2+\sigma_{\text{assembly}}^2+\sigma_{\text{shell}}^2+\sigma_{\text{solidification}}^2+\sigma_{\text{cooling}}^2.$$
By eliminating the assembly variance term, I directly reduced the total variance. This is one of the clearest quantitative arguments for the one-piece wax pattern. The original multi-piece approach introduced a variance component that was not controlled by the machine or the alloy; it was controlled by manual placement. Removing that component made the rest of the process more predictable.
I also modeled the solidification shrinkage as
$$\beta=\frac{\rho_s-\rho_l}{\rho_s}\times100\%,$$
where \(\beta\) is the volumetric shrinkage, \(\rho_s\) is the solid density, and \(\rho_l\) is the liquid density. The alloy feeding requirement is proportional to \(\beta V_c\), where \(V_c\) is the volume of the last-solidifying region. This relation reinforced the need for a larger feeding path and a favorable thermal gradient. When I locally thinned the shell, I increased the cooling rate at the hot spot and reduced the volume that remained liquid at the end of solidification. That reduced the feeding demand and made the residual porosity less likely.
The thermal gradient and cooling rate are linked to grain structure. A high cooling rate generally refines the grain size, while a low cooling rate promotes coarse grains. I used the relation
$$d_g \propto \dot{T}^{-m},$$
where \(d_g\) is the grain size and \(m\) is a positive exponent. This relation is approximate, but it explains why shell preheat and local shell thickness must be controlled. If the shell is too insulating, the cooling rate decreases and the grain size increases. If the shell is too thin or the preheat is too low, the cooling rate becomes excessive and thermal stresses can increase. The optimized process kept the cooling rate within a window that favored soundness and acceptable grain structure.
I also considered the thermal stress generated during cooling. A first-order estimate is
$$\sigma_{th}=E\alpha \Delta T,$$
where \(E\) is the elastic modulus, \(\alpha\) is the thermal expansion coefficient, and \(\Delta T\) is the local temperature difference. This equation shows that large temperature differences across the casting increase thermal stress. The complex shell geometry naturally creates temperature differences, so I tried to reduce them by controlling shell preheat and cooling uniformity. The local shell thinning was designed to reduce the hottest spot temperature difference without creating a new cold spot.
For shell cracking, I used the brittleness and strength balance. The shell must satisfy
$$\sigma_{\text{shell}} \leq \sigma_{\text{allow}},$$
where \(\sigma_{\text{shell}}\) is the stress from thermal shock and mechanical loading and \(\sigma_{\text{allow}}\) is the allowable shell strength. I increased the shell strength through proper drying and layer control, but I avoided making the shell uniformly thicker because that would have worsened hot-spot feeding. The local wax patch approach allowed me to reduce thickness only in selected locations. This is a key distinction between global shell thickening and local thermal engineering.
I summarized the final process window in a table so that the parameters could be transferred to production. The table includes the wax injection stage, shell building stage, shell preheat, and pouring stage.
| Stage | Parameter | Final Window | Primary Purpose |
|---|---|---|---|
| Wax injection | Wax temperature | 55–63 °C | Fillability and shrinkage balance |
| Wax injection | Die temperature | 25–35 °C | Reproducible cooling |
| Wax injection | Injection pressure | 15–25 bar | Dimensional fidelity and surface finish |
| Wax injection | Hold time | 15–20 s | Shrinkage compensation |
| Shell building | Primary viscosity | 40–50 s | Primary coat integrity |
| Shell building | Backup viscosity | 13–15 s | Build-up rate and strength |
| Shell building | Local wax patch after fourth layer | Selected hot spots | Local shell thinning and heat extraction |
| Shell preheat | Preheat temperature | 950–1000 °C | Fillability and thermal shock reduction |
| Pouring | Pouring temperature | 1430 ± 10 °C | Fluidity and soundness |
| Pouring | Pouring time | 2–3 s per mold | Fast filling without turbulence damage |
I also developed a simple defect probability model to rank the influence of process variables. For a defect type \(i\), I wrote the relative risk as
$$R_i=\sum_j w_{ij}x_j,$$
where \(w_{ij}\) is the weight of process variable \(j\) on defect \(i\), and \(x_j\) is the normalized deviation of variable \(j\) from its optimum. This model is qualitative, but it helped me prioritize actions. For shrinkage porosity, shell thickness and pouring temperature had high weights. For cold shut, shell preheat and pouring time had high weights. For dimensional error, wax assembly and tooling had the highest weight. By reducing the largest weighted deviations, I obtained the greatest improvement in qualification rate.
The comparison with evaporative pattern casting was useful at this stage because evaporative pattern casting has a different weighting of variables. In evaporative pattern casting, pattern density, coating permeability, sand compaction, and decomposition gas pressure can dominate defect formation. In my investment casting process, wax injection, shell thickness, shell preheat, and pouring temperature dominated. I did not confuse the two. I used evaporative pattern casting as a reminder that every casting process has a unique set of coupled variables, and I made sure my optimization was based on the actual investment casting route. I also noted that if a future redesign were to consider evaporative pattern casting, the tooling and shell strategy would need to be rebuilt around pattern decomposition and gas evacuation. That statement is not a recommendation to change the process; it is a recognition of the process physics.
I also examined the effect of shell preheat on fill length. A simplified fluidity model is
$$L_f=\frac{\rho v D^2}{32\eta}\left(\frac{\Delta P}{L}\right),$$
where \(L_f\) is the fill length, \(\rho\) is density, \(v\) is velocity, \(D\) is channel diameter, \(\eta\) is viscosity, and \(\Delta P/L\) is the pressure gradient. Although this expression is simplified, it shows that fill length increases with larger channels, higher pressure gradient, and lower viscosity. Since the shell geometry cannot be changed arbitrarily, I improved fill length by increasing shell preheat and pouring speed. The higher preheat reduced the viscosity of the alloy and delayed solidification at the flow front. The faster pour increased the pressure gradient. Together, these changes reduced cold shut and misrun defects.
The solidification path can be represented by the thermal gradient toward the feeder:
$$G_{\text{feed}}=\frac{T_{\text{casting}}-T_{\text{feeder}}}{x}.$$
I wanted \(G_{\text{feed}}\) to be positive and stable so that the last liquid would be in the feeder or gating system rather than in the casting. The local shell thinning at the hot spots helped by increasing the cooling rate in the casting while leaving the feeder relatively hotter. The result was a more favorable directional solidification pattern. I also ensured that the gates remained open long enough to feed the thick sections. The combination of thermal and geometric feeding control was more effective than changing only the pouring temperature.
For crack control, I considered the constraint from the shell. During cooling, the casting contracts and the shell restrains it. The strain can be approximated as
$$\varepsilon=\alpha \Delta T,$$
and if the strain exceeds the ductility of the alloy at the local temperature, a crack can form. The shell was designed to be strong enough to prevent run-out but not so rigid that it caused excessive restraint. Local shell thinning also reduced restraint at the hot spots because the thinner shell can deform slightly. This was an additional benefit beyond the thermal effect. I did not thin the shell so much that it lost dimensional control, but the local compliance helped reduce hot-tearing risk.
The vacuum level also influenced filling and defect formation. I expressed the effective pressure as
$$P_{\text{eff}}=P_{\text{atm}}-P_{\text{vac}},$$
where \(P_{\text{atm}}\) is atmospheric pressure and \(P_{\text{vac}}\) is the pressure inside the mold. A higher vacuum increases the pressure difference and helps pull the liquid metal into thin sections. However, an excessively high vacuum can increase turbulence and shell stress. I used vacuum assistance during filling and early solidification but maintained a controlled level that was compatible with shell strength. The result was better fillability without shell damage.
I also tracked the shell drying state. Residual moisture in the shell can cause gas defects, shell spalling, and poor surface quality. The drying process included air drying, ammonia drying, and forced-air drying. I used the following approximate drying criterion:
$$\frac{\partial C}{\partial t}=D_{\text{eff}}\nabla^2 C,$$
where \(C\) is moisture concentration and \(D_{\text{eff}}\) is the effective diffusivity. This equation explains why thicker shell regions need longer drying times. The local wax patch created a thicker shell region before thinning, so I ensured that the drying schedule was sufficient to remove moisture from the final shell. The seal layer was also dried thoroughly before preheating. These steps reduced gas-related defects and improved shell reliability.
I also evaluated the surface roughness and dimensional fidelity of the wax pattern. Surface defects in the wax can transfer to the ceramic shell and then to the casting. I used the following qualitative relationship:
$$R_a,\text{casting} \approx R_a,\text{wax}+R_a,\text{shell}+R_a,\text{alloy},$$
where \(R_a\) is the arithmetic average roughness. By improving wax injection parameters, I reduced wax surface defects. By controlling the primary slurry viscosity and stucco, I reduced shell surface defects. By controlling pouring temperature and shell preheat, I reduced alloy surface defects. The final casting surface quality was acceptable for the application. I did not need to rely on extensive machining to correct surface defects.
The gating and feeding design also affected the thermal field. I used a cluster of eight inner gates to distribute metal into the mold. The gates were arranged to feed the thick sections while allowing the thin sections to fill quickly. I estimated the gate modulus as
$$M_g=\frac{V_g}{A_g},$$
and required \(M_g > M_c\) for the sections being fed. This is a standard modulus criterion. In practice, I ensured that the runner and sprue had a larger modulus than the hot spots. I also used the shell-thinning operation to reduce the effective modulus of the hot spots by increasing their cooling rate. The combination of a larger gate modulus and a faster local cooling rate improved feeding.
I considered the effect of alloy superheat on grain size and porosity. The superheat is
$$\Delta T_{\text{superheat}}=T_p-T_L.$$
A higher superheat increases fluidity but also increases the amount of liquid that must be fed during solidification. A lower superheat reduces shrinkage demand but increases the risk of cold shut. I chose a moderate superheat that balanced these effects. The pouring temperature of 1430 ± 10 °C was the result of this balance. I also controlled the melt quality by ensuring proper vacuum melting and pouring practice. The alloy composition was maintained within the specified range, and the trace elements were controlled. I did not allow the melt to remain at high temperature for excessive time because that could coarsen the microstructure and increase gas pickup.
The dimensional compensation for the tool was based on measured shrinkage. I used the relation
$$L_{\text{tool}}=L_{\text{final}}\left(1+S_{\text{total}}\right),$$
where \(L_{\text{tool}}\) is the tool dimension, \(L_{\text{final}}\) is the desired final dimension, and \(S_{\text{total}}\) is the total shrinkage factor. I measured the actual wax and casting dimensions and adjusted the tool accordingly. This iterative approach reduced the dimensional deviation. The one-piece tool made the compensation more predictable because the assembly error was removed. I also used coordinate measurement data to verify the centers and lengths after each iteration. The final process produced dimensions within the required tolerance for the majority of the trial batch.
I also evaluated the mechanical property response. K403 is sensitive to cooling rate, and the cast microstructure influences tensile strength, creep resistance, and fatigue behavior. The local shell thinning and preheat changes altered the cooling rate, so I verified that the mechanical properties remained acceptable. I used the Hall-Petch-type relation as a qualitative guide:
$$\sigma_y=\sigma_0+k_y d_g^{-1/2},$$
where \(\sigma_y\) is yield strength, \(\sigma_0\) is friction stress, \(k_y\) is a strengthening coefficient, and \(d_g\) is grain size. A finer grain size generally increases yield strength, but in superalloys the relationship is more complex because gamma-prime precipitation and carbide distribution also matter. I therefore used mechanical testing rather than relying only on grain size. The optimized process produced acceptable properties while reducing porosity and dimensional error.
The following table summarizes the main equations I used and their practical role in the K403 shell casting development.
| Equation | Expression | Practical Use |
|---|---|---|
| Cooling rate | \(\dot{T}=\partial T/\partial t\) | Assess local solidification speed |
| Thermal gradient | \(G=\nabla T\) | Evaluate feeding direction |
| Chvorinov rule | \(t_s=B(V/A)^n\) | Estimate solidification time |
| Niyama criterion | \(N=G/\sqrt{\dot{T}}\) | Rank porosity risk |
| Heat flux | \(q=-k\nabla T\) | Understand shell heat extraction |
| Thermal resistance | \(R_{th}=\delta/(kA)\) | Justify local shell thinning |
| Wax flow | \(Q=\pi R^4\Delta P/(8\eta L)\) | Set injection pressure and temperature |
| Wax shrinkage | \(S_w=(L_m-L_w)/L_m\) | Compensate tool dimensions |
| Total dimensional change | \(\Delta L_{\text{total}}=\sum \Delta L_i\) | Build tool compensation |
| Pouring rate | \(Q_{\text{pour}}=V_c/t_p\) | Select pouring time |
| Feeding distance | \(L_f=k\sqrt{\Delta T/(G\dot{T})}\) | Evaluate gating and feeding |
| Process capability | \(C_{pk}=\min[(USL-\mu)/(3\sigma),(\mu-LSL)/(3\sigma)]\) | Verify dimensional control |
I also used a structured comparison between the original process and the optimized process. This comparison is important because it shows that the improvement came from specific changes rather than from random variation.
| Process Aspect | Original Condition | Optimized Condition | Result |
|---|---|---|---|
| Wax pattern | Three-piece molded and manually joined | One-piece molded | Reduced center offset and warp |
| Wax injection control | Broad and inconsistent | 55–63 °C, 15–25 bar, 15–20 s | Better fill and surface quality |
| Shell at hot spots | Uniform thickness | Locally thinned after fourth layer | Improved local cooling and reduced porosity |
| Shell preheat | Not optimized | 950–1000 °C | Improved fillability and reduced cold shut |
| Pouring temperature | Variable | 1430 ± 10 °C | Balanced fluidity and shrinkage |
| Pouring time | Slow and inconsistent | 2–3 s per mold | Reduced cold shut and misrun |
| Qualification rate | Unstable | 35 of 40 qualified | 87.5% in trial batch |
I also considered the role of evaporative pattern casting in the broader context of casting process selection. If a shell casting is produced by evaporative pattern casting, the pattern is typically made of a foam material, coated, embedded in sand, and then replaced by molten metal. The decomposition of the foam produces gas and can influence mold filling, surface finish, and defect formation. In my investment casting process, the pattern is wax, the mold is ceramic, and the wax is removed before pouring. The two processes share the concept of a pattern and a mold, but the physics are different. I therefore mention evaporative pattern casting repeatedly only to make clear that I evaluated the process alternatives and that I did not apply evaporative pattern casting assumptions to my investment casting data. The actual K403 shell casting was improved through investment casting process control.
The final production procedure I established can be summarized as follows. I first injection mold a one-piece wax pattern using the controlled temperature, pressure, and hold-time window. I inspect the wax pattern for surface defects, incomplete fill, and dimensional deviation. I then assemble the wax pattern onto the gating system and prepare the shell. I apply the primary slurry and stucco, followed by the specified number of backup layers. After the fourth layer, I apply local wax patches at the selected hot spots and around the inner gate openings, then continue shell building. I dry and cure each layer according to the schedule. I dewax the shell, preheat it to 950–1000 °C, and pour K403 alloy at 1430 ± 10 °C within 2–3 s per mold under controlled vacuum. I allow the shell to cool, remove the casting, and perform inspection and qualification.
I also established a feedback loop for continuous improvement. The measured dimensional data are fed back to the wax tool compensation. The radiographic and visual inspection results are fed back to the shell-thinning locations and gating design. The pouring temperature and time are adjusted only within the qualified window. The process capability indices are monitored for critical dimensions. If a new defect appears, I use the defect matrix to identify the most likely cause and then change only the relevant variable. This disciplined approach is essential for a complex K403 shell casting because many variables interact.
In my assessment, the most important improvements were the one-piece wax pattern, the local shell thinning at hot spots, the controlled shell preheat, and the faster pouring speed. The one-piece pattern solved the dimensional assembly error. The local shell thinning increased heat extraction at the hot spots and reduced shrinkage porosity. The higher shell preheat and faster pouring reduced cold shuts and misruns. The controlled wax injection parameters improved the wax pattern quality and dimensional repeatability. Together, these changes raised the qualification rate to 87.5% in the trial batch.
I also noted that evaporative pattern casting would require a different set of controls. In evaporative pattern casting, the foam pattern density, coating permeability, sand compaction, and pouring temperature must be optimized to manage gas evolution and mold filling. I did not attempt to convert the K403 shell casting to evaporative pattern casting because the existing investment casting route, once optimized, met the quality requirements. However, I kept evaporative pattern casting in my technical review because it provides a useful contrast for understanding pattern removal, mold filling, and defect formation. This contrast helped me avoid overgeneralizing from one casting process to another.
The final process capability showed that the critical center distances and length dimensions were within tolerance. The remaining deviations were minor and could be managed by normal process control. I did not observe the severe center offset that occurred in the original multi-piece wax assembly. I also did not observe the extensive porosity that occurred before the shell-thinning and pouring changes. The casting surface was acceptable, and the internal soundness was improved. The process was stable enough to support production.
I also evaluated the economic effect of the changes. The one-piece tooling required an initial investment, but it reduced rework and scrap. The local shell-thinning operation added a manual step, but it reduced porosity and improved yield. The optimized pouring parameters reduced cold shut and misrun defects. The overall effect was a higher qualification rate and a more predictable production flow. For a complex K403 shell casting, this is more valuable than a marginal reduction in cycle time. I therefore kept the process changes in the production specification.
In conclusion, I solved the K403 shell casting problems by treating the process as an integrated system. I controlled wax injection to produce a dimensionally stable one-piece pattern. I designed the shell to provide both adequate strength and local thermal control. I used shell thinning at hot spots to increase cooling rate and reduce porosity. I preheated the shell to improve fillability and reduced thermal shock. I poured at a controlled temperature and speed to balance fluidity and shrinkage. I validated the process with a 40-piece trial and achieved 35 acceptable castings, an 87.5% qualification rate. The improved process is suitable for continued production, and the methodology can be applied to similar complex shell castings. I also maintained a clear technical distinction between investment casting and evaporative pattern casting so that the process physics would not be confused. The repeated consideration of evaporative pattern casting helped me benchmark alternative mold-filling and pattern-removal mechanisms, but the actual production solution remained an optimized investment casting process for the K403 shell casting.