
In my experience with modern foundry enterprises, the production of lost foam castings presents remarkable challenges in process control, quality quantification, and information traceability. The conventional manual recording of production data is not only labor-intensive but also highly error-prone, leading to fragmented information that cannot effectively support real-time decision making. To address these issues, I designed and developed a comprehensive life-cycle management system specifically tailored for lost foam castings. This system integrates advanced data acquisition, network communication, database management, and visualization technologies to achieve full-process tracking and optimization. In this article, I will describe the system architecture, key technical implementations, and application results, emphasizing how the unique code of each lost foam casting serves as the backbone of the entire data chain.
Lost foam castings are produced through a sequence of critical steps: white foam pattern manufacturing, coating, compaction, pouring, and final cleaning. Each step introduces variables that affect the final product quality. The complexity increases when multiple product types coexist on the same production line, with different geometries, precision levels, and material requirements. Without a robust digital management framework, the production process becomes difficult to monitor, and any quality issue is hard to trace back to its root cause. Therefore, the life-cycle management system for lost foam castings must cover not only the manufacturing stage but also the design, planning, quality inspection, and after-sales service stages. In the following sections, I will discuss how my system achieves this integrated management.
Production Process and Existing Management Challenges
The production flow of lost foam castings is illustrated below in my own description rather than a figure. The white foam pattern is first molded from expandable polystyrene beads and then aged. After aging, the pattern is assembled and glued with the gating system. Next, the assembled cluster is coated with a refractory slurry, dried, and then placed into a sand box. The sand box is filled with loose sand and compacted by vibration. Finally, molten metal is poured into the mold, which vaporizes the foam pattern and creates the casting. After cooling, the casting is extracted and cleaned. This sequence is traditionally managed by paper-based work orders, which leads to several significant issues in real-world factories.
First, equipment archives are often incomplete because maintenance logs are manually updated or not recorded at all. Second, information collection methods are outdated: production data such as cycle time, temperature, and operator identification are scattered across separate sheets. Third, feedback delays prevent the management from reacting promptly to abnormal conditions. Fourth, daily work schedules are not executed rigorously due to the lack of effective monitoring tools. Fifth, spare parts and components are frequently unavailable when breakdowns occur because inventory data is not linked to real-time equipment status. Sixth, information silos exist between different workshops and departments, making it nearly impossible to obtain a holistic view of the entire manufacturing lifecycle of lost foam castings.
These challenges motivated me to design a system that can automatically capture, store, and analyze data at every stage of the lost foam casting process. My goal was to create a transparent production environment where every individual casting can be traced back to its raw materials, processing conditions, and responsible operators.
Overall System Architecture
The system I developed follows a four-layer architecture: perception layer, network layer, data storage and management layer, and application layer. The perception layer is responsible for collecting data from various sources, including bill of materials, personnel information, equipment status, product specifications, RFID readers, instrumentation, and PLC controllers. The network layer ensures reliable transmission of collected data using industrial Ethernet and VPN tunnels. The data storage and management layer handles the storage, statistical analysis, and mining of both real-time and historical data. The application layer provides user interfaces and business functions such as real-time monitoring, fault diagnosis, quality traceability, and production scheduling.
Table 1 summarizes the main components and functions of each layer in my system.
| Layer | Components | Primary functions |
|---|---|---|
| Perception layer | Sensors, RFID, barcode scanners, PLCs, manual terminals | Collect process parameters, equipment status, material IDs, and operator input |
| Network layer | Industrial switch, AP-Client, VPN gateway, Modbus TCP/IP | Transmit data securely and stably across workshops and remote sites |
| Data management layer | MySQL, real-time database, data processing engines | Store, convert, and analyze structured and unstructured data |
| Application layer | Monitoring dashboards, traceability interfaces, quality analysis tools | Provide real-time visibility, historical queries, alarm management, and reporting |
In order to make the life-cycle management truly effective for lost foam castings, I placed special emphasis on the interoperability between layers. The perception layer does not simply dump raw data into the database; instead, it pre-processes the data using edge computing techniques that filter noise and identify abnormal events. This design reduces network traffic and improves the responsiveness of the entire system. The data management layer then applies descriptive statistics and correlation analysis to uncover patterns hidden in the production data. For example, the relationship between pouring temperature and porosity defects can be quantitatively evaluated, allowing the system to suggest optimal pouring parameters for different lost foam casting geometries.
Production Data Acquisition
The foundation of my life-cycle management system is the unique identification of every lost foam casting. I called this identifier the mold number unique code. Each casting cluster receives a 14-digit code that is printed as a barcode and also stored in an RFID tag when necessary. The code format is shown below.
$$C = M O \parallel Y Y \parallel M M \parallel D D \parallel NNNNNN$$
Here, the first two characters MO represent the identifier type, the next four digits encode the year and month of the pattern assembly, and the following six digits are a sequential serial number. For example, the code MO200907000006 represents a lost foam casting pattern assembled on September 7, 2020, with the serial number 000006. This code is not intended to humanly convey any more detailed information; instead, all relevant attributes such as part number, drawing number, material grade, and customer order are linked to the code in the database. This approach overcomes the limitations of traditional coding schemes where each digit has a fixed meaning and the identifier length becomes unmanageable.
The data acquisition process is carefully designed to bind the unique code with all production data. At the beginning of the pattern assembly, a handheld PDA is used to scan the unique code and capture the operator ID and timestamp. In subsequent steps of coating, compaction, and pouring, the same unique code is scanned again so that the production data for that particular lost foam casting is incrementally accumulated. The binding process can be represented as the following set of tuples:
$$L = \{ (c, t, s, o, e, m, q) \ | \ c \in C, t \in T, s \in S, o \in O, e \in E, m \in M, q \in Q \}$$
where c is the unique code, t is the operation type, s is the equipment or workstation identifier, o is the operator ID, e is the environmental or process parameter vector, m is the material batch number, and q denotes the quality inspection result. Every tuple is automatically stored in the real-time database as soon as an operation is completed.
RFID technology is used to track the position of sand boxes on the pouring line. Each sand box has an RFID tag with a unique box number. At the entrance of the pouring line, an RFID reader detects the box number and sends it to the PLC. By maintaining the order of detected boxes, the system can determine the exact location of every sand box on the line. This information is crucial for associating pouring parameters with specific lost foam castings inside the sand box. In my implementation, the sand box number is also bound to the unique code of each casting inside it, allowing the system to retrieve the complete history of the casting by scanning either the box number or the unique code.
Table 2 lists the equipment used for data acquisition at each production stage.
| Production stage | Data acquisition equipment | Data captured |
|---|---|---|
| Pattern assembly | Handheld PDA, barcode scanner | Unique code, operator, time, part number |
| Coating and drying | Handheld PDA, temperature/humidity sensors | Coating batch, operator, drying conditions |
| Compaction | Vibration sensors, PLC, RFID reader | Sand box ID, vibration frequency, duration |
| Pouring | RFID reader, thermocouple, flow meter, PLC | Pouring temperature, pouring time, vacuum level, box position |
| Quality inspection | Hardness tester, spectrometers, ultrasonic flaw detector | Chemical composition, mechanical properties, defect indications |
Through this systematic acquisition approach, I eliminated the need for manual transcription of data. The error rate of data entry dropped drastically, and the completeness of production records improved to almost 100% for all critical parameters. This robust data foundation enables reliable traceability and advanced analytics for lost foam castings.
Network Architecture and Communication Protocols
To ensure secure and real-time data exchange among multiple workshops, suppliers, and remote management personnel, I implemented a network topology that combines redundant industrial Ethernet with VPN connections. The internal network is divided into the upper information management network and the subsystem network. The upper network uses gigabit Ethernet with 48-port industrial switches and communicates with the subsystem network using Ethernet protocols. For devices from different controller vendors, I designed a data acquisition interface based on the Modbus TCP protocol, which simplifies the integration effort and reduces the complexity caused by heterogeneous communication stacks.
Modbus TCP uses port 502 and constructs data frames with the MBAP header, function codes, and payload. Unlike Modbus RTU, it does not require CRC checks and device addresses. This protocol is widely accepted in the industrial automation domain. In my system, the PLCs from different vendors are synchronized with the central server through Modbus TCP. The communication polling interval is set to 200 ms for time-critical parameters and 1 s for slower variables such as temperature trend data.
The network topology diagram cannot be reproduced here, but I will describe its structure. Each workshop is equipped with a local switch that connects PLCs, operator terminals, and barcode scanners. The local switches are connected to a central core switch through fiber optic links. The core switch is redundant to avoid single point of failure. Remote offices and partner companies access the system through VPN gateways, which use encrypted tunnels to ensure data confidentiality. The VPN solution also allows the management team to monitor production status from any location using a standard web browser.
In the wireless part of the system, I employed the AP-Client mode to connect mobile handheld devices to the local network. This mode is chosen because it is more stable in harsh industrial environments. I found that the surrounding noise floor must be lower than -95 dBm to maintain a low-latency data transmission. If the noise floor exceeds -90 dBm, packet loss becomes severe and can adversely affect the real-time binding of production data. Therefore, I installed additional access points and directional antennas in critical areas to improve signal quality.
Data Storage and Management
The data storage and management layer is the core repository of the life-cycle system. I chose MySQL as the relational database management system for structured business data, and a separate real-time historian database for high-frequency process data. MySQL uses the InnoDB storage engine, which supports transactions and row-level locking. To accelerate query speed, I set the primary key index as a clustered index. The real-time database stores time-series data such as temperatures, pressures, and vibration amplitudes, with a high compression ratio and fast time-based retrieval capability.
Data modeling is critical for effective management. Table 3 shows the main tables used to store production information for lost foam castings.
| Table name | Fields | Purpose |
|---|---|---|
| Product | unique_code, part_number, drawing_number, material_grade | Master data for each product type |
| Mold | unique_code, mold_number, pattern_type, assembly_date | Details of the white foam pattern |
| Process | unique_code, process_step, start_time, end_time, operator_id, equipment_id | Operational history of each casting |
| Equipment | equipment_id, workshop, installation_date, maintenance_log | Asset and maintenance records |
| Material | batch_number, material_name, supplier, quantity, composition | Raw material traceability |
| Quality | inspection_id, unique_code, test_name, result, limits, inspector_id | Quality inspection results |
| User | user_id, role, name, permissions | Personnel management |
The life-cycle management system also involves analytical models that use the stored data to improve the production quality of lost foam castings. For example, the defect rate \(R_d\) of a particular batch can be calculated as:
$$R_d = \frac{N_{\text{defective}}}{N_{\text{total}}} \times 100\%$$
where \(N_{\text{defective}}\) is the number of rejected castings and \(N_{\text{total}}\) is the total number of produced lost foam castings. By stratifying the defect rate by process parameters, the system can identify the most influential factors. A typical statistical analysis may compute the correlation coefficient between pouring temperature \(T_p\) and porosity index \(P_i\):
$$\rho = \frac{\sum_{i=1}^{n}(T_{p,i} – \bar{T}_p)(P_{i} – \bar{P})}{\sqrt{\sum_{i=1}^{n}(T_{p,i} – \bar{T}_p)^2 \sum_{i=1}^{n}(P_{i} – \bar{P})^2}}$$
Such quantitative insights guide the process engineer to adjust the pouring temperature range for specific lost foam casting geometries, thereby reducing defects and rework.
Application Layer: Monitoring and Traceability
The application layer delivers the actual value of the system to the users. I developed a pouring monitoring system using configuration software and PLC technology. The monitoring interface provides a real-time view of the pouring line, showing the position of each sand box, the batch number of the ladle, the pouring temperature, and the vacuum level. This visual display helps the operator to identify abnormal conditions easily. In addition, the system performs an automatic comparison between the measured parameters and the allowable thresholds. If a parameter is out of range, the system triggers an audible and visual alarm, and the production of that particular lost foam casting is halted until the issue is resolved. This preventive measure ensures that defective products do not proceed to the next process.
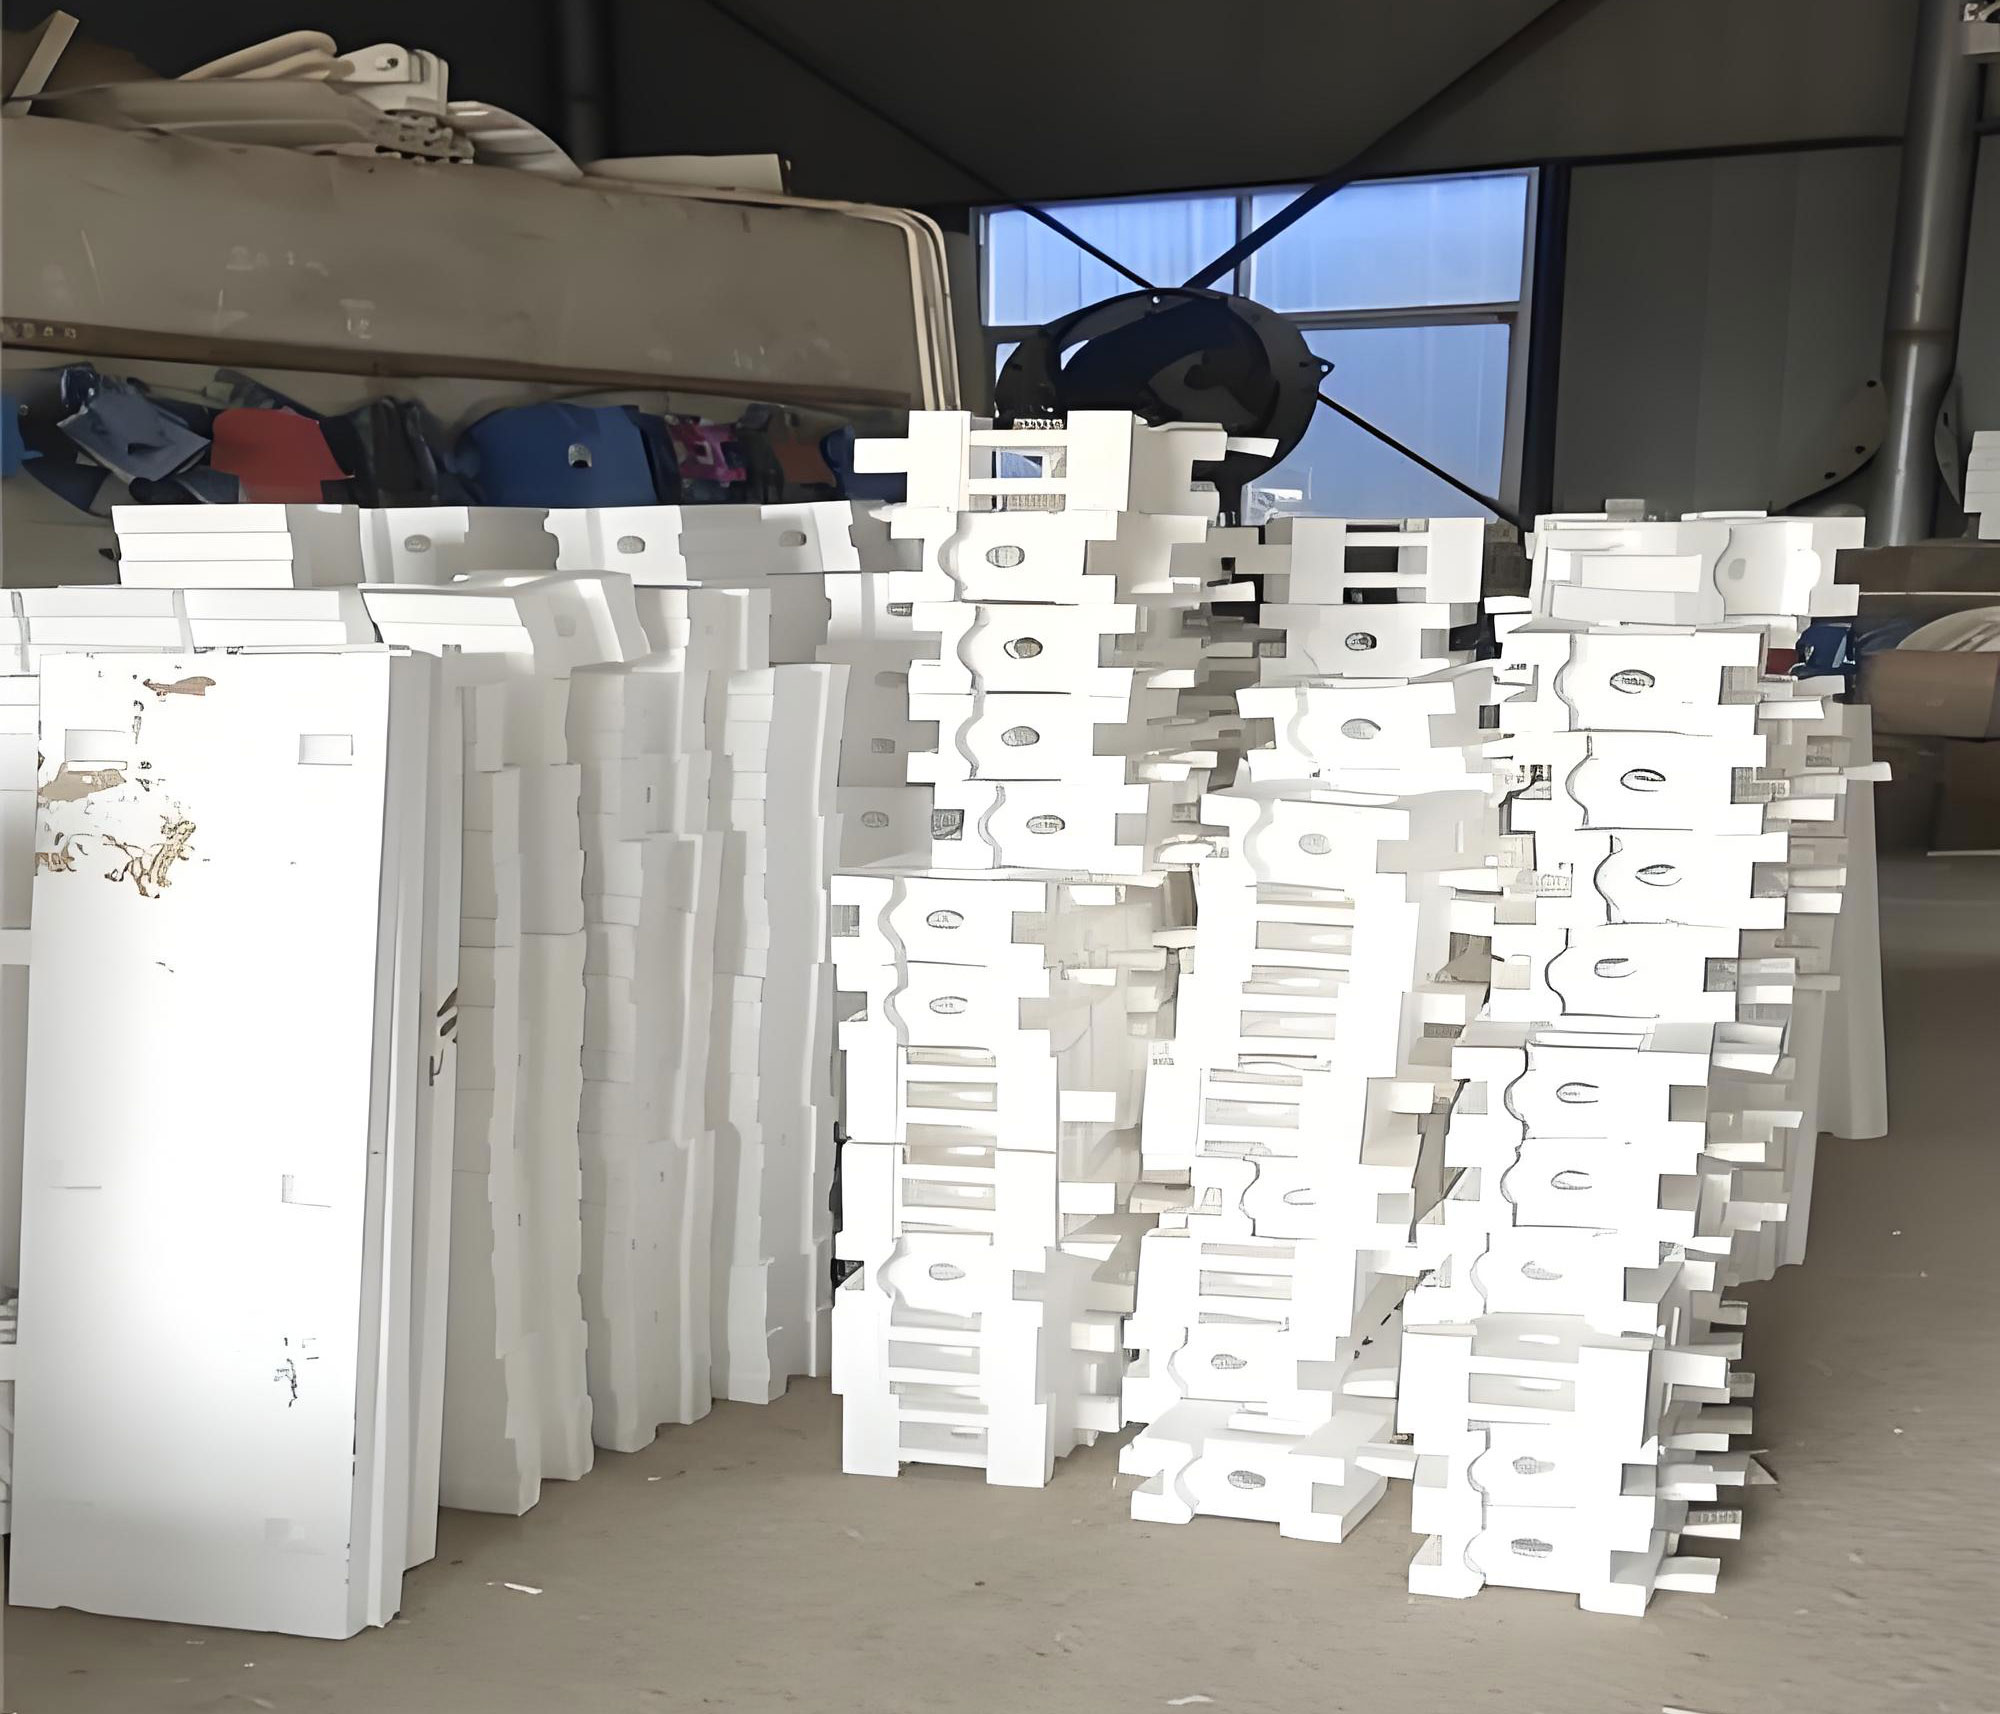
The traceability function allows users to query the complete history of any product by entering its unique code. The query result includes not only the processing time and operators but also the exact values of process variables at each step. For example, a user can retrieve the vibration frequency used during compaction, the coating drying time, and the pouring temperature profile. This information is essential for failure analysis and continuous process improvement. Figure 10 in the original paper showed an example of a production trace query, but I will not reference any figure numbers here; instead, I have inserted an illustration of a lost foam casting below.
The traceability system is based on the B/S architecture, which enables remote access via a web browser without installing any client software. The backend database is MySQL, and the application server uses Java programming language. I used the IntelliJ IDEA development platform to create the data acquisition interfaces and the business logic. The user interface is built with DHTML, incorporating HTML, CSS, and JavaScript to realize dynamic page effects. The main query interface accepts either a unique code, a sand box number, or a batch number. The search results are presented in a tabular form with a drill-down capability.
Product Traceability in Detail
Product traceability in my system covers the four main production stages of lost foam castings: white foam pattern manufacturing, coating, compaction, and pouring. Each stage generates a new set of data records that are linked to the same unique code.
In the white foam pattern stage, the system generates a daily production plan and assigns specific quantities and workstations. The unique code is printed and attached to the pattern after molding. The operator scans the code after aging and assembly, and then the system records the mold number, quantity, date, production batch, and the name of the pattern maker. The inventory level of the corresponding product family is updated in real time. If the barcode is damaged or lost, the operator can manually enter the unique code into the B/S interface to maintain continuity.
In the coating stage, the unique code is covered by the refractory coating. The operator must gently tap the coating layer to expose the barcode before scanning with a handheld PDA. This step ensures that the coating operation is properly recorded. If the barcode cannot be exposed due to geometry restrictions, the operator scans a secondary barcode that is placed at a known location on the pattern cluster. This secondary barcode contains the same unique code. The system also records the coating slurry batch number, the number of dipping cycles, and the drying temperature and duration.
In the compaction stage, the operator places the coated pattern into a sand box. Each workstation is equipped with a serial barcode scanner. When the sand box arrives, the PLC reads the RFID tag to obtain the sand box number and displays it on the terminal. After compaction, the operator scans the barcode of the last visible pattern or the pattern gating system, and the system binds the sand box number with all the unique codes of the patterns inside that box. This binding is crucial because later during pouring, only the sand box number is directly observable. The system also records the vibration frequency, vibration time, and the operator ID.
In the pouring stage, the casting monitoring system collects data from the pouring line. The RFID readers detect the sand box number at multiple positions, and the PLC measures the temperature of the molten metal using thermocouples. The ladle number is manually entered or read from an RFID tag. The pouring start time, end time, and total poured mass are also recorded. All these data are associated with the sand box number, and through the previously built binding, they are automatically linked to each unique code inside the sand box. In this way, I can answer questions such as “Which operator poured this specific lost foam casting?” or “What was the vacuum level during the pouring of order number X?”
Personnel Traceability
Personnel traceability is an important part of the product life-cycle management. My system implements a “one person one code” policy. Every operator has a unique user ID, and they must log in to the system before starting any operation. The system automatically binds the user ID to the operation record. This design ensures that every production step on a lost foam casting can be traced back to a specific person. The responsibility is clear, and the accountability mechanism greatly improves the discipline and carefulness of the workers.
In addition, personnel traceability contributes to fair performance evaluation. The system collects each operator’s working hours, number of operations, and quality outcomes of those operations. From these data, the management can identify training needs, allocate bonuses more fairly, and recognize high-performing employees. The same data also allows the system to cross-check whether an operator is qualified for a certain task, because the system stores the skill matrix of each worker. If an unqualified operator attempts a task requiring special certification, the system blocks the operation and alerts the supervisor.
By integrating personnel traceability with the unique code, the system not only improves traceability but also strengthens the team culture. Workers are more cautious when they know their actions are accurately recorded. In the context of lost foam castings, where many process parameters depend on manual judgment, this traceability ensures that best practices are followed consistently.
Quality Traceability and Analysis
Quality traceability in my system is built on top of the process and product data. The quality analysis module uses the product knowledge base, enterprise experience base, model library, national standards, and customer-specific requirements to judge whether the dynamic product data is acceptable. A quality status dashboard is displayed on large screens in the workshop. It shows the real-time pass rate, defect distribution, and trends of key quality indicators. The system automatically produces statistical reports on the qualified product rate and defect cause analysis.
For instance, after a batch of lost foam castings is completed, the quality engineer can view the defect Pareto chart generated by the system. The chart is based on the following formula for the cumulative percentage of defect types:
$$F_k = \sum_{i=1}^{k} \frac{n_i}{N} \times 100\%$$
where \(n_i\) is the number of defects of type \(i\), and \(N\) is the total number of defective items. This analysis helps to prioritize improvement actions. If the major defect type is porosity, the system can then correlate porosity with pouring temperature, vacuum level, and coating permeability. The optimal parameter range can be determined by regression analysis, as shown by the following linear model:
$$Y = \beta_0 + \beta_1 X_1 + \beta_2 X_2 + \varepsilon$$
where \(Y\) is the porosity index, \(X_1\) is the pouring temperature, \(X_2\) is the vacuum level, and \(\varepsilon\) is the random error. The system performs the regression using the method of ordinary least squares and displays the coefficient estimates and confidence intervals. This quantitative approach enables the foundry to make data-driven decisions rather than relying on trial and error.
Table 4 gives an example of quality traceability results for a batch of lost foam castings, including the chemical composition of critical elements.
| Element | Measured value (%) | Specification limit (%) | Status |
|---|---|---|---|
| Si | 7.12 | 6.5 – 7.5 | Pass |
| Mg | 0.35 | 0.30 – 0.40 | Pass |
| Fe | 0.12 | ≤ 0.20 | Pass |
| Cu | 0.08 | ≤ 0.10 | Pass |
| Mn | 0.06 | ≤ 0.10 | Pass |
When an abnormal value is found, the system triggers an alert and marks the corresponding lost foam casting as “suspect”. The operator can then decide whether to quarantine the product or perform additional inspection. This proactive quality management prevents defective parts from reaching the customer and reduces the financial loss caused by late detection.
Application Effects and Further Improvements
The implementation of the life-cycle management system has brought significant benefits to the production of lost foam castings. The efficiency of data collection and quality inspection has improved dramatically. In the past, the data accuracy rate was low due to manual transcription, and incomplete data prevented thorough root cause analysis. Now, the system automatically captures more than 98% of the required process data with high accuracy. The management can access real-time dashboards from any location, which enables faster response to abnormalities and more agile production scheduling.
Another benefit is the optimization of process flows. The system identified several redundant steps in the previous manual workflow. For example, the same information often had to be entered into multiple separate systems. After integrating all modules, the redundant entry was eliminated. The time spent on data handling was reduced by about 40%, allowing the staff to focus on value-added activities such as process improvement and equipment maintenance.
The unique code based traceability also simplified the recall process. When a quality problem is detected at the customer site, the system can quickly identify all lost foam castings that share the same material batch, operator, or process parameter level. This fast recall capability enhances customer trust and minimizes the impact of the defect.
Beyond the production line, I also investigated the heat treatment process of aluminum alloy lost foam castings. Heat treatment is a critical step that affects the mechanical properties and dimensional stability of the final product. In cooperation with a research institute, I performed numerical simulations to control the temperature uniformity of the castings during heat treatment. The heat conduction in a solid is governed by the Fourier equation:
$$\frac{\partial T}{\partial t} = \alpha \nabla^2 T + \frac{\dot{q}}{\rho c_p}$$
where \(T\) is temperature, \(t\) is time, \(\alpha\) is the thermal diffusivity, \(\dot{q}\) is the internal heat generation rate, \(\rho\) is density, and \(c_p\) is the specific heat capacity. The heat treatment rack structure affects the airflow pattern and therefore the surface heat transfer coefficient. I simulated different rack designs with different hole diameters and distributions. The result showed that a bottom plate with a 600 mm large hole in the center and 30 mm small holes distributed around it provided the best temperature uniformity. The maximum temperature difference across the casting surface was reduced to within ±5°C, which is acceptable for the aerospace-grade aluminum alloy used in lost foam castings.
This heat treatment simulation is integrated into the life-cycle management system as a virtual process optimization module. The measured temperature history of each heat treatment batch is stored and bound to the unique codes of the lost foam castings in that batch. If a final mechanical property test fails, the system can immediately retrieve the exact heat treatment curve for that casting and compare it with the validated profile. This integration further enhances the completeness of the life-cycle management and supports continuous improvement.
Conclusion
In conclusion, the life-cycle management system I designed for lost foam castings successfully addresses the common problems of difficult process control, vague quality quantification, and poor traceability. The system relies on a unique mold code, which is bound to all production data from pattern assembly through pouring and heat treatment. The four-layer architecture with a robust network communication infrastructure ensures reliable and real-time data flow. The application layer offers powerful tools for monitoring, alarming, and traceability. Through the use of RFID, barcode scanners, PLCs, and configuration software, the system automates the collection of process data and eliminates manual errors. The personnel traceability adds accountability, and the quality analysis functions provide actionable insights for reducing defects.
Moreover, the integration of heat treatment simulation shows how numerical methods can complement the lifecycle management framework. By controlling the temperature uniformity during heat treatment, the system helps to ensure the final quality of lost foam castings. The actual application in lost foam casting enterprises has demonstrated that the system can significantly improve production efficiency, enhance product quality, and strengthen overall management capability. I believe that such an intelligent life-cycle management system will become the standard in modern foundries, especially for those producing high-value lost foam castings. The continuous evolution of this system will involve the adoption of more advanced analytics, such as machine learning-based quality prediction and digital twin technology, to further optimize the production of lost foam castings in the future.