
The lost wax investment casting process, also known as precision investment casting, is an advanced near-net-shape manufacturing technology. It is renowned for its capability to produce small to medium-sized metal castings with intricate internal geometries, compatibility with high-melting-point alloys, excellent dimensional accuracy, minimal machining allowances, and superior surface finish. Consequently, this process finds extensive application in demanding industries such as aerospace, automotive, and marine engineering. However, the practical implementation of lost wax investment casting is characterized by a complex multi-step procedure, a lengthy production cycle, and parameters that are often difficult to control precisely. Traditionally, the development of a robust casting process relied heavily on extensive and costly trial-and-error experimentation.
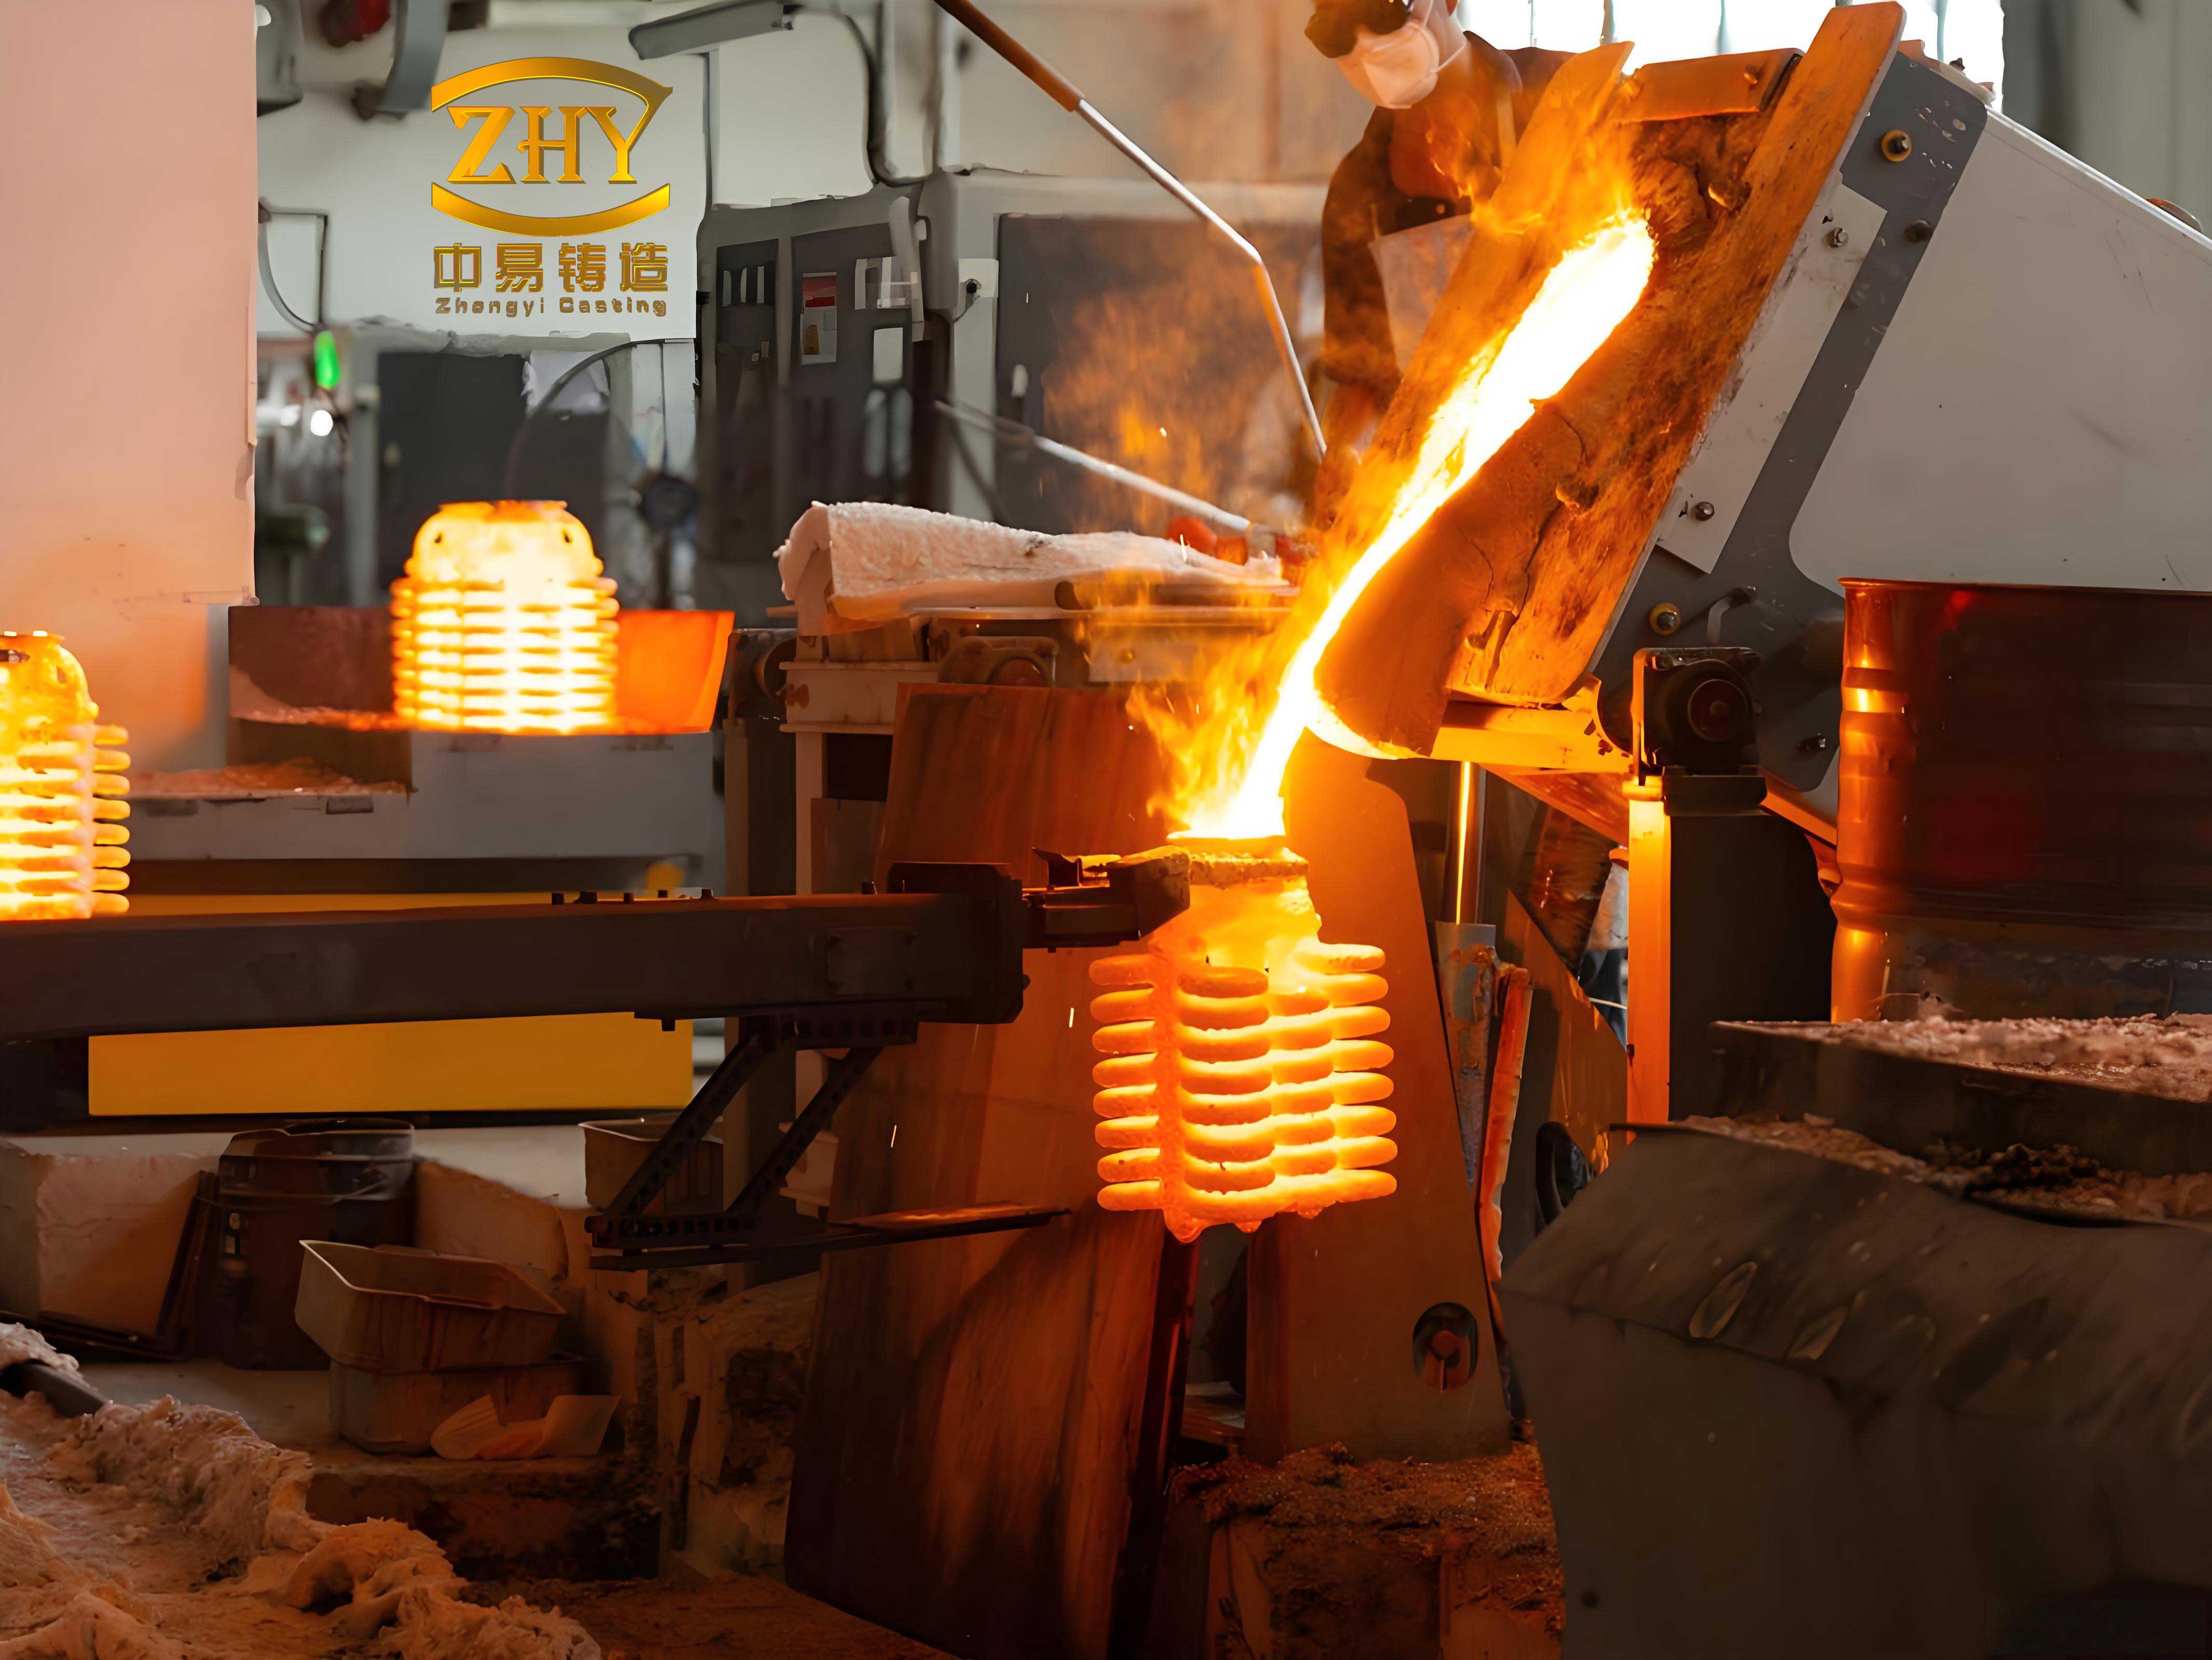
With the ongoing evolution of modern industry, castings are trending towards larger dimensions, more complex structures, and thinner wall sections. This escalation in complexity makes the prediction and mitigation of filling- and solidification-related defects a significant challenge in lost wax investment casting technology. The rapid advancement of numerical simulation technology has provided a powerful new tool for investigating the mold filling and solidification processes, and it is now widely employed to guide production practices. Numerical simulation allows for a virtual analysis of the entire casting process, enabling engineers to identify potential defects, optimize gating and feeding systems, and determine optimal process parameters before any physical prototype is created.
This article presents a detailed case study on the application of numerical simulation to optimize the lost wax investment casting process for a specific component. The focus is on a bypass valve casting, a representative part with demanding quality requirements. The methodology involves using commercial simulation software to analyze the initial process design, identify flaws, implement optimizations, and finally validate the revised process through actual production trials.
1. Component Analysis and Initial Process Design
The subject of this study is a bypass valve casting with an overall envelope dimension of 120 mm × 132 mm × 253 mm. The casting features a bent-pipe structure with wall thicknesses varying between 10 mm and 25 mm. The internal bore diameters range from φ51 mm to φ60 mm. The casting material is a low-alloy steel grade, and its weight is approximately 6.7 kg. The technical specifications mandate that the final casting must be free from defects such as shrinkage porosity, slag inclusions, and cracks.
From a casting design perspective, the geometry presents several challenges. Firstly, isolated thermal nodes, or “hot spots,” exist at junctions where thicker sections meet, as indicated in the component analysis. These areas are prone to shrinkage defects due to prolonged solidification. Secondly, a long, uniform-walled “L”-shaped section in the casting presents a challenge for effective feeding, as the long feeding distance increases the risk of micro-porosity. The primary strategy in the initial lost wax investment casting process design was to address these issues by positioning ingates (feeders) directly at the identified thermal nodes and along the long section to provide adequate liquid metal feed and promote directional solidification.
The initial gating system design comprised several key elements: a main horizontal runner, two vertical down-sprues of different cross-sections, and four separate ingates of varying sizes and shapes connecting the runner system to the casting cavity. A conical pouring cup was placed atop the horizontal runner. Table 1 summarizes the key dimensions of the initial gating system designed for the lost wax investment casting process.
| Gating Element | Dimensions (mm) | Description/Purpose |
|---|---|---|
| Horizontal Runner | 30 × 60 × 255 | Distributes metal from sprue to ingates. |
| Vertical Down-Sprue 1# | 30 × 30 × 120 | Channels metal from runner to upper ingates. |
| Vertical Down-Sprue 2# | 40 × 40 × 120 | Channels metal from runner to lower ingates. |
| Ingate 1# | 15 × 25 × 20 | Feeds a lower section of the casting. |
| Ingate 2# | φ60 × 20 (Semi-cylindrical) | Main feeder for the large cylindrical section. |
| Ingate 3# | Thk: 11, H: 15, L: 55 (x2) | Two symmetrical feeders on a ring section. |
| Ingate 4# | 25 × 50 × 40 | Feeder on the outer wall of a ring section. |
| Pouring Cup | Top φ90, Bottom φ50, H: 90 | Receives molten metal during pour. |
A full three-dimensional model of the casting assembly, including the part and the initial gating system for the lost wax investment casting process, was created using CAD software. This model served as the direct input for the subsequent numerical simulation.
2. Numerical Simulation of the Initial Lost Wax Investment Casting Process
The numerical simulation was performed using a commercially available finite-difference-based casting simulation software, MAGMA. The primary goal was to analyze the mold filling and solidification stages of the proposed lost wax investment casting process to predict potential defects. The simulation parameters were set to closely mirror the intended production conditions, as detailed below:
- Mesh: Approximately 5 million cells.
- Process: Gravity pouring in lost wax investment casting.
- Casting Material: Low-alloy steel (20Mn5M).
- Mold Material: Zircon sand ceramic shell.
- Shell Preheat Temperature (Tshell): 950 °C.
- Heat Transfer Coefficient (h): 500 W/(m²·K).
- Pouring Temperature (Tpour): 1560 °C.
- Pouring Rate: 3 kg/s.
- Cooling: Air cooling.
2.1 Filling Analysis of the Initial Design
The simulation of the filling stage revealed significant issues with the initial lost wax investment casting process layout. The analysis of the velocity field and fluid front progression provided critical insights.
At 10% fill fraction, the metal entered through the pouring cup, flowed along the horizontal runner, and primarily entered the mold cavity through Ingates 1#, 2#, and 4#. A critical observation was that the flow into the vertical down-sprue 1# and its connected Ingates 3# was minimal and occurred in a discontinuous, dribbling manner. This discontinuous flow is a classic precursor to cold shut defects, where two advancing fluid fronts lose sufficient heat and fail to fuse together properly. The initial metal entry into the main cavity was also turbulent, characterized by conflicting flow fronts from the different ingates. The maximum fluid velocity during this phase reached approximately 1.5 m/s. The flow behavior can be partially assessed by considering the Reynolds number (Re) for flow in the channels, given by:
$$ Re = \frac{\rho v D_h}{\mu} $$
where $\rho$ is the fluid density, $v$ is the velocity, $D_h$ is the hydraulic diameter, and $\mu$ is the dynamic viscosity. While the exact Re calculation is complex for a transient, multi-path flow with varying temperature, high velocities and conflicting flow directions indicate conditions favorable for turbulence, air entrainment, and oxide formation.
By 30% fill, most of the casting cavity was filled, but metal was now seen back-filling from the casting into Ingates 3# and the connected down-sprue. This reverse flow pattern is undesirable. The cavity was completely filled at 46% of the total pouring time. The overall filling pattern was deemed unstable, with a high risk of creating cold shuts, gas porosity (from entrapped air due to turbulent flow), and possible oxide inclusions.
3. Process Optimization for Lost Wax Investment Casting
3.1 Redesign of the Gating System
The root cause of the turbulent and unbalanced fill was identified as the asymmetric and competing flow paths from multiple ingates. The pouring cup’s location over the horizontal runner caused metal to split unevenly. The core optimization for the lost wax investment casting process involved a strategic repositioning of the pouring cup. It was relocated directly above Ingate 2#, which fed the largest cylindrical section of the casting. This modification aimed to create a more controlled, sequential filling pattern where the metal would first fill the main body of the casting via Ingate 2# before gradually rising to fill the upper sections through other channels, thereby promoting a calmer fill.
3.2 Simulation of the Optimized Lost Wax Investment Casting Process
The revised model was simulated under identical process parameters to evaluate the improvement.
Filling Analysis: The filling sequence was markedly improved. At 15% fill, metal flowed smoothly from the pouring cup directly into the casting cavity via Ingate 2#. Flow into other ingates was negligible at this early stage, resulting in a single, well-defined advancing front. The maximum velocity was around 1.8 m/s but was more streamlined. By 30% fill, the metal front rose steadily and calmly within the cavity. A cross-section view at 60% fill showed the velocity gradient: higher speeds (≈1.8 m/s) were observed in the upper cylindrical region, while the metal slowed down significantly (≈0.6 m/s) as it filled the lower, more complex sections. This tapering of velocity is beneficial for reducing erosion and air entrapment. The filling was completed in a stable, predictable manner.
Solidification and Defect Prediction: The solidification analysis is crucial in lost wax investment casting to predict shrinkage defects. The software tracks the fraction of solid over time. The key is to avoid isolated liquid pools, known as “hot tears” or “isolated liquid pockets,” which inevitably lead to macro- or micro-shrinkage. The solidification sequence was analyzed at different solid fractions:
- At 64% solid fraction, the regions fed by Ingates 3# and 4# solidified without forming isolated liquid zones, confirming their effectiveness.
- At 77% solid fraction, the entire casting, except for the region below Ingate 2#, was solid. The liquid metal had retreated continuously into the ingates, maintaining a feed path.
- At 98% solid fraction, the last liquid metal was contained within Ingate 2# itself.
This pattern demonstrates a successful directional solidification sequence, where the casting solidifies first, followed by the ingates, and finally the runners. This is the ideal scenario for feeding shrinkage. The solidification time ($t_s$) for a section can be estimated using Chvorinov’s rule:
$$ t_s = B \left( \frac{V}{A} \right)^n $$
where $V$ is the volume, $A$ is the surface area, $B$ is a mold constant, and $n$ is an exponent (often ~2). A well-designed lost wax investment casting process ensures that the $V/A$ ratio (modulus) is largest in the feeder, then in the ingate, and smallest in the casting, guaranteeing the described solidification order.
The software’s porosity prediction module, which calculates the volume deficit due to shrinkage, indicated that the major shrinkage porosity was confined to the pouring cup and the main runners—areas intended to be sacrificial. Within the casting itself, only a very small, low-risk region of potential micro-shrinkage was predicted near the junction to Ingate 2#. This minimal risk could be further mitigated during production by applying insulating material (insulation wrap) around the feeder necks to slow their solidification and enhance feeding efficiency.
4. Production Validation of the Optimized Lost Wax Investment Casting Process
The optimized process design derived from numerical simulation was translated into physical production to validate its effectiveness.
4.1 Shell Building
The lost wax investment casting process began with the creation of a ceramic shell. A fully colloidal silica-based process was employed. The shell building parameters are summarized in Table 2. A key practical consideration from the initial design phase was implemented: sufficient clearance was maintained between the casting and adjacent ingates to prevent shell material from blocking narrow gaps during slurry dipping, which could create local hot spots and disrupt the intended solidification sequence.
| Layer | Slurry Material | Viscosity (Zahn #4 Cup, sec) | Stucco Material | Stucco Grit | Drying Time |
|---|---|---|---|---|---|
| Primary 1 & 2 | Colloidal Silica + Zircon Flour | 42 – 48 | Zircon Sand | 80 – 120 | 6 – 8 h |
| Transition (3) | Colloidal Silica + Molochite Flour | 21 – 27 | Molochite Sand | 30 – 60 | ≥ 10 h |
| Back-up (4-6) | Colloidal Silica + Molochite Flour | 16 – 21 | Molochite Sand | 16 – 30 | ≥ 12 h |
| Seal Coat (7) | Colloidal Silica + Molochite Flour | 10 – 15 | – | – | ≥ 24 h |
The completed shells were dewaxed and then fired at 950 ± 10 °C for over 1 hour to achieve the required strength and remove residual volatiles, matching the simulation’s shell preheat temperature.
4.2 Melting, Pouring, and Process Enhancement
After firing and cooling, the shells were prepared for pouring. The runner and feeder areas (especially around Ingate 2#) were wrapped with ceramic fiber insulation, as suggested by the simulation post-analysis, to further promote thermal gradient and feeding. The shells were preheated to approximately 950°C. The alloy was melted in a medium-frequency induction furnace and poured at a temperature of 1560 ± 10°C, consistent with the simulation parameters.
4.3 Quality Inspection and Results
The castings were knocked out, cut off from the tree, and finished. Comprehensive inspection was carried out to validate the lost wax investment casting process.
Chemical Composition and Mechanical Properties: Spectroscopic analysis confirmed the chemical composition met the material specification. Test bars cast from the same heat were subjected to heat treatment (normalizing) and mechanical testing. The results, detailed in Table 3, exceeded all specified minimum requirements for tensile strength, yield strength, elongation, reduction of area, and impact energy, confirming the integrity of the material produced by the lost wax investment casting process.
| Test | Temperature | Property | Specification (Min) | Result |
|---|---|---|---|---|
| Tensile | Room Temp. | Yield Strength (Rp0.2), MPa | 275 | 385 |
| Tensile Strength (Rm), MPa | 485 | 559 | ||
| Elongation (A), % | 20 | 31.5 | ||
| Reduction of Area (Z), % | 35 | 54 | ||
| Tensile | 300 °C | Yield Strength (Rp0.2), MPa | 210 | 238 |
| Tensile Strength (Rm), MPa | 435 | 524 | ||
| Charpy Impact | 0 °C | Impact Energy (KV2), J | 40 (Avg.) | 58.0, 67.1, 56.4 |
Dimensional and Defect Inspection: Visual inspection and surface roughness checks confirmed good surface quality with no visible defects like cracks, cold shuts, or gross porosity. To rigorously assess internal quality beyond specification requirements, all four trial castings were subjected to X-ray radiographic inspection. No shrinkage porosity, gas holes, slag inclusions, or cracks were detected in any of the castings. Furthermore, one casting was destructively sectioned at critical locations, including the previously identified thermal nodes and wall transition zones. Macroscopic examination of the sections revealed sound, dense metal with no evidence of shrinkage defects or cracks.
5. Conclusion
This case study demonstrates the powerful synergy between numerical simulation and practical foundry engineering in advancing lost wax investment casting technology. The systematic approach yielded several key conclusions:
- Predictive Power of Simulation: Numerical simulation of the initial lost wax investment casting process successfully identified critical flaws in the filling pattern, such as turbulent flow, discontinuous metal front advancement, and the risk of cold shuts and gas entrapment. This pre-emptive analysis prevented costly and time-consuming physical trials based on a flawed design.
- Effective Optimization: A relatively simple but strategically crucial modification—repositioning the pouring cup to align with the main feeder—transformed the filling behavior from chaotic to stable and sequential. Subsequent solidification simulation confirmed the establishment of a favorable directional solidification pattern, effectively eliminating isolated liquid zones and minimizing shrinkage risk within the casting itself.
- Practical Process Integration: The optimized design incorporated practical lost wax investment casting knowledge, such as ensuring adequate clearance for shell building to prevent local hot spots. The simulation also guided a secondary process enhancement—the application of insulation wraps—to further secure the feeding efficiency predicted by the model.
- Successful Validation: The production of sound castings, validated by rigorous mechanical testing, non-destructive X-ray inspection, and destructive sectioning, provided conclusive evidence that the optimized lost wax investment casting process was robust and capable of meeting stringent quality requirements. The properties of the final components fully satisfied the technical specifications.
In summary, the integration of numerical simulation into the process development cycle for lost wax investment casting enables a more scientific, efficient, and reliable pathway from design to production. It moves the industry away from empirical guesswork towards a knowledge-driven methodology, ensuring higher first-pass success rates, improved product quality, and reduced lead times and costs for complex castings.